간략화
이 전략은 DMI 지표가 트렌드 방향을 판단하고 RSI 지표가 오버 소드를 판단하는 것과 결합하여 보다 완전한 트렌드를 따르는 거래 전략을 구현한다. DMI 지표가 트렌드를 판단하고 RSI 지표가 오버 소드를 표시할 때, 상응하는 오프 또는 시외를 한다. 동시에 수익을 잠금하기 위해 이동적 손실을 설정한다.
전략 원칙
- DMI 지표를 사용하여 트렌드 방향을 판단합니다.
- DMI는 3개의 곡선으로 구성된다: +DI는 상승세를 나타내고, -DI는 하락세를 나타내고, ADX는 트렌드의 강도를 판단한다.
- +DI>-DI가 상승 추세일 때, 더 많이; -DI>+DI가 하락 추세일 때, 적당히
- RSI를 통해 과매매를 판단하는 방법
- RSI는 한 기간 동안의 평균 종결 상승과 하락을 비교하여 과매매 또는 과매매 여부를 판단합니다.
- RSI가 30보다 낮으면 과매매, 70보다 높으면 과매매
- DMI의 추세 방향 판단과 RSI의 과매매 판단을 결합하여 시장의 리듬을 더 잘 파악할 수 있습니다.
- DMI가 상승 추세라고 판단하고 RSI가 과매매 할 때, 더 나은 시간을 할애 할 수 있습니다.
- DMI가 하향 추세라고 판단하고 RSI가 과매매 할 때, 더 나은 코카이팅 시점
- 이윤을 고정하기 위해 이동 중지 설정
강점 분석
이 전략은 다음과 같은 장점을 가지고 있습니다.
- 트렌드 판단과 과매매 판단을 결합하여 불안정한 시장에서 자주 거래하는 것을 피하십시오.
- 유행 지표 DMI와 RSI를 사용하여, 매개 변수 선택이 쉽고, 실습 검증이 충분하다
- 이윤을 고정하기 위한 이동식 중지 설정은 어느 정도 중지 손실을 방지할 수 있습니다.
- 규칙이 명확하고 이해하기 쉽고, 절차가 간단하고 실행하기 쉽습니다.
위험 분석
이 전략에는 몇 가지 위험도 있습니다.
- DMI와 RSI는 모두 가짜 신호를 발생시키는데, 이는 불필요한 손실을 초래할 수 있습니다.
- 이동식 정지 설정이 잘못되면 너무 일찍 또는 너무 많이 정지할 수 있습니다.
- 은 은 은 은 은
- 트렌드 전략에 따라, 트렌드가 역전될 때 적시에 손실을 막을 수 없습니다.
최적화 방향
이 전략은 다음과 같은 부분에서 최적화될 수 있습니다.
- 변동률 지표 필터링과 함께 흔들림 현상
- 캔들 형상 판단과 함께 가짜 돌파구를 피하십시오.
- 중요한 지지 저항 위치 근처에 적당한 손실 제한 손실을 설정
- 트렌드를 판단하는 기계학습 모형을 추가합니다.
- 동적으로 최적화된 DMI와 RSI의 변수
결론
이 전략은 전체적으로 DMI를 통해 트렌드 방향을 판단하고, RSI를 통해 과매매를 판단하여 중장선 거래 기회를 잡습니다. 동시에 수익을 잠금하기 위해 이동적 손실을 설정합니다. 이 전략의 파라미터를 선택하는 것은 간단하고, 거래 규칙은 명확하고, 실행하기 쉽습니다. 그러나 조준 및 상쇄가 적절하지 않은 위험이 있습니다.
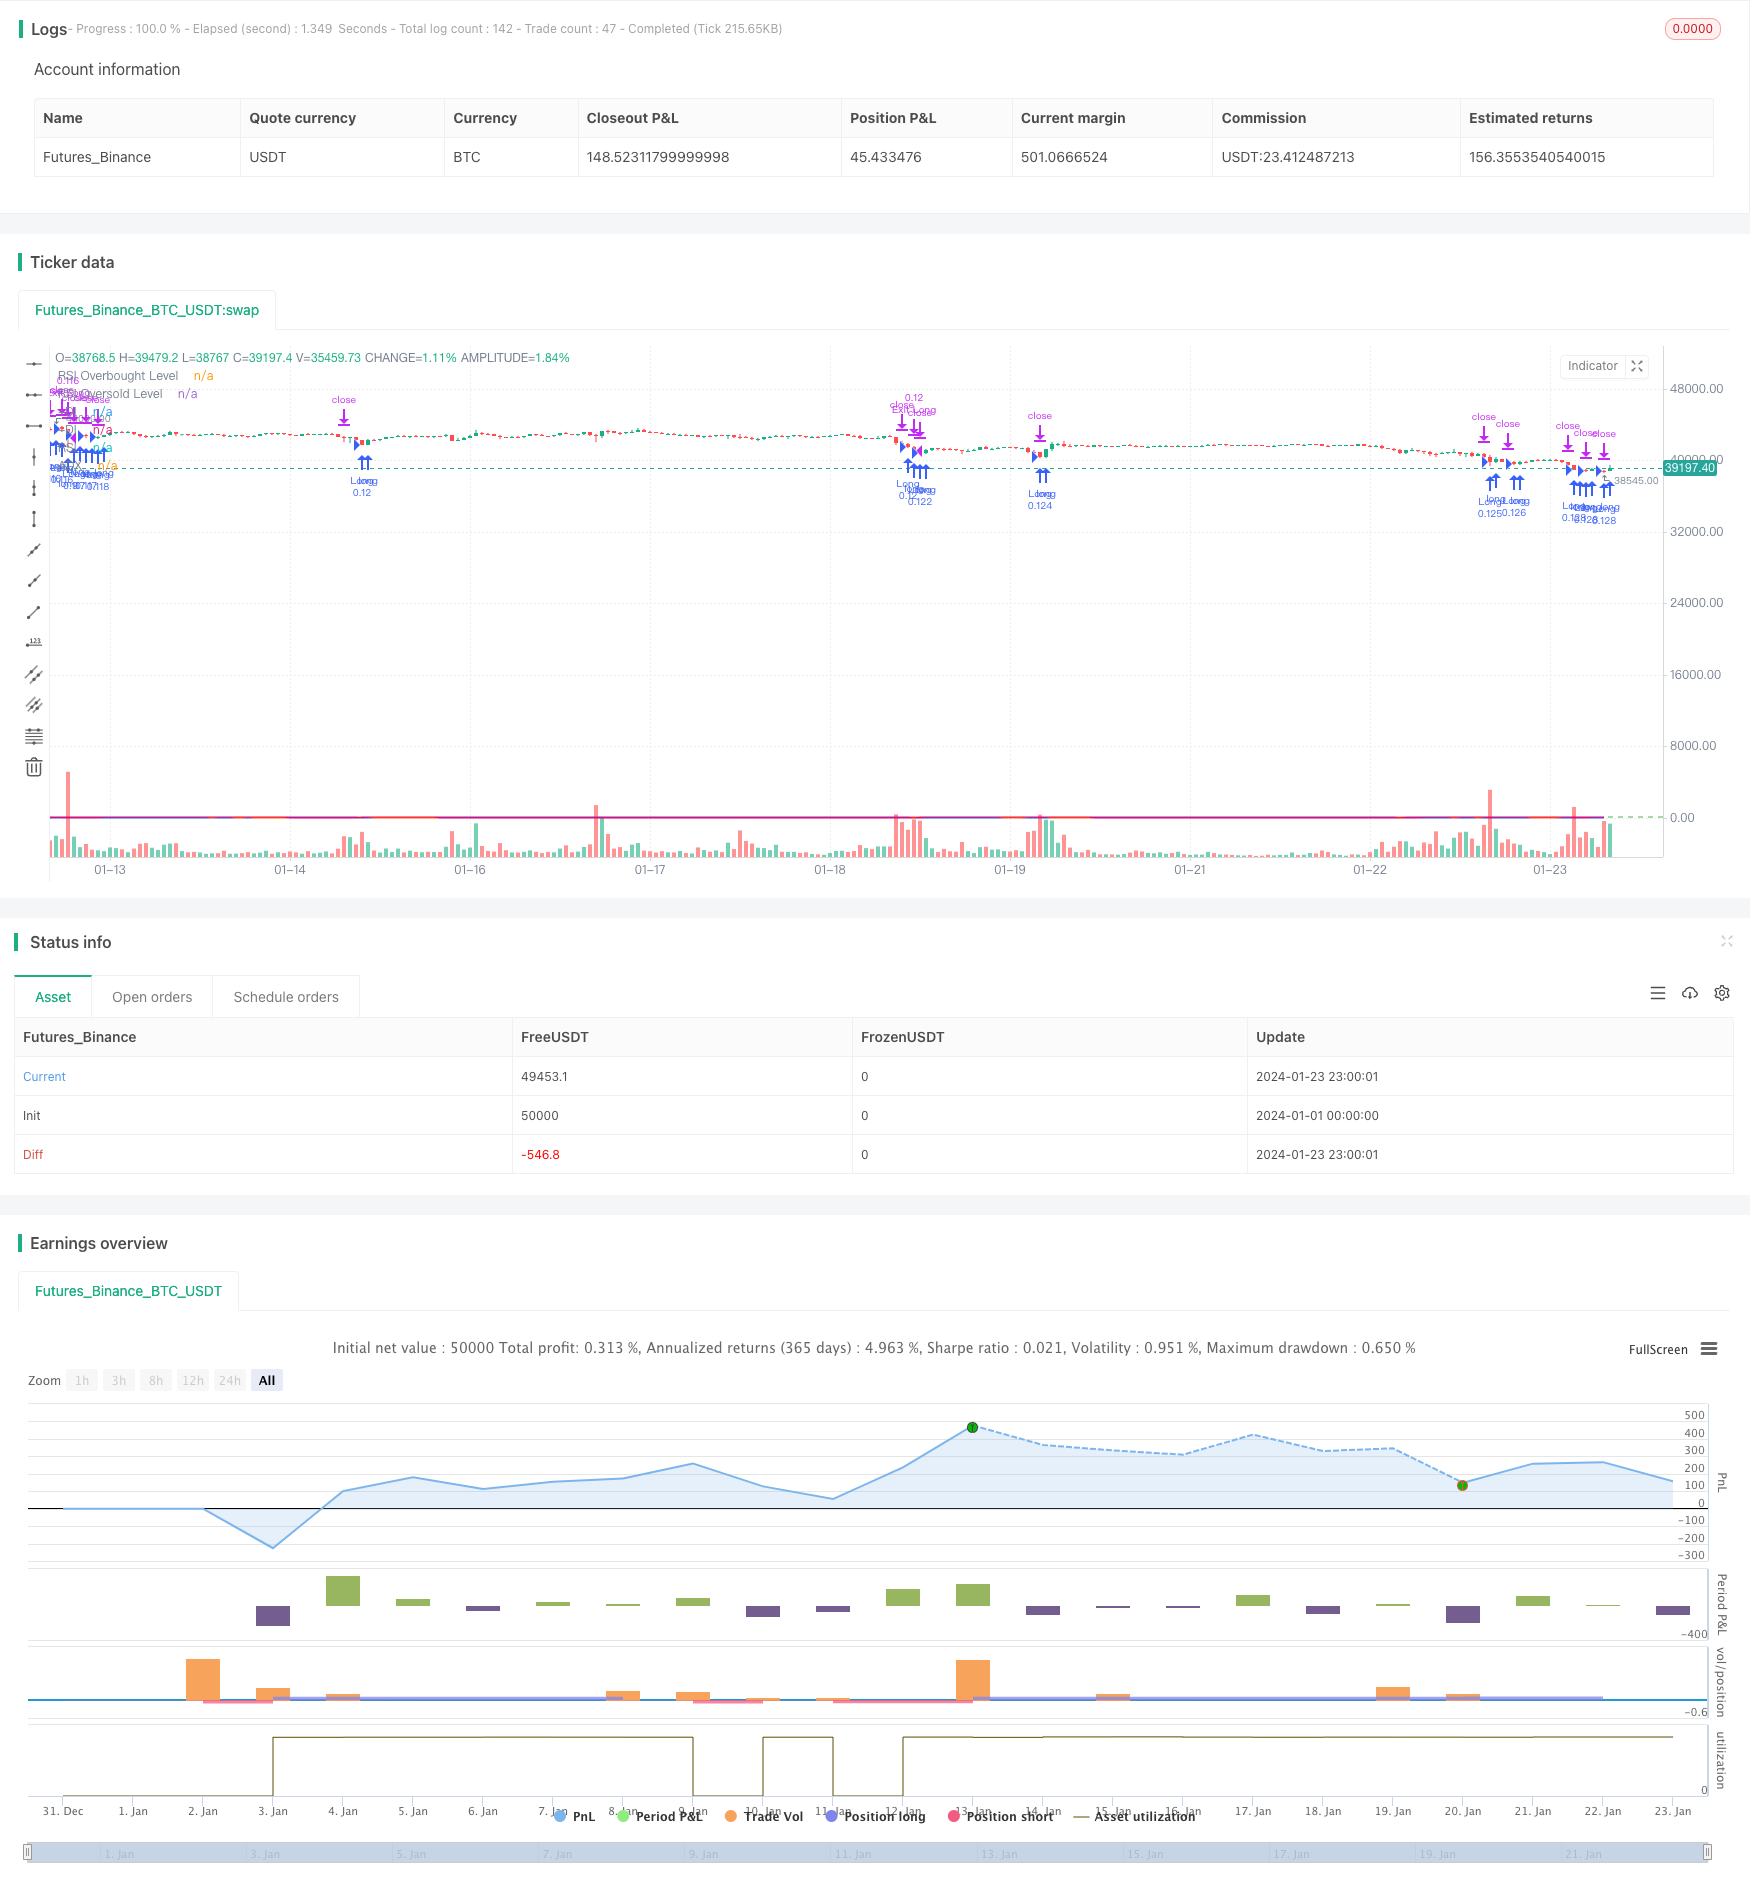
전략 소스 코드
/*backtest
start: 2024-01-01 00:00:00
end: 2024-01-24 00:00:00
period: 1h
basePeriod: 15m
exchanges: [{"eid":"Futures_Binance","currency":"BTC_USDT"}]
*/

// This Pine Script™ code is subject to the terms of the Mozilla Public License 2.0 at https://mozilla.org/MPL/2.0/
// © YingYangJPN

//@version=5
strategy("DMI and RSI Strategy", overlay=true, initial_capital=10000, default_qty_type=strategy.percent_of_equity, default_qty_value=10)

// DMI indikatörünü tanımlayalım
lensig = input.int(14, title="ADX Smoothing", minval=1, maxval=50)
len = input.int(14, minval=1, title="DI Length")
up = ta.change(high)
down = -ta.change(low)
plusDM = na(up) ? na : (up > down and up > 0 ? up : 0)
minusDM = na(down) ? na : (down > up and down > 0 ? down : 0)
trur = ta.rma(ta.tr, len)
plus = fixnan(100 * ta.rma(plusDM, len) / trur)
minus = fixnan(100 * ta.rma(minusDM, len) / trur)
sum = plus + minus
adx = 100 * ta.rma(math.abs(plus - minus) / (sum == 0 ? 1 : sum), lensig)
trailing_stop_loss_factor = input.float(0.50, "Trailing Stop Loss Factor", step = 0.01)

// RSI indikatörünü tanımlayalım
rsiLength = input.int(14, minval=1, title="RSI Length")
rsiSource = input(close, title="RSI Source")
rsiOverbought = input.int(70, title="RSI Overbought Level")
rsiOversold = input.int(30, title="RSI Oversold Level")
rsiValue = ta.rsi(rsiSource, rsiLength)

// Uzun pozisyon açma koşullarını tanımlayalım
longCondition1 = rsiValue < rsiOversold // RSI oversold seviyesinin altındaysa
longCondition2 = adx > 20 // ADX 20'den büyükse
longCondition3 = minus > plus

// Kısa pozisyon açma koşullarını tanımlayalım
shortCondition1 = rsiValue > rsiOverbought // RSI overbought seviyesinin üstündeyse
shortCondition2 = adx > 20 // ADX 20'den büyükse
shortCondition3 = plus > minus

// Uzun pozisyon açalım
if longCondition1 and longCondition2 and longCondition3
    strategy.entry("Long", strategy.long)


// Kısa pozisyon açalım
if shortCondition1 and shortCondition2 and shortCondition3
    strategy.entry("Short", strategy.short)

// Trailing Stop Loss
longTrailingStopLoss = strategy.position_avg_price * (1 - trailing_stop_loss_factor / 100)
shortTrailingStopLoss = strategy.position_avg_price * (1 + trailing_stop_loss_factor / 100)
if strategy.position_size > 0
    strategy.exit("Exit Long", "Long", stop  = longTrailingStopLoss)
if strategy.position_size < 0
    strategy.exit("Exit Short", "Short", stop = shortTrailingStopLoss)

// DMI ve RSI indikatörlerini grafiğe çizelim
plot(adx, color=#F50057, title="ADX")
plot(plus, color=#2962FF, title="+DI")
plot(minus, color=#FF6D00, title="-DI")
plot(rsiValue, color=#9C27B0, title="RSI")
hline(rsiOverbought, title="RSI Overbought Level", color=#E91E63, linestyle=hline.style_dashed)
hline(rsiOversold, title="RSI Oversold Level", color=#4CAF50, linestyle=hline.style_dashed)