
개요
동적 청탁 전략은 이동 평균 지표와 K선 모형 모델을 결합하여 거래 기회를 발견하기 위해 파격점과 조정점을 식별하는 중·단계 거래 전략이다. 이 전략은 보잉 옵션, 보잉 옵션, 선물과 같은 높은 리버리지 금융 상품의 거래에 적합하다.
전략 원칙
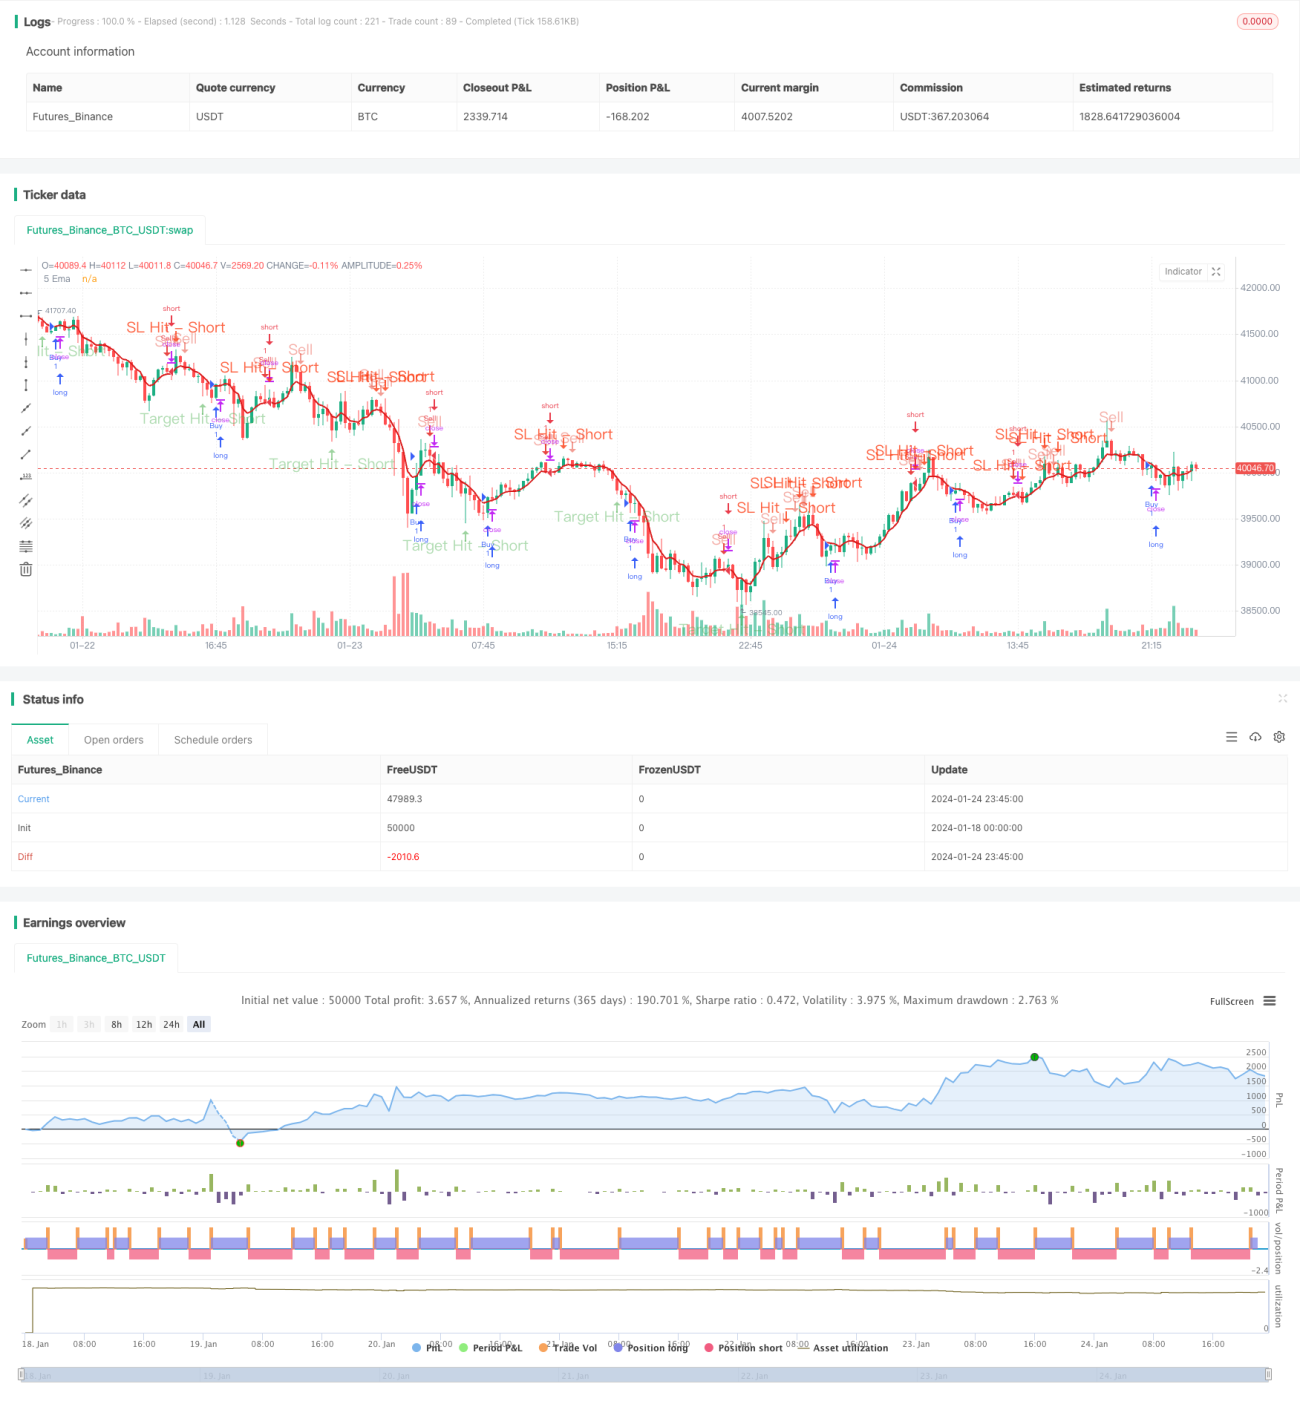
이 전략의 핵심 논리는 5일 간단한 이동 평균을 기반으로 한다. 가격이 이 평균을 돌파할 때, 폭파의 최고점 또는 최저점 K 선이 형성되며, 이 시점은 잠재적인 상위 또는 하위 신호이다. 가격이 평균을 돌파하는 두 번째 K 선이 닫히면, 이전 폭파의 최저 가격 또는 최고치를 파기하지 않으면 진입 신호가 형성된다. 그 다음에는 스톱로스 포인트와 스톱 스톱 목표에 따라 리스크 <unk>을 설정한다.
가격이 상향으로 5일 평균선을 돌파하고 종결될 때, 앞의 하락 K 선의 최고 가격은 스톱 로스트이며, 최저 가격은 일정 회귀 범위를 빼고 리스크 수익률을 스톱 로스트 목표로 한다. 가격이 하락으로 5일 평균선을 돌파하고 종결될 때, 앞의 하락 K 선의 최저 가격은 스톱 로스트이며, 최고 가격은 일정 회귀 범위를 더하여 리스크 수익률을 스톱 로스트 목표로 한다.
이 전략은 또한 선택적인 필터링 조건을 제공합니다. 즉, 현재 K 선의 종료 가격은 K 선에 비해 약간 낮거나 약간 높습니다. 이것은 부분적으로 잘못된 신호를 피할 수 있습니다.
전략적 강점 분석
- 전략적 아이디어는 명확하고 간결하며 이해하기 쉽고 실행이 가능합니다.
- 이동 평균을 기반으로 트렌드를 파악하고 회전을 할 수 있습니다.
- K선 형태와 결합하여 보다 정확한 거래 시점을 발견할 수 있습니다.
- 위험과 수익의 일치, 합리적인 거래 원칙
- 자신의 거래 종류와 주기에 따라 매개 변수를 조정할 수 있습니다.
- 선택 가능한 필터링 조건을 제공하여 잘못된 신호를 줄일 수 있습니다.
전략적 위험 분석
- 다른 기술 지표 전략과 마찬가지로, 포착, 차단 추적 등의 위험도 발생할 수 있습니다.
- 이동 평균 지표는 지연되어 짧은 선의 큰 흐름을 놓칠 수 있습니다.
- 지진 추세에서는 잘못된 신호가 더 많이 발생하기 쉽다.
- 정책 변수 설정이 잘못되면 과다 거래가 발생할 수 있습니다.
합리적인 스톱로스, 적절히 느슨한 포지션 보유, 낮은 주파수 거래를 선택하는 등의 방법으로 위험을 줄일 수 있다. 또한 다른 지표와 결합하여 신호 필터링을 고려할 수 있다.
전략 최적화 방향
- 다양한 변수 조합을 테스트하여 최적의 변수를 선택할 수 있습니다.
- 다른 지표 또는 그래프와 결합하여 신호 필터링을 최적화할 수 있습니다.
- 동적 상쇄, 이동 상쇄와 같은 방법을 고려할 수 있습니다.
- 기계 학습 모델과 결합 가능한 자동 최적화 매개 변수
- 자율적 손해 방지 플러그인을 개발할 수 있습니다
- 다양한 종, 다양한 기간에 걸친 견고성 검증 전략을 시도할 수 있습니다.
요약하다
이 전략은 전체적으로 이해하기 쉽고 구현하기 쉬운 중단계 거래 전략이다. 이동 평균과 K 선 모양을 뛰어넘어 트렌드 전환점을 인식하여 합리적인 위험 제어 프레임 워크 아래에서 작동한다. 개선의 여지가 있지만, 핵심 아이디어는 보편적이며 학습 및 적용할 가치가 있다. 변수 조정, 신호 필터링과 같은 최적화 조치를 통해 이 전략을 더 광범위한 거래 관행에 적용할 수 있다.
- 1