개요
이중기반지표추적전략은 디지털화폐의 양적거래전략이다. 이전략은 123회전지표와 Qstick지표의 두기반지표의 신호를 결합하여 거래신호를 생성하고, 두지표의 일관성에 따라 출입 여부를 결정한다.
전략 원칙
이 전략은 두 부분으로 구성되어 있습니다.
- 123 역전 지표
이 지표의 거래 신호는 마지막 두 K 선의 종결 가격에서 나온다. 종결 가격의 반전 (즉, 종결 가격이 상승에서 하락으로 전환하거나 하락에서 상승으로 전환) 이 발생하고 동시에 무작위 지표의 조건을 충족하면 거래 신호가 발생한다.
구체적으로, 만약 전날 2일 종전 가격이 하락하면, 오늘 종전 가격이 상승하고, 동시에 9일 무작위 느린 선이 50보다 낮으면, 구매 신호를 발생시킨다; 만약 전날 2일 종전 가격이 상승하고, 오늘 종전 가격이 하락하고, 동시에 9일 무작위 빠른 선이 50보다 높으면, 판매 신호를 발생시킨다.
- Qstick 지표
이 지표는 오픈 가격과 클로즈 가격의 차이의 간단한 이동 평균을 계산하여 다면과 공백의 힘을 판단한다. 그것은 0 축을 통과하여 거래 신호를 생성한다.
Qstick 위에 0축을 통과하면, 다면 힘이 증가하여 구매 신호를 생성합니다. Qstick 아래 0축을 통과하면, 공중 힘이 증가하여 판매 신호를 생성합니다.
이중 기지 지표는 123 반전 지표와 Qstick 지표의 거래 신호를 종합적으로 고려하고, 두 신호가 일치하면 그에 따른 거래 행동을 취하는 전략을 따른다.
우위 분석
이중기반 지표는 두 가지 다른 유형의 지표의 신호를 결합하는 전략을 따르며 거래 신호의 정확성을 향상시킬 수 있습니다. 단일 지표에 비해 잘못된 신호를 효과적으로 줄이고 더 높은 승률을 얻을 수 있습니다.
또한, 이 전략은 두 지표 신호가 일치하는 경우에만 개입하여 위험을 효과적으로 제어하고 이중 기저 차이를 방지할 수 있다.
위험과 해결책
- 지표 신호가 생성되는 시간에는 차이가 있으며, 완벽하게 조화를 이루지 못합니다.
매개 변수를 통해 두 지표의 매개 변수를 조정하여 신호의 발생 주파수와 리듬을 더 조율할 수 있다.
- 이중기반의 오차로 인해 초단선 운행
최소 지분 기간을 설정할 수 있으며, 자주 위탁을 철회하고 위탁을 만들지 않습니다.
최적화 방향
두 지표의 길이 변수를 최적화하여 최적의 변수 조합을 찾습니다.
다른 임의 지표 변수 구성을 테스트합니다.
손실을 막는 전략에 참여
요약하다
이중기반지표는 여러 기본지표의 조합을 통해 전략의 장점을 따를 수 있으며, 신호 품질을 향상시키고 위험을 통제하면서 더 높은 수익을 얻을 수 있다. 이 전략에는 추가적인 매개 변수 최적화 및 전략 최적화에 대한 공간이 있으며, 테스트를 통해 전략을 더 안정적으로 신뢰할 수 있다.
/*backtest
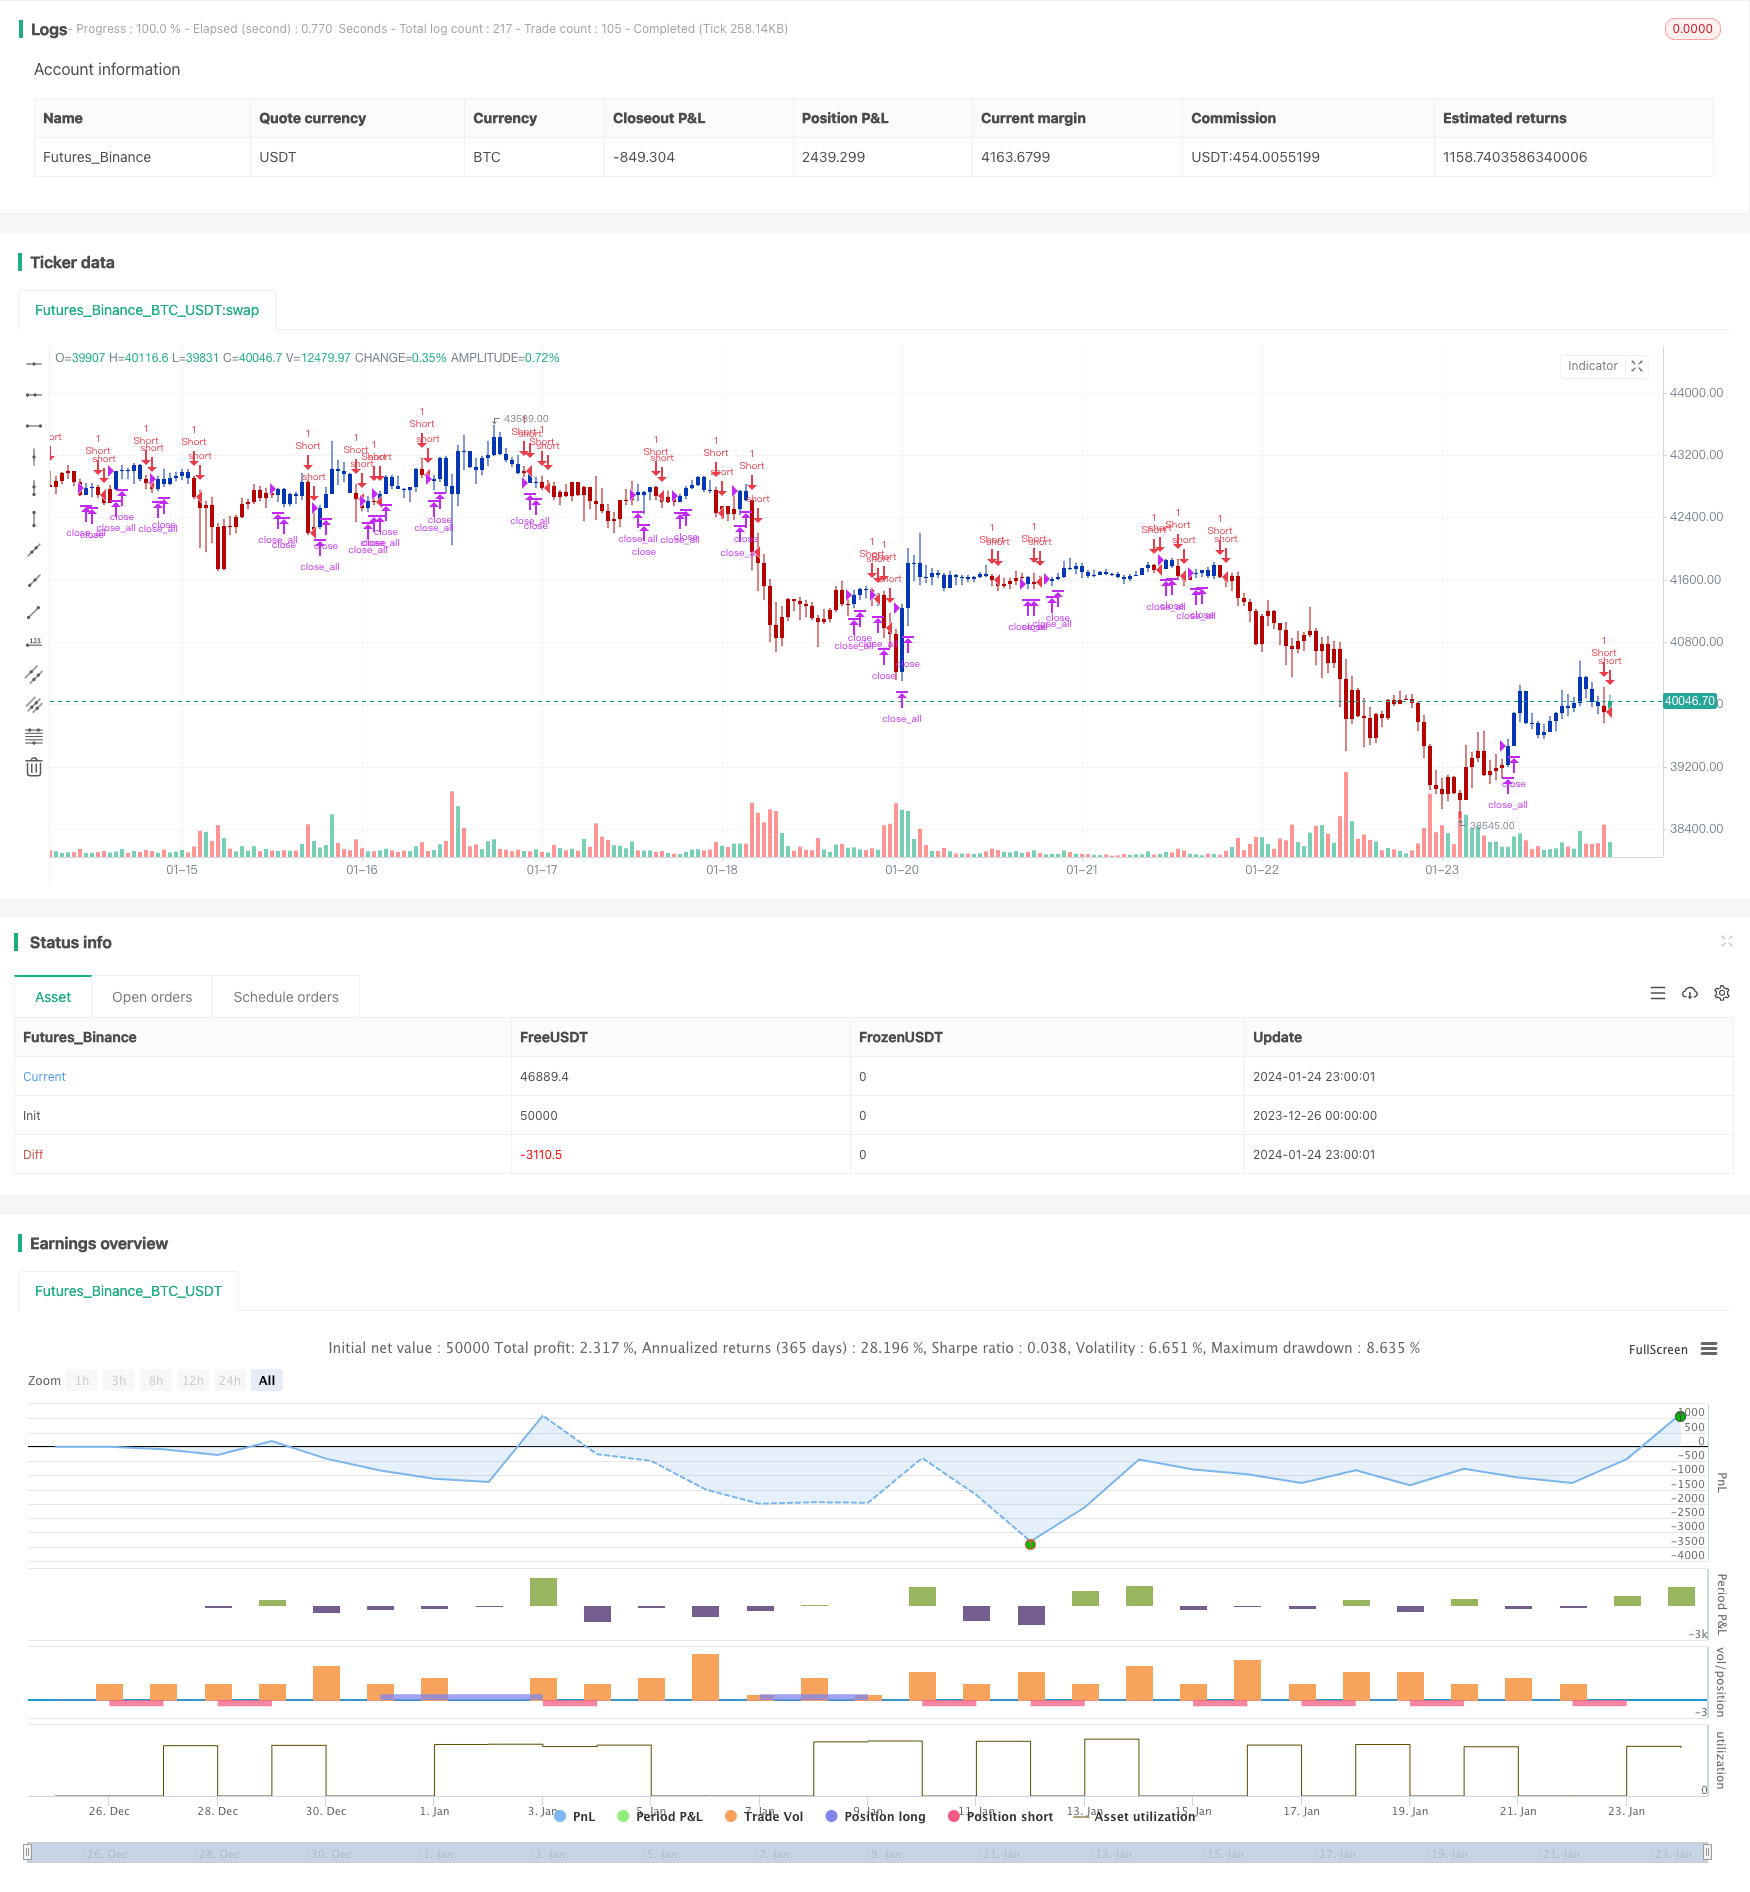
start: 2023-12-26 00:00:00
end: 2024-01-25 00:00:00
period: 1h
basePeriod: 15m
exchanges: [{"eid":"Futures_Binance","currency":"BTC_USDT"}]
*/
//@version=4
////////////////////////////////////////////////////////////
// Copyright by HPotter v1.0 24/05/2021
// This is combo strategies for get a cumulative signal.
//
// First strategy
// This System was created from the Book "How I Tripled My Money In The
// Futures Market" by Ulf Jensen, Page 183. This is reverse type of strategies.
// The strategy buys at market, if close price is higher than the previous close
// during 2 days and the meaning of 9-days Stochastic Slow Oscillator is lower than 50.
// The strategy sells at market, if close price is lower than the previous close price
// during 2 days and the meaning of 9-days Stochastic Fast Oscillator is higher than 50.
//
// Second strategy
// A technical indicator developed by Tushar Chande to numerically identify
// trends in candlestick charting. It is calculated by taking an 'n' period
// moving average of the difference between the open and closing prices. A
// Qstick value greater than zero means that the majority of the last 'n' days
// have been up, indicating that buying pressure has been increasing.
// Transaction signals come from when the Qstick indicator crosses through the
// zero line. Crossing above zero is used as the entry signal because it is indicating
// that buying pressure is increasing, while sell signals come from the indicator
// crossing down through zero. In addition, an 'n' period moving average of the Qstick
// values can be drawn to act as a signal line. Transaction signals are then generated
// when the Qstick value crosses through the trigger line.
//
// WARNING:
// - For purpose educate only
// - This script to change bars colors.
////////////////////////////////////////////////////////////
Reversal123(Length, KSmoothing, DLength, Level) =>
vFast = sma(stoch(close, high, low, Length), KSmoothing)
vSlow = sma(vFast, DLength)
pos = 0.0
pos := iff(close[2] < close[1] and close > close[1] and vFast < vSlow and vFast > Level, 1,
iff(close[2] > close[1] and close < close[1] and vFast > vSlow and vFast < Level, -1, nz(pos[1], 0)))
pos
Qstick(Length) =>
pos = 0.0
xR = close - open
xQstick = sma(xR, Length)
pos:= iff(xQstick > 0, 1,
iff(xQstick < 0, -1, nz(pos[1], 0)))
pos
strategy(title="Combo Backtest 123 Reversal & Qstick Indicator", shorttitle="Combo", overlay = true)
line1 = input(true, "---- 123 Reversal ----")
Length = input(14, minval=1)
KSmoothing = input(1, minval=1)
DLength = input(3, minval=1)
Level = input(50, minval=1)
//-------------------------
line2 = input(true, "---- Qstick Indicator ----")
LengthQ = input(14, minval=1)
reverse = input(false, title="Trade reverse")
posReversal123 = Reversal123(Length, KSmoothing, DLength, Level)
posQstick = Qstick(LengthQ)
pos = iff(posReversal123 == 1 and posQstick == 1 , 1,
iff(posReversal123 == -1 and posQstick == -1, -1, 0))
possig = iff(reverse and pos == 1, -1,
iff(reverse and pos == -1 , 1, pos))
if (possig == 1 )
strategy.entry("Long", strategy.long)
if (possig == -1 )
strategy.entry("Short", strategy.short)
if (possig == 0)
strategy.close_all()
barcolor(possig == -1 ? #b50404: possig == 1 ? #079605 : #0536b3 )