개요
이 전략은 시장 암호 지표의 파동 이론을 활용하여 여러 기술 지표와 결합하여 자동 매매를 구현한다. 그것은 트렌드가 시작될 때 기회를 식별하고 트렌드 추적을 구현한다.
전략 원칙
이 전략은 주로 시장 암호 물결 B 지표에 기초한다. 이 지표는 가격 행태를 1파와 2파 두 계층으로 나눈다. 1파 반응 민감, 2파 반응 부드럽다.
Wavetrend 함수를 통해 1파와 2파를 계산한다. Wave1과 Wave2를 Wave1과 Wave2를 Wave2로 연결하면, Wave2가 Wave1을 넘어서면, Wave2가 Wave2를 넘어서면, Wave2가 Wave2를 넘어서면, Wave2가 Wave2를 넘어서면, Wave2가 Wave2를 넘어서면, Wave2가 Wave2를 넘어서면, Wave2가 Wave2를 넘어서면, Wave2가 Wave2를 넘어서면, Wave2가 Wave2를 넘어서면, Wave2가 Wave2를 넘어서면, Wave2가 Wave2를 넘어서면, Wave2가 Wave2를 넘어서면, Wave2가 Wave2를 넘어서면, Wave2가 Wave2를 넘어서면, Wave2가 Wave2를 넘어서면, Wave2가 Wave2를 넘어서면, Wave2가 Wave2를 넘는다.
또한, 코드는 의사결정의 정확성을 높이기 위해 여러 보조 지표를 도입했습니다.
극심한 가치 지역: RSI와 자본 흐름 지표와 결합하여 가격 변동 지역을 판단한다.
KD: 공허함을 판단하는 것
탈선: 거래의 전환점을 찾아라
깃발 모양: 추세가 지속되는지를 판단하는 것
마지막으로, Wave와 보조 지표에 따라 최종 거래 결정을 결정합니다.
전략적 이점
이 전략의 가장 큰 장점은 다양한 시장 환경에 대응할 수 있다는 것입니다. 구체적으로, 다음과 같은 몇 가지 측면에서 나타납니다:
- 다양한 지표의 조합으로 높은 정확도로 판단할 수 있습니다.
전략은 Wave 자체의 교차를 판단 기준으로 사용하는 것뿐만 아니라 RSI, KD, deviation 등의 여러 지표를 도입하여 의사 결정의 정확성을 향상시킵니다.
- 트렌드를 파악하는 데 능숙합니다.
플래그 형식의 판단 모듈을 도입하여 트렌드의 지속성을 효과적으로 판단할 수 있으며, 트렌드가 시작될 때 기회를 식별할 수 있는 가벼운 무게를 피할 수 있습니다. 이것은 전략을 특히 트렌드 추적에 능숙하게 만듭니다.
- 수동 변수 최적화 공간
전략의 매개 변수는 사용자 정의가 높으며, 사용자는 시장에 대한 자신의 판단과 이해에 따라 다른 매개 변수를 선택하여 최적화하여 더 복잡한 시장 환경에 적응할 수 있습니다. 이것은 전략의 적용 범위를 넓혀줍니다.
전략적 위험
이 전략에는 다음과 같은 몇 가지 잠재적 위험도 있습니다.
- 갈등을 판단하는 다중 보조 지표
보조적인 지표가 많고, 어떤 극단적인 상황에서는 충돌을 판단하는 지표가 존재할 수 있다. 이것은 최종 결정에 불확실성을 가져온다.
- 매개 변수를 조정하는 데 어려움이 있습니다
조정 가능한 매개 변수가 많기 때문에 최적의 매개 변수 조합을 달성하기 위해서는 많은 양의 데이터 재검토와 테스트가 필요하며, 난이도가 높고, 과도한 최적화가 발생할 수 있다.
- 거래 빈도가 너무 높을 수 있습니다.
파동적 상황에서는 Wave 교차가 빈번하게 발생할 수 있으며, 이로 인해 거래가 너무 자주 이루어집니다. 이것은 추가적인 거래 비용을 초래합니다.
따라서, 다음과 같은 측면에서 최적화할 수 있습니다.
더 많은 필터링 조건을 도입하여 의사 결정의 안정성을 보장합니다.
전략에 큰 영향을 미치는 변수를 우선적으로 조정합니다.
이 경우, 주식시장에서는 주식 거래가 제한되어 있습니다.
요약하다
전반적으로, 이 전략은 시장 암호 파동 이론과 여러 가지 기술 지표를 통합하여 구매 판매 지점을 자동으로 식별하고 트렌드를 추적 할 수 있습니다. 이 전략은 변수가 조정 가능하며, 적응력이 풍부하며, 트렌드 기회를 잡는 데 능숙합니다. 또한 특정 잠재적인 위험에 주의를 기울여야하며, 판단 규칙의 업그레이드 및 변수 조정 등의 측면에서 지속적으로 최적화하여 전략을 더 안정적으로 만들 필요가 있습니다.
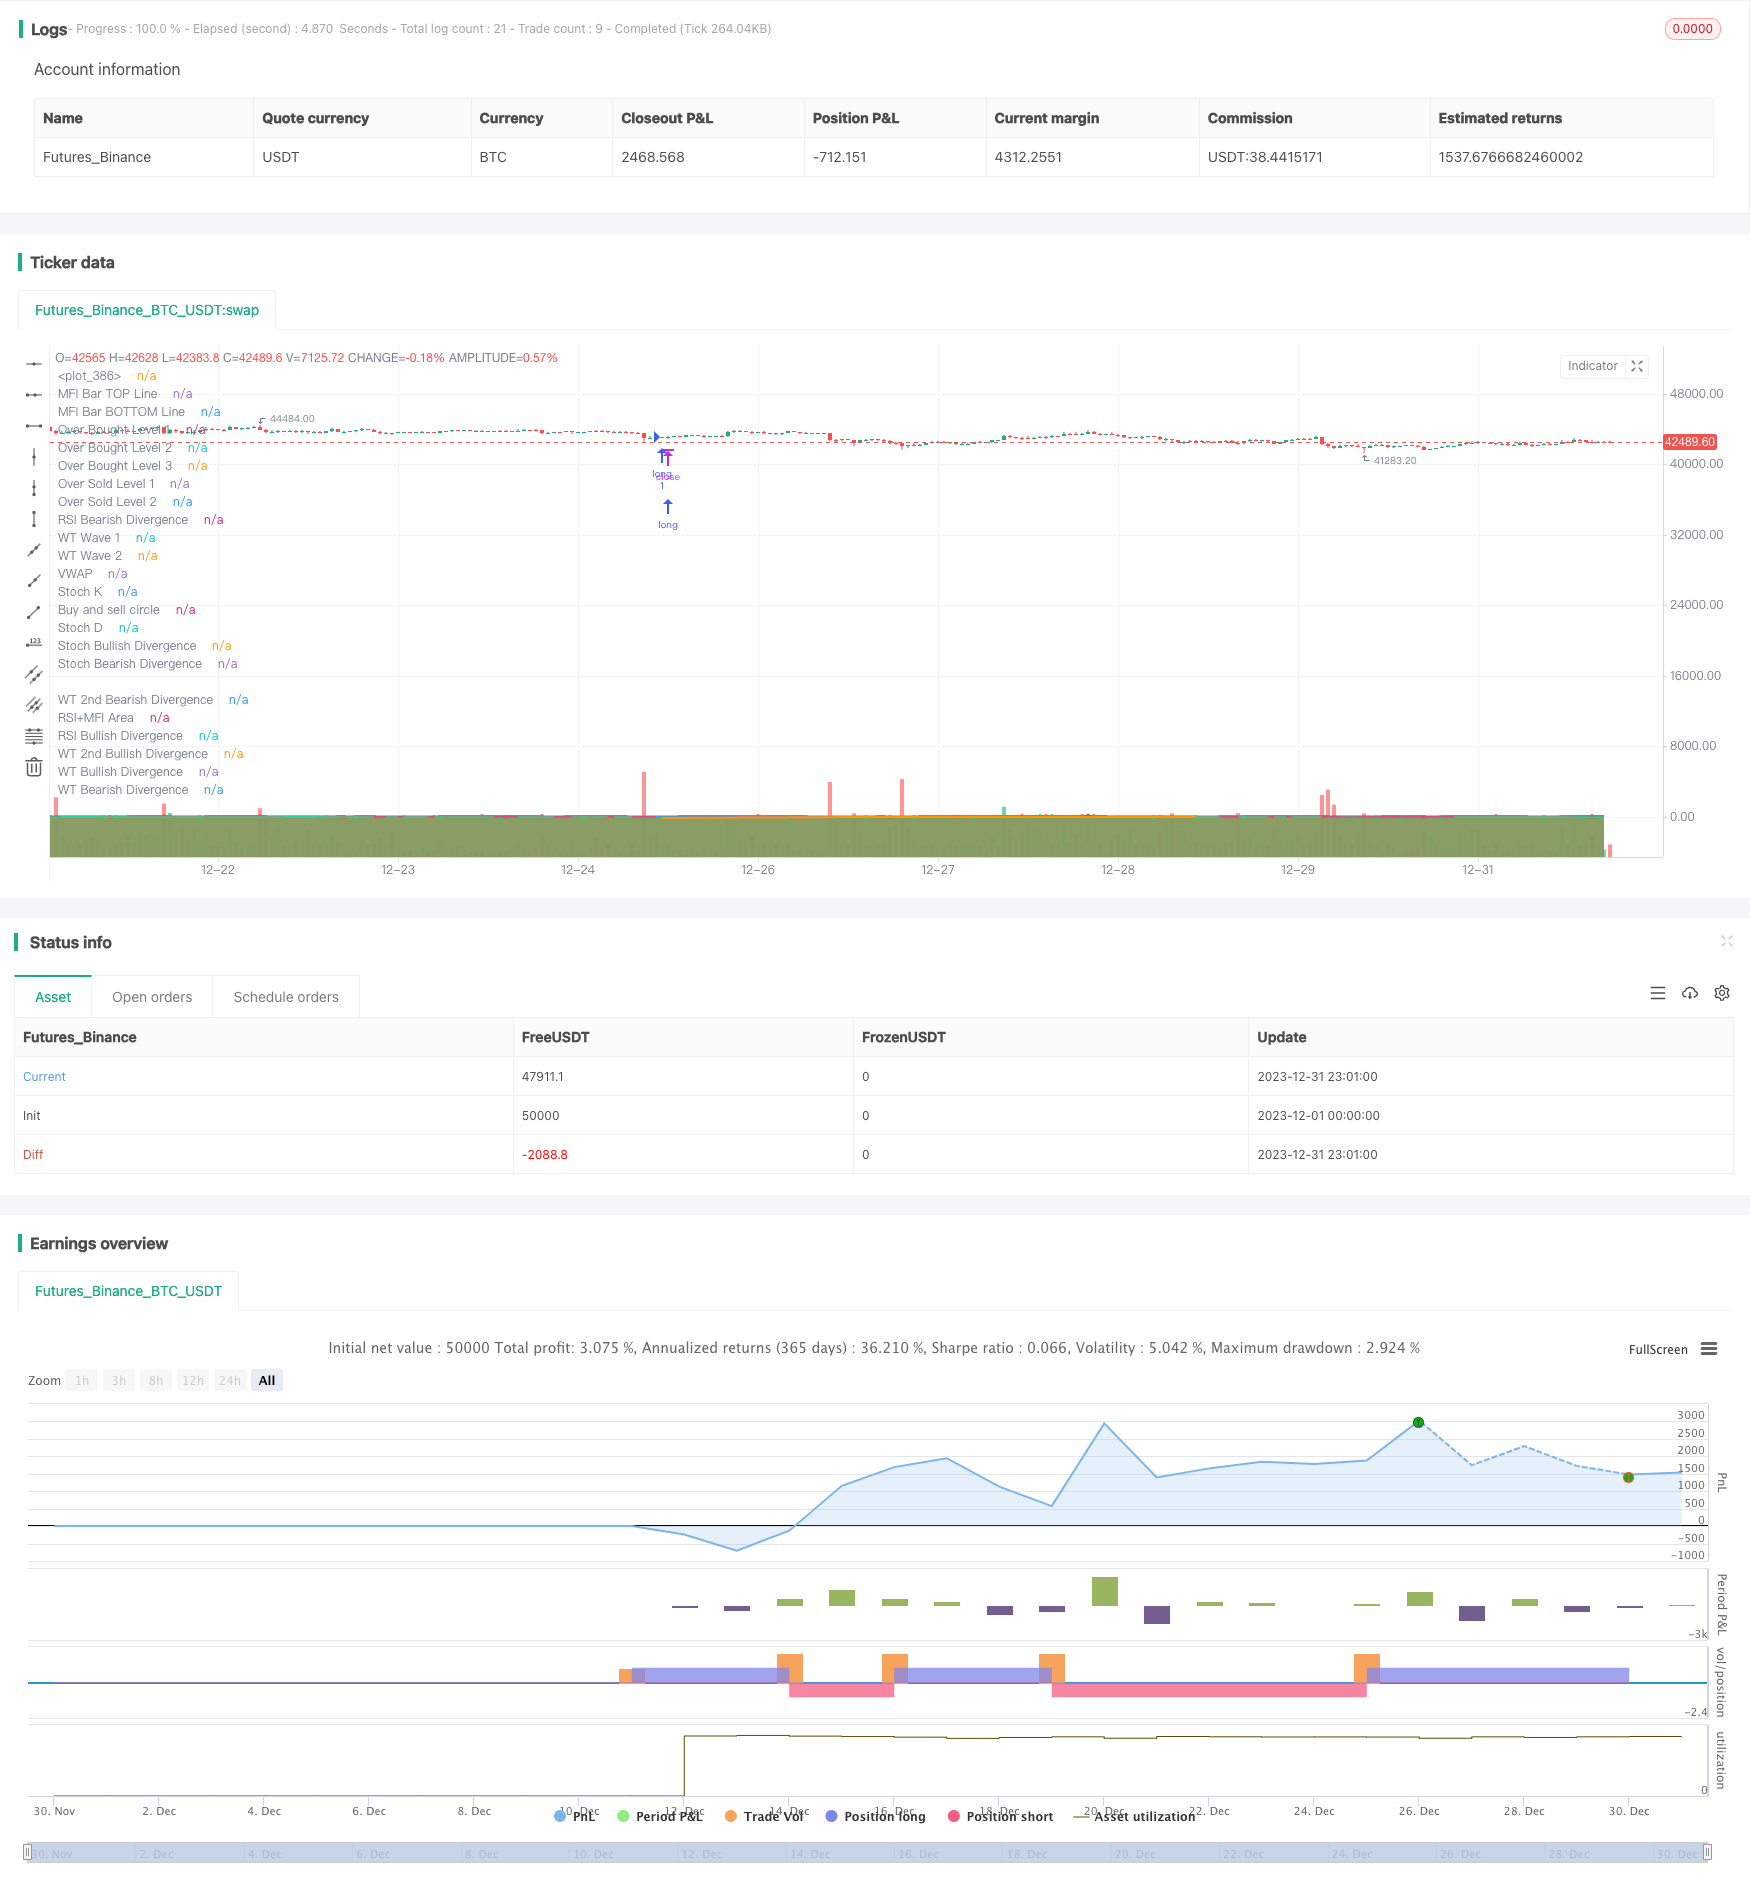
/*backtest
start: 2023-12-01 00:00:00
end: 2023-12-31 23:59:59
period: 1h
basePeriod: 15m
exchanges: [{"eid":"Futures_Binance","currency":"BTC_USDT"}]
*/

// This source code is subject to the terms of the Mozilla Public License 2.0 at https://mozilla.org/MPL/2.0/
// © vumanchu

//@version=5


//  Thanks to dynausmaux for the code
//  Thanks to falconCoin for https://www.tradingview.com/script/KVfgBvDd-Market-Cipher-B-Free-version-with-Buy-and-sell/ inspired me to start this.
//  Thanks to LazyBear for WaveTrend Oscillator https://www.tradingview.com/script/2KE8wTuF-Indicator-WaveTrend-Oscillator-WT/
//  Thanks to RicardoSantos for https://www.tradingview.com/script/3oeDh0Yq-RS-Price-Divergence-Detector-V2/
//  Thanks to LucemAnb for Plain Stochastic Divergence https://www.tradingview.com/script/FCUgF8ag-Plain-Stochastic-Divergence/
//  Thanks to andreholanda73 for MFI+RSI Area https://www.tradingview.com/script/UlGZzUAr/
//  I especially want to thank TradingView for its platform that facilitates development and learning.

//
//  CIRCLES & TRIANGLES:
//    - LITTLE CIRCLE: They appear at all WaveTrend wave crossings.
//    - GREEN CIRCLE: The wavetrend waves are at the oversold level and have crossed up (bullish).
//    - RED CIRCLE: The wavetrend waves are at the overbought level and have crossed down (bearish).
//    - GOLD/ORANGE CIRCLE: When RSI is below 20, WaveTrend waves are below or equal to -80 and have crossed up after good bullish divergence (DONT BUY WHEN GOLD CIRCLE APPEAR).
//    - None of these circles are certain signs to trade. It is only information that can help you.
//    - PURPLE TRIANGLE: Appear when a bullish or bearish divergence is formed and WaveTrend waves crosses at overbought and oversold points.
//
//  NOTES:
//    - I am not an expert trader or know how to program pine script as such, in fact it is my first indicator only to study and all the code is copied and modified from other codes that are published in TradingView.
//    - I am very grateful to the entire TV community that publishes codes so that other newbies like me can learn and present their results. This is an attempt to imitate Market Cipher B.
//    - Settings by default are for 4h timeframe, divergences are more stronger and accurate. Haven't tested in all timeframes, only 2h and 4h.
//    - If you get an interesting result in other timeframes I would be very grateful if you would comment your configuration to implement it or at least check it.
//
//  CONTRIBUTIONS:
//    - Tip/Idea: Add higher timeframe analysis for bearish/bullish patterns at the current timeframe.
//    + Bearish/Bullish FLAG:
//      - MFI+RSI Area are RED (Below 0).
//      - Wavetrend waves are above 0 and crosses down.
//      - VWAP Area are below 0 on higher timeframe.
//      - This pattern reversed becomes bullish.
//    - Tip/Idea: Check the last heikinashi candle from 2 higher timeframe
//    + Bearish/Bullish DIAMOND:
//      - HT Candle is red
//      - WT > 0 and crossed down

strategy(title='MCB CIRCLE ONLY PGB STRAT BUN TP SL TEST', shorttitle='MCB CIRCLE ONLY PGB STRAT BUN TP SL TEST', overlay=true )
    // strategy.cash
    //max_bars_back = 200)

// PARAMETERS {

// WaveTrend
wtShow = input(true, title='Show WaveTrend')
wtBuyShow = input(true, title='Show Buy dots')
wtGoldShow = input(true, title='Show Gold dots')
wtSellShow = input(true, title='Show Sell dots')
wtDivShow = input(true, title='Show Div. dots')
vwapShow = input(true, title='Show Fast WT')
wtChannelLen = input(9, title='WT Channel Length')
wtAverageLen = input(12, title='WT Average Length')
wtMASource = input(hlc3, title='WT MA Source')
wtMALen = input(3, title='WT MA Length')

// WaveTrend Overbought & Oversold lines
obLevel = input(70, title='WT Overbought Level 1')
obLevel2 = input(99, title='WT Overbought Level 2')
obLevel3 = input(99, title='WT Overbought Level 3')
osLevel = -obLevel
osLevel2 = input(-99, title='WT Oversold Level 2')
osLevel3 = input(-99, title='WT Oversold Level 3')

// Divergence WT
wtShowDiv = input(true, title='Show WT Regular Divergences')
wtShowHiddenDiv = input(false, title='Show WT Hidden Divergences')
showHiddenDiv_nl = input(true, title='Not apply OB/OS Limits on Hidden Divergences')
wtDivOBLevel = input(81, title='WT Bearish Divergence min')
// wtDivOSLevel = input(-91, title='WT Bullish Divergence min')
wtDivOSLevel = -wtDivOBLevel

// Divergence extra range
wtDivOBLevel_addshow = input(true, title='Show 2nd WT Regular Divergences')
wtDivOBLevel_add = input(63, title='WT 2nd Bearish Divergence')
// wtDivOSLevel_add = input(-40, title='WT 2nd Bullish Divergence 15 min')
wtDivOSLevel_add = -wtDivOBLevel_add

// RSI+MFI
rsiMFIShow = input(true, title='Show MFI')
rsiMFIperiod = input(60, title='MFI Period')
rsiMFIMultiplier = input.float(150, title='MFI Area multiplier')
rsiMFIPosY = input(2.5, title='MFI Area Y Pos')

// RSI
rsiShow = input(false, title='Show RSI')
rsiSRC = input(close, title='RSI Source')
rsiLen = input(14, title='RSI Length')
rsiOversold = input.int(30, title='RSI Oversold', minval=30, maxval=100)
rsiOverbought = input.int(60, title='RSI Overbought', minval=0, maxval=60)

// Divergence RSI
rsiShowDiv = input(false, title='Show RSI Regular Divergences')
rsiShowHiddenDiv = input(false, title='Show RSI Hidden Divergences')
rsiDivOBLevel = input(60, title='RSI Bearish Divergence min')
rsiDivOSLevel = input(30, title='RSI Bullish Divergence min')

// RSI Stochastic
stochShow = input(true, title='Show Stochastic RSI')
stochUseLog = input(true, title=' Use Log?')
stochAvg = input(false, title='Use Average of both K & D')
stochSRC = input(close, title='Stochastic RSI Source')
stochLen = input(14, title='Stochastic RSI Length')
stochRsiLen = input(14, title='RSI Length ')
stochKSmooth = input(3, title='Stochastic RSI K Smooth')
stochDSmooth = input(3, title='Stochastic RSI D Smooth')

// Divergence stoch
stochShowDiv = input(false, title='Show Stoch Regular Divergences')
stochShowHiddenDiv = input(false, title='Show Stoch Hidden Divergences')

// Schaff Trend Cycle
tcLine = input(false, title='Show Schaff TC line')
tcSRC = input(close, title='Schaff TC Source')
tclength = input(10, title='Schaff TC')
tcfastLength = input(23, title='Schaff TC Fast Lenght')
tcslowLength = input(50, title='Schaff TC Slow Length')
tcfactor = input(0.5, title='Schaff TC Factor')

// Sommi Flag
sommiFlagShow = input(false, title='Show Sommi flag')
sommiShowVwap = input(false, title='Show Sommi F. Wave')
sommiVwapTF = input('720', title='Sommi F. Wave timeframe')
sommiVwapBearLevel = input(0, title='F. Wave Bear Level (less than)')
sommiVwapBullLevel = input(0, title='F. Wave Bull Level (more than)')
soomiFlagWTBearLevel = input(0, title='WT Bear Level (more than)')
soomiFlagWTBullLevel = input(0, title='WT Bull Level (less than)')
soomiRSIMFIBearLevel = input(0, title='Money flow Bear Level (less than)')
soomiRSIMFIBullLevel = input(0, title='Money flow Bull Level (more than)')

// Sommi Diamond
sommiDiamondShow = input(false, title='Show Sommi diamond')
sommiHTCRes = input('60', title='HTF Candle Res. 1')
sommiHTCRes2 = input('240', title='HTF Candle Res. 2')
soomiDiamondWTBearLevel = input(0, title='WT Bear Level (More than)')
soomiDiamondWTBullLevel = input(0, title='WT Bull Level (Less than)')

// macd Colors
macdWTColorsShow = input(false, title='Show MACD Colors')
macdWTColorsTF = input('240', title='MACD Colors MACD TF')

darkMode = input(false, title='Dark mode')


// Colors
colorRed = #ff0000
colorPurple = #e600e6
colorGreen = #3fff00
colorOrange = #e2a400
colorYellow = #ffe500
colorWhite = #ffffff
colorPink = #ff00f0
colorBluelight = #31c0ff

colorWT1 = #90caf9
colorWT2 = #0d47a1

colorWT2_ = #131722

colormacdWT1a = #4caf58
colormacdWT1b = #af4c4c
colormacdWT1c = #7ee57e
colormacdWT1d = #ff3535

colormacdWT2a = #305630
colormacdWT2b = #310101
colormacdWT2c = #132213
colormacdWT2d = #770000

// } PARAMETERS


// FUNCTIONS {

// Divergences
f_top_fractal(src) =>
    src[4] < src[2] and src[3] < src[2] and src[2] > src[1] and src[2] > src[0]
f_bot_fractal(src) =>
    src[4] > src[2] and src[3] > src[2] and src[2] < src[1] and src[2] < src[0]
f_fractalize(src) =>
    f_top_fractal(src) ? 1 : f_bot_fractal(src) ? -1 : 0

f_findDivs(src, topLimit, botLimit, useLimits) =>
    fractalTop = f_fractalize(src) > 0 and (useLimits ? src[2] >= topLimit : true) ? src[2] : na
    fractalBot = f_fractalize(src) < 0 and (useLimits ? src[2] <= botLimit : true) ? src[2] : na
    highPrev = ta.valuewhen(fractalTop, src[2], 0)[2]
    highPrice = ta.valuewhen(fractalTop, high[2], 0)[2]
    lowPrev = ta.valuewhen(fractalBot, src[2], 0)[2]
    lowPrice = ta.valuewhen(fractalBot, low[2], 0)[2]
    bearSignal = fractalTop and high[2] > highPrice and src[2] < highPrev
    bullSignal = fractalBot and low[2] < lowPrice and src[2] > lowPrev
    bearDivHidden = fractalTop and high[2] < highPrice and src[2] > highPrev
    bullDivHidden = fractalBot and low[2] > lowPrice and src[2] < lowPrev
    [fractalTop, fractalBot, lowPrev, bearSignal, bullSignal, bearDivHidden, bullDivHidden]

// RSI+MFI
f_rsimfi(_period, _multiplier, _tf) =>
    request.security(syminfo.tickerid, _tf, ta.sma((close - open) / (high - low) * _multiplier, _period) - rsiMFIPosY)

// WaveTrend
f_wavetrend(src, chlen, avg, malen, tf) =>
    tfsrc = request.security(syminfo.tickerid, tf, src)
    esa = ta.ema(tfsrc, chlen)
    de = ta.ema(math.abs(tfsrc - esa), chlen)
    ci = (tfsrc - esa) / (0.015 * de)
    wt1 = request.security(syminfo.tickerid, tf, ta.ema(ci, avg))
    wt2 = request.security(syminfo.tickerid, tf, ta.sma(wt1, malen))
    wtVwap = wt1 - wt2
    wtOversold = wt2 <= osLevel
    wtOverbought = wt2 >= obLevel
    wtCross = ta.cross(wt1, wt2)
    wtCrossUp = wt2 - wt1 <= 0
    wtCrossDown = wt2 - wt1 >= 0
    wtCrosslast = ta.cross(wt1[2], wt2[2])
    wtCrossUplast = wt2[2] - wt1[2] <= 0
    wtCrossDownlast = wt2[2] - wt1[2] >= 0
    [wt1, wt2, wtOversold, wtOverbought, wtCross, wtCrossUp, wtCrossDown, wtCrosslast, wtCrossUplast, wtCrossDownlast, wtVwap]

// Schaff Trend Cycle
f_tc(src, length, fastLength, slowLength) =>
    ema1 = ta.ema(src, fastLength)
    ema2 = ta.ema(src, slowLength)
    macdVal = ema1 - ema2
    alpha = ta.lowest(macdVal, length)
    beta = ta.highest(macdVal, length) - alpha
    gamma = (macdVal - alpha) / beta * 100
    gamma := beta > 0 ? gamma : nz(gamma[1])
    delta = gamma
    delta := na(delta[1]) ? delta : delta[1] + tcfactor * (gamma - delta[1])
    epsilon = ta.lowest(delta, length)
    zeta = ta.highest(delta, length) - epsilon
    eta = (delta - epsilon) / zeta * 100
    eta := zeta > 0 ? eta : nz(eta[1])
    stcReturn = eta
    stcReturn := na(stcReturn[1]) ? stcReturn : stcReturn[1] + tcfactor * (eta - stcReturn[1])
    stcReturn

// Stochastic RSI
f_stochrsi(_src, _stochlen, _rsilen, _smoothk, _smoothd, _log, _avg) =>
    src = _log ? math.log(_src) : _src
    rsi = ta.rsi(src, _rsilen)
    kk = ta.sma(ta.stoch(rsi, rsi, rsi, _stochlen), _smoothk)
    d1 = ta.sma(kk, _smoothd)
    avg_1 = math.avg(kk, d1)
    k = _avg ? avg_1 : kk
    [k, d1]

// MACD
f_macd(src, fastlen, slowlen, sigsmooth, tf) =>
    fast_ma = request.security(syminfo.tickerid, tf, ta.ema(src, fastlen))
    slow_ma = request.security(syminfo.tickerid, tf, ta.ema(src, slowlen))
    macd = fast_ma - slow_ma
    signal = request.security(syminfo.tickerid, tf, ta.sma(macd, sigsmooth))
    hist = macd - signal
    [macd, signal, hist]

// MACD Colors on WT
f_macdWTColors(tf) =>
    hrsimfi = f_rsimfi(rsiMFIperiod, rsiMFIMultiplier, tf)
    [macd, signal, hist] = f_macd(close, 28, 42, 9, macdWTColorsTF)
    macdup = macd >= signal
    macddown = macd <= signal
    macdWT1Color = macdup ? hrsimfi > 0 ? colormacdWT1c : colormacdWT1a : macddown ? hrsimfi < 0 ? colormacdWT1d : colormacdWT1b : na
    macdWT2Color = macdup ? hrsimfi < 0 ? colormacdWT2c : colormacdWT2a : macddown ? hrsimfi < 0 ? colormacdWT2d : colormacdWT2b : na
    [macdWT1Color, macdWT2Color]

// Get higher timeframe candle
f_getTFCandle(_tf) =>
    _open = request.security(ticker.heikinashi(syminfo.tickerid), _tf, open, barmerge.gaps_off, barmerge.lookahead_on)
    _close = request.security(ticker.heikinashi(syminfo.tickerid), _tf, close, barmerge.gaps_off, barmerge.lookahead_on)
    _high = request.security(ticker.heikinashi(syminfo.tickerid), _tf, high, barmerge.gaps_off, barmerge.lookahead_on)
    _low = request.security(ticker.heikinashi(syminfo.tickerid), _tf, low, barmerge.gaps_off, barmerge.lookahead_on)
    hl2 = (_high + _low) / 2.0
    newBar = ta.change(_open)
    candleBodyDir = _close > _open
    [candleBodyDir, newBar]

// Sommi flag
f_findSommiFlag(tf, wt1, wt2, rsimfi, wtCross, wtCrossUp, wtCrossDown) =>
    [hwt1, hwt2, hwtOversold, hwtOverbought, hwtCross, hwtCrossUp, hwtCrossDown, hwtCrosslast, hwtCrossUplast, hwtCrossDownlast, hwtVwap] = f_wavetrend(wtMASource, wtChannelLen, wtAverageLen, wtMALen, tf)

    bearPattern = rsimfi < soomiRSIMFIBearLevel and wt2 > soomiFlagWTBearLevel and wtCross and wtCrossDown and hwtVwap < sommiVwapBearLevel

    bullPattern = rsimfi > soomiRSIMFIBullLevel and wt2 < soomiFlagWTBullLevel and wtCross and wtCrossUp and hwtVwap > sommiVwapBullLevel

    [bearPattern, bullPattern, hwtVwap]

f_findSommiDiamond(tf, tf2, wt1, wt2, wtCross, wtCrossUp, wtCrossDown) =>
    [candleBodyDir, newBar] = f_getTFCandle(tf)
    [candleBodyDir2, newBar2] = f_getTFCandle(tf2)
    bearPattern = wt2 >= soomiDiamondWTBearLevel and wtCross and wtCrossDown and not candleBodyDir and not candleBodyDir2
    bullPattern = wt2 <= soomiDiamondWTBullLevel and wtCross and wtCrossUp and candleBodyDir and candleBodyDir2
    [bearPattern, bullPattern]

// } FUNCTIONS

// CALCULATE INDICATORS {

// RSI
rsi = ta.rsi(rsiSRC, rsiLen)
rsiColor = rsi <= rsiOversold ? colorGreen : rsi >= rsiOverbought ? colorRed : colorPurple

// RSI + MFI Area
rsiMFI = f_rsimfi(rsiMFIperiod, rsiMFIMultiplier, timeframe.period)
rsiMFIColor = rsiMFI > 0 ? #3ee145 : #ff3d2e

// Calculates WaveTrend
[wt1, wt2, wtOversold, wtOverbought, wtCross, wtCrossUp, wtCrossDown, wtCross_last, wtCrossUp_last, wtCrossDown_last, wtVwap] = f_wavetrend(wtMASource, wtChannelLen, wtAverageLen, wtMALen, timeframe.period)

// Stochastic RSI
[stochK, stochD] = f_stochrsi(stochSRC, stochLen, stochRsiLen, stochKSmooth, stochDSmooth, stochUseLog, stochAvg)

// Schaff Trend Cycle
tcVal = f_tc(tcSRC, tclength, tcfastLength, tcslowLength)

// Sommi flag
[sommiBearish, sommiBullish, hvwap] = f_findSommiFlag(sommiVwapTF, wt1, wt2, rsiMFI, wtCross, wtCrossUp, wtCrossDown)

//Sommi diamond
[sommiBearishDiamond, sommiBullishDiamond] = f_findSommiDiamond(sommiHTCRes, sommiHTCRes2, wt1, wt2, wtCross, wtCrossUp, wtCrossDown)

// macd colors
[macdWT1Color, macdWT2Color] = f_macdWTColors(macdWTColorsTF)

// WT Divergences
[wtFractalTop, wtFractalBot, wtLow_prev, wtBearDiv, wtBullDiv, wtBearDivHidden, wtBullDivHidden] = f_findDivs(wt2, wtDivOBLevel, wtDivOSLevel, true)

[wtFractalTop_add, wtFractalBot_add, wtLow_prev_add, wtBearDiv_add, wtBullDiv_add, wtBearDivHidden_add, wtBullDivHidden_add] = f_findDivs(wt2, wtDivOBLevel_add, wtDivOSLevel_add, true)
[wtFractalTop_nl, wtFractalBot_nl, wtLow_prev_nl, wtBearDiv_nl, wtBullDiv_nl, wtBearDivHidden_nl, wtBullDivHidden_nl] = f_findDivs(wt2, 0, 0, false)

wtBearDivHidden_ = showHiddenDiv_nl ? wtBearDivHidden_nl : wtBearDivHidden
wtBullDivHidden_ = showHiddenDiv_nl ? wtBullDivHidden_nl : wtBullDivHidden

wtBearDivColor = wtShowDiv and wtBearDiv or wtShowHiddenDiv and wtBearDivHidden_ ? colorRed : na
wtBullDivColor = wtShowDiv and wtBullDiv or wtShowHiddenDiv and wtBullDivHidden_ ? colorGreen : na

wtBearDivColor_add = wtShowDiv and wtDivOBLevel_addshow and wtBearDiv_add or wtShowHiddenDiv and wtDivOBLevel_addshow and wtBearDivHidden_add ? #9a0202 : na
wtBullDivColor_add = wtShowDiv and wtDivOBLevel_addshow and wtBullDiv_add or wtShowHiddenDiv and wtDivOBLevel_addshow and wtBullDivHidden_add ? #1b5e20 : na

// RSI Divergences
[rsiFractalTop, rsiFractalBot, rsiLow_prev, rsiBearDiv, rsiBullDiv, rsiBearDivHidden, rsiBullDivHidden] = f_findDivs(rsi, rsiDivOBLevel, rsiDivOSLevel, true)
[rsiFractalTop_nl, rsiFractalBot_nl, rsiLow_prev_nl, rsiBearDiv_nl, rsiBullDiv_nl, rsiBearDivHidden_nl, rsiBullDivHidden_nl] = f_findDivs(rsi, 0, 0, false)

rsiBearDivHidden_ = showHiddenDiv_nl ? rsiBearDivHidden_nl : rsiBearDivHidden
rsiBullDivHidden_ = showHiddenDiv_nl ? rsiBullDivHidden_nl : rsiBullDivHidden

rsiBearDivColor = rsiShowDiv and rsiBearDiv or rsiShowHiddenDiv and rsiBearDivHidden_ ? colorRed : na
rsiBullDivColor = rsiShowDiv and rsiBullDiv or rsiShowHiddenDiv and rsiBullDivHidden_ ? colorGreen : na

// Stoch Divergences
[stochFractalTop, stochFractalBot, stochLow_prev, stochBearDiv, stochBullDiv, stochBearDivHidden, stochBullDivHidden] = f_findDivs(stochK, 0, 0, false)

stochBearDivColor = stochShowDiv and stochBearDiv or stochShowHiddenDiv and stochBearDivHidden ? colorRed : na
stochBullDivColor = stochShowDiv and stochBullDiv or stochShowHiddenDiv and stochBullDivHidden ? colorGreen : na


// Small Circles WT Cross
signalColor = wt2 - wt1 > 0 ? color.red : color.lime

// Buy signal.
buySignal = wtCross and wtCrossUp and wtOversold

buySignalDiv = wtShowDiv and wtBullDiv or wtShowDiv and wtBullDiv_add or stochShowDiv and stochBullDiv or rsiShowDiv and rsiBullDiv

buySignalDiv_color = wtBullDiv ? colorGreen : wtBullDiv_add ? color.new(colorGreen, 100) : rsiShowDiv ? colorGreen : na

// Sell signal
sellSignal = wtCross and wtCrossDown and wtOverbought

sellSignalDiv = wtShowDiv and wtBearDiv or wtShowDiv and wtBearDiv_add or stochShowDiv and stochBearDiv or rsiShowDiv and rsiBearDiv

sellSignalDiv_color = wtBearDiv ? colorRed : wtBearDiv_add ? color.new(colorRed, 60) : rsiBearDiv ? colorRed : na

// Gold Buy
lastRsi = ta.valuewhen(wtFractalBot, rsi[2], 0)[2]
wtGoldBuy = (wtShowDiv and wtBullDiv or rsiShowDiv and rsiBullDiv) and wtLow_prev <= osLevel3 and wt2 > osLevel3 and wtLow_prev - wt2 <= -5 and lastRsi < 30

// } CALCULATE INDICATORS


// DRAW {
bgcolor(darkMode ? color.new(#000000, 80) : na, transp=90)
zLine = plot(0, color=color.new(colorWhite, 50))

//  MFI BAR
rsiMfiBarTopLine = plot(rsiMFIShow ? -95 : na, title='MFI Bar TOP Line', transp=100)
rsiMfiBarBottomLine = plot(rsiMFIShow ? -99 : na, title='MFI Bar BOTTOM Line', transp=50)
fill(rsiMfiBarTopLine, rsiMfiBarBottomLine, title='MFI Bar Colors', color=rsiMFIColor, transp=75)

// WT Areas
plot(wtShow ? wt1 : na, style=plot.style_area, title='WT Wave 1', color=macdWTColorsShow ? macdWT1Color : colorWT1, transp=0)
plot(wtShow ? wt2 : na, style=plot.style_area, title='WT Wave 2', color=macdWTColorsShow ? macdWT2Color : darkMode ? colorWT2_ : colorWT2, transp=20)

// VWAP
plot(vwapShow ? wtVwap : na, title='VWAP', color=color.new(colorYellow, 45), style=plot.style_area, linewidth=2)

// MFI AREA
rsiMFIplot = plot(rsiMFIShow ? rsiMFI : na, title='RSI+MFI Area', color=rsiMFIColor, transp=20)
fill(rsiMFIplot, zLine, rsiMFIColor, transp=40)

// WT Div

plot(series=wtFractalTop ? wt2[2] : na, title='WT Bearish Divergence', color=wtBearDivColor, linewidth=2, offset=-2)
plot(series=wtFractalBot ? wt2[2] : na, title='WT Bullish Divergence', color=wtBullDivColor, linewidth=2, offset=-2)

// WT 2nd Div
plot(series=wtFractalTop_add ? wt2[2] : na, title='WT 2nd Bearish Divergence', color=wtBearDivColor_add, linewidth=2, offset=-2)
plot(series=wtFractalBot_add ? wt2[2] : na, title='WT 2nd Bullish Divergence', color=wtBullDivColor_add, linewidth=2, offset=-2)

// RSI
plot(rsiShow ? rsi : na, title='RSI', color=rsiColor, linewidth=2, transp=25)

// RSI Div
plot(series=rsiFractalTop ? rsi[2] : na, title='RSI Bearish Divergence', color=rsiBearDivColor, linewidth=1, offset=-2)
plot(series=rsiFractalBot ? rsi[2] : na, title='RSI Bullish Divergence', color=rsiBullDivColor, linewidth=1, offset=-2)

// Stochastic RSI
stochKplot = plot(stochShow ? stochK : na, title='Stoch K', color=color.new(#21baf3, 0), linewidth=2)
stochDplot = plot(stochShow ? stochD : na, title='Stoch D', color=color.new(#673ab7, 60), linewidth=1)
stochFillColor = stochK >= stochD ? color.new(#21baf3, 75) : color.new(#673ab7, 60)
fill(stochKplot, stochDplot, title='KD Fill', color=stochFillColor, transp=90)

// Stoch Div
plot(series=stochFractalTop ? stochK[2] : na, title='Stoch Bearish Divergence', color=stochBearDivColor, linewidth=1, offset=-2)
plot(series=stochFractalBot ? stochK[2] : na, title='Stoch Bullish Divergence', color=stochBullDivColor, linewidth=1, offset=-2)

// Schaff Trend Cycle
plot(tcLine ? tcVal : na, color=color.new(#673ab7, 25), linewidth=2, title='Schaff Trend Cycle 1')
plot(tcLine ? tcVal : na, color=color.new(colorWhite, 50), linewidth=1, title='Schaff Trend Cycle 2')


// Draw Overbought & Oversold lines
plot(obLevel, title='Over Bought Level 1', color=color.new(colorWhite, 11), linewidth=1, style=plot.style_line)
plot(obLevel2, title='Over Bought Level 2', color=color.new(colorWhite, 85), linewidth=1, style=plot.style_stepline)
plot(obLevel3, title='Over Bought Level 3', color=color.new(colorWhite, 95), linewidth=1, style=plot.style_circles)

plot(osLevel, title='Over Sold Level 1', color=color.new(colorWhite, 11), linewidth=1, style=plot.style_line)
plot(osLevel2, title='Over Sold Level 2', color=color.new(colorWhite, 85), linewidth=1, style=plot.style_stepline)

// Sommi flag
plotchar(sommiFlagShow and sommiBearish ? 108 : na, title='Sommi bearish flag', char='⚑', color=color.new(colorPink, 0), location=location.absolute, size=size.tiny)
plotchar(sommiFlagShow and sommiBullish ? -108 : na, title='Sommi bullish flag', char='⚑', color=color.new(colorBluelight, 0), location=location.absolute, size=size.tiny)
plot(sommiShowVwap ? ta.ema(hvwap, 3) : na, title='Sommi higher VWAP', color=color.new(colorYellow, 15), linewidth=2, style=plot.style_line)

// Sommi diamond
plotchar(sommiDiamondShow and sommiBearishDiamond ? 108 : na, title='Sommi bearish diamond', char='◆', color=color.new(colorPink, 0), location=location.absolute, size=size.tiny)
plotchar(sommiDiamondShow and sommiBullishDiamond ? -108 : na, title='Sommi bullish diamond', char='◆', color=color.new(colorBluelight, 0), location=location.absolute, size=size.tiny)

// Circles
plot(wtCross ? wt2 : na, title='Buy and sell circle', color=signalColor, style=plot.style_circles, linewidth=3, transp=15)

plotchar(wtBuyShow and buySignal ? -107 : na, title='Buy circle', char='·', color=color.new(colorGreen, 10), location=location.absolute, size=size.small)
plotchar(wtSellShow and sellSignal ? 105 : na, title='Sell circle', char='·', color=color.new(colorRed, 10), location=location.absolute, size=size.small)

plotchar(wtDivShow and buySignalDiv ? -106 : na, title='Divergence buy circle', char='•', color=buySignalDiv_color, location=location.absolute, size=size.small, offset=-2, transp=70)
plotchar(wtDivShow and sellSignalDiv ? 106 : na, title='Divergence sell circle', char='•', color=sellSignalDiv_color, location=location.absolute, size=size.small, offset=-2, transp=70)

plotchar(wtGoldBuy and wtGoldShow ? -106 : na, title='Gold  buy gold circle', char='•', color=color.new(colorOrange, 60), location=location.absolute, size=size.small, offset=-2)

// } DRAW


long = ta.crossover (wt1, wt2) and wt1<osLevel
// long = wtBullDiv or ta.crossover (wt1, wt2) and wt1<osLevel
// long = wtBullDiv
// short= wtBearDiv
// short= wtBearDiv or ta.crossunder(wt1, wt2) and wt1>obLevel
short= ta.crossunder(wt1, wt2) and wt1>obLevel

// Position Management Tools
pos = 0.0
pos:= long? 1 : short? -1 : pos[1]

longCond  = long  and (pos[1]!= 1 or na(pos[1]))
shortCond = short and (pos[1]!=-1 or na(pos[1]))

// EXIT FUNCTIONS //
i_sl  = input.float(0.0, title="Stop Loss %     ", minval=0, step=1, inline='sl ')
i_tp  = input.float(0.0, title="Take Profit %   ", minval=0, step=1, inline='tp ')
i_tsl = input.float(0.0, title="Trailing Stop Loss %", minval=0, step=1, inline='tsl')

sl  = i_sl >0? i_sl /100 : 99999
tp  = i_tp >0? i_tp /100 : 99999
tsl = i_tsl>0? i_tsl/100 : 99999

long_entry  = ta.valuewhen(longCond , close, 0)
short_entry = ta.valuewhen(shortCond, close, 0)

// Trailing Stop Loss
trail_long = 0.0, trail_short = 0.0
trail_long  := longCond? high : high>trail_long[1]? high : pos<1 ? 0  : trail_long[1]
trail_short := shortCond? low : low<trail_short[1]? low : pos>-1 ? 99999  : trail_short[1]
trail_long_final   = trail_long  * (1-tsl)
trail_short_final  = trail_short * (1+tsl)

// Simple Stop Loss and Take Profit
sl_long0   = long_entry * (1 - sl)
sl_short0  = short_entry * (1 + sl)

tp_long  = long_entry * (1 + tp)
tp_short = short_entry * (1 - tp)

sl_long  = math.max(sl_long0, trail_long_final)
sl_short = math.min(sl_short0, trail_short_final)

// Position Adjustment
long_sl  = low <sl_long[1]  and pos[1]==1
short_sl = high>sl_short[1] and pos[1]==-1

final_long_tp  = high>tp_long[1]  and pos[1]==1
final_short_tp = low <tp_short[1] and pos[1]==-1

if ((long_sl or final_long_tp) and not shortCond) or ((short_sl or final_short_tp) and not longCond)
    pos:=0

//  Strategy Backtest Limiting Algorithm
i_startTime = input(defval = timestamp("01 Sep 2002 13:30 +0000"), title = "Backtesting Start Time")
i_endTime   = input(defval = timestamp("30 Sep 2099 19:30 +0000"), title = "Backtesting End Time"  )
timeCond   = true
strategy.initial_capital = 50000
equity = strategy.initial_capital + strategy.netprofit

if equity>0 and timeCond
    if longCond
        strategy.entry("long" , strategy.long )
    if shortCond
        strategy.entry("short", strategy.short)

    strategy.exit("SL/TP", from_entry = "long" , stop=sl_long , limit=tp_long , comment_profit ='TP', comment_loss='SL')
    strategy.exit("SL/TP", from_entry = "short", stop=sl_short, limit=tp_short, comment_profit ='TP', comment_loss='SL')

// ALERTS {

// BUY
alertcondition(longCond, 'Buy (Big green circle)', 'Green circle WaveTrend Oversold')
alertcondition(buySignalDiv, 'Buy (Big green circle + Div)', 'Buy & WT Bullish Divergence & WT Overbought')
alertcondition(wtGoldBuy, 'GOLD Buy (Big GOLDEN circle)', 'Green & GOLD circle WaveTrend Overbought')
alertcondition(sommiBullish or sommiBullishDiamond, 'Sommi bullish flag/diamond', 'Blue flag/diamond')
alertcondition(wtCross and wtCrossUp, 'Buy (Small green dot)', 'Buy small circle')

// SELL
alertcondition(sommiBearish or sommiBearishDiamond, 'Sommi bearish flag/diamond', 'Purple flag/diamond')
alertcondition(sellSignal, 'Sell (Big red circle)', 'Red Circle WaveTrend Overbought')
alertcondition(sellSignalDiv, 'Sell (Big red circle + Div)', 'Buy & WT Bearish Divergence & WT Overbought')
alertcondition(wtCross and wtCrossDown, 'Sell (Small red dot)', 'Sell small circle')

// } ALERTS