개요
이동 평균 교차 전략은 이동 평균을 기반으로 한 정량 거래 전략이다. 이 전략은 일정 기간 동안의 증권 평균 가격을 계산하여 가격의 이동 평균의 교차를 이용하여 거래 신호를 생성하여 수익을 창출한다.
전략 원칙
이 전략은 주로 빠른 이동 평균과 느린 이동 평균의 교차를 사용하여 가격 추세를 판단하고 거래 신호를 생성한다. 구체적으로, 10 일선과 20 일선과 같은 두 개의 다른 주기 길이의 이동 평균을 사용한다.
빠른 이동 평균이 아래 방향에서 느린 이동 평균을 돌파 할 때, 시장이 하향에서 상승으로 전환되어 구매 신호를 생성한다고 생각합니다. 빠른 이동 평균이 위 방향에서 하향으로 느린 이동 평균을 돌파 할 때, 시장이 하향에서 하향으로 전환되어 판매 신호를 생성한다고 생각합니다.
이 전략은 가격 트렌드의 전환점을 포착하여, 상황이 좋아지면 구매하고, 상황이 나쁘면 판매하여 수익을 창출할 수 있다.
우위 분석
이 전략은 다음과 같은 장점을 가지고 있습니다.
- 개념이 간단하고, 이해하기 쉽고, 구현하기 쉽습니다.
- 이동 평균의 주기를 조정할 수 있는 사용자 정의 가능한 파라미터
- 트렌디스틱한 상황에 특히 적합합니다.
- 스톱 스톱 로직에 통합하여 위험을 제어할 수 있습니다.
위험 분석
이 전략에는 다음과 같은 위험도 있습니다.
- 상환시장에서 잘못된 신호와 과도한 거래가 발생할 수 있습니다.
- 디버그해야 하는 파라미터, 다양한 파라미터 조합으로 리메이크 효과는 크게 달라진다.
- 거래 비용과 슬라이드 포인트를 고려하지 않고, 실디 효과는 재측정보다 약할 수 있습니다.
- 가격의 급격한 전환을 놓칠 수 있는 시간적 차이는 존재합니다.
적절한 최적화를 통해 이러한 위험을 줄일 수 있습니다.
최적화 방향
이 전략은 다음과 같은 방향으로 최적화될 수 있습니다.
- 다른 지표의 필터 신호와 결합하여, 예를 들어 양력 지표, 진동 지표 등으로, 조립에서 잘못된 거래를 피합니다.
- 적응형 이동 평균을 추가하여 주기 변수의 동적인 변화를 더 잘 추적할 수 있습니다.
- 이동 평균의 주기 변수를 최적화하여 최적의 변수 조합을 찾습니다.
- 재입장 조건을 설정하여 거래의 빈번함을 방지합니다.
- 실제 거래 비용과 슬라이드 포인트를 고려하여 스톱 스톱 손실을 조정합니다.
이러한 최적화를 통해 전략의 실전 효과를 크게 향상시킬 수 있습니다.
요약하다
이동 평균 크로스 전략은 전반적으로 이해하기 쉽고 실행할 수 있는 양적 거래 전략이다. 가격 평균의 크로스 원칙을 사용하여 간단하고 직관적으로 시장 움직임을 판단하고 거래 신호를 생성한다. 파라미터를 조정하고 다른 기술 지표와 결합하여 전략의 실전 효과를 강화하여 신뢰할 수있는 양적 수익 도구가 될 수 있다.
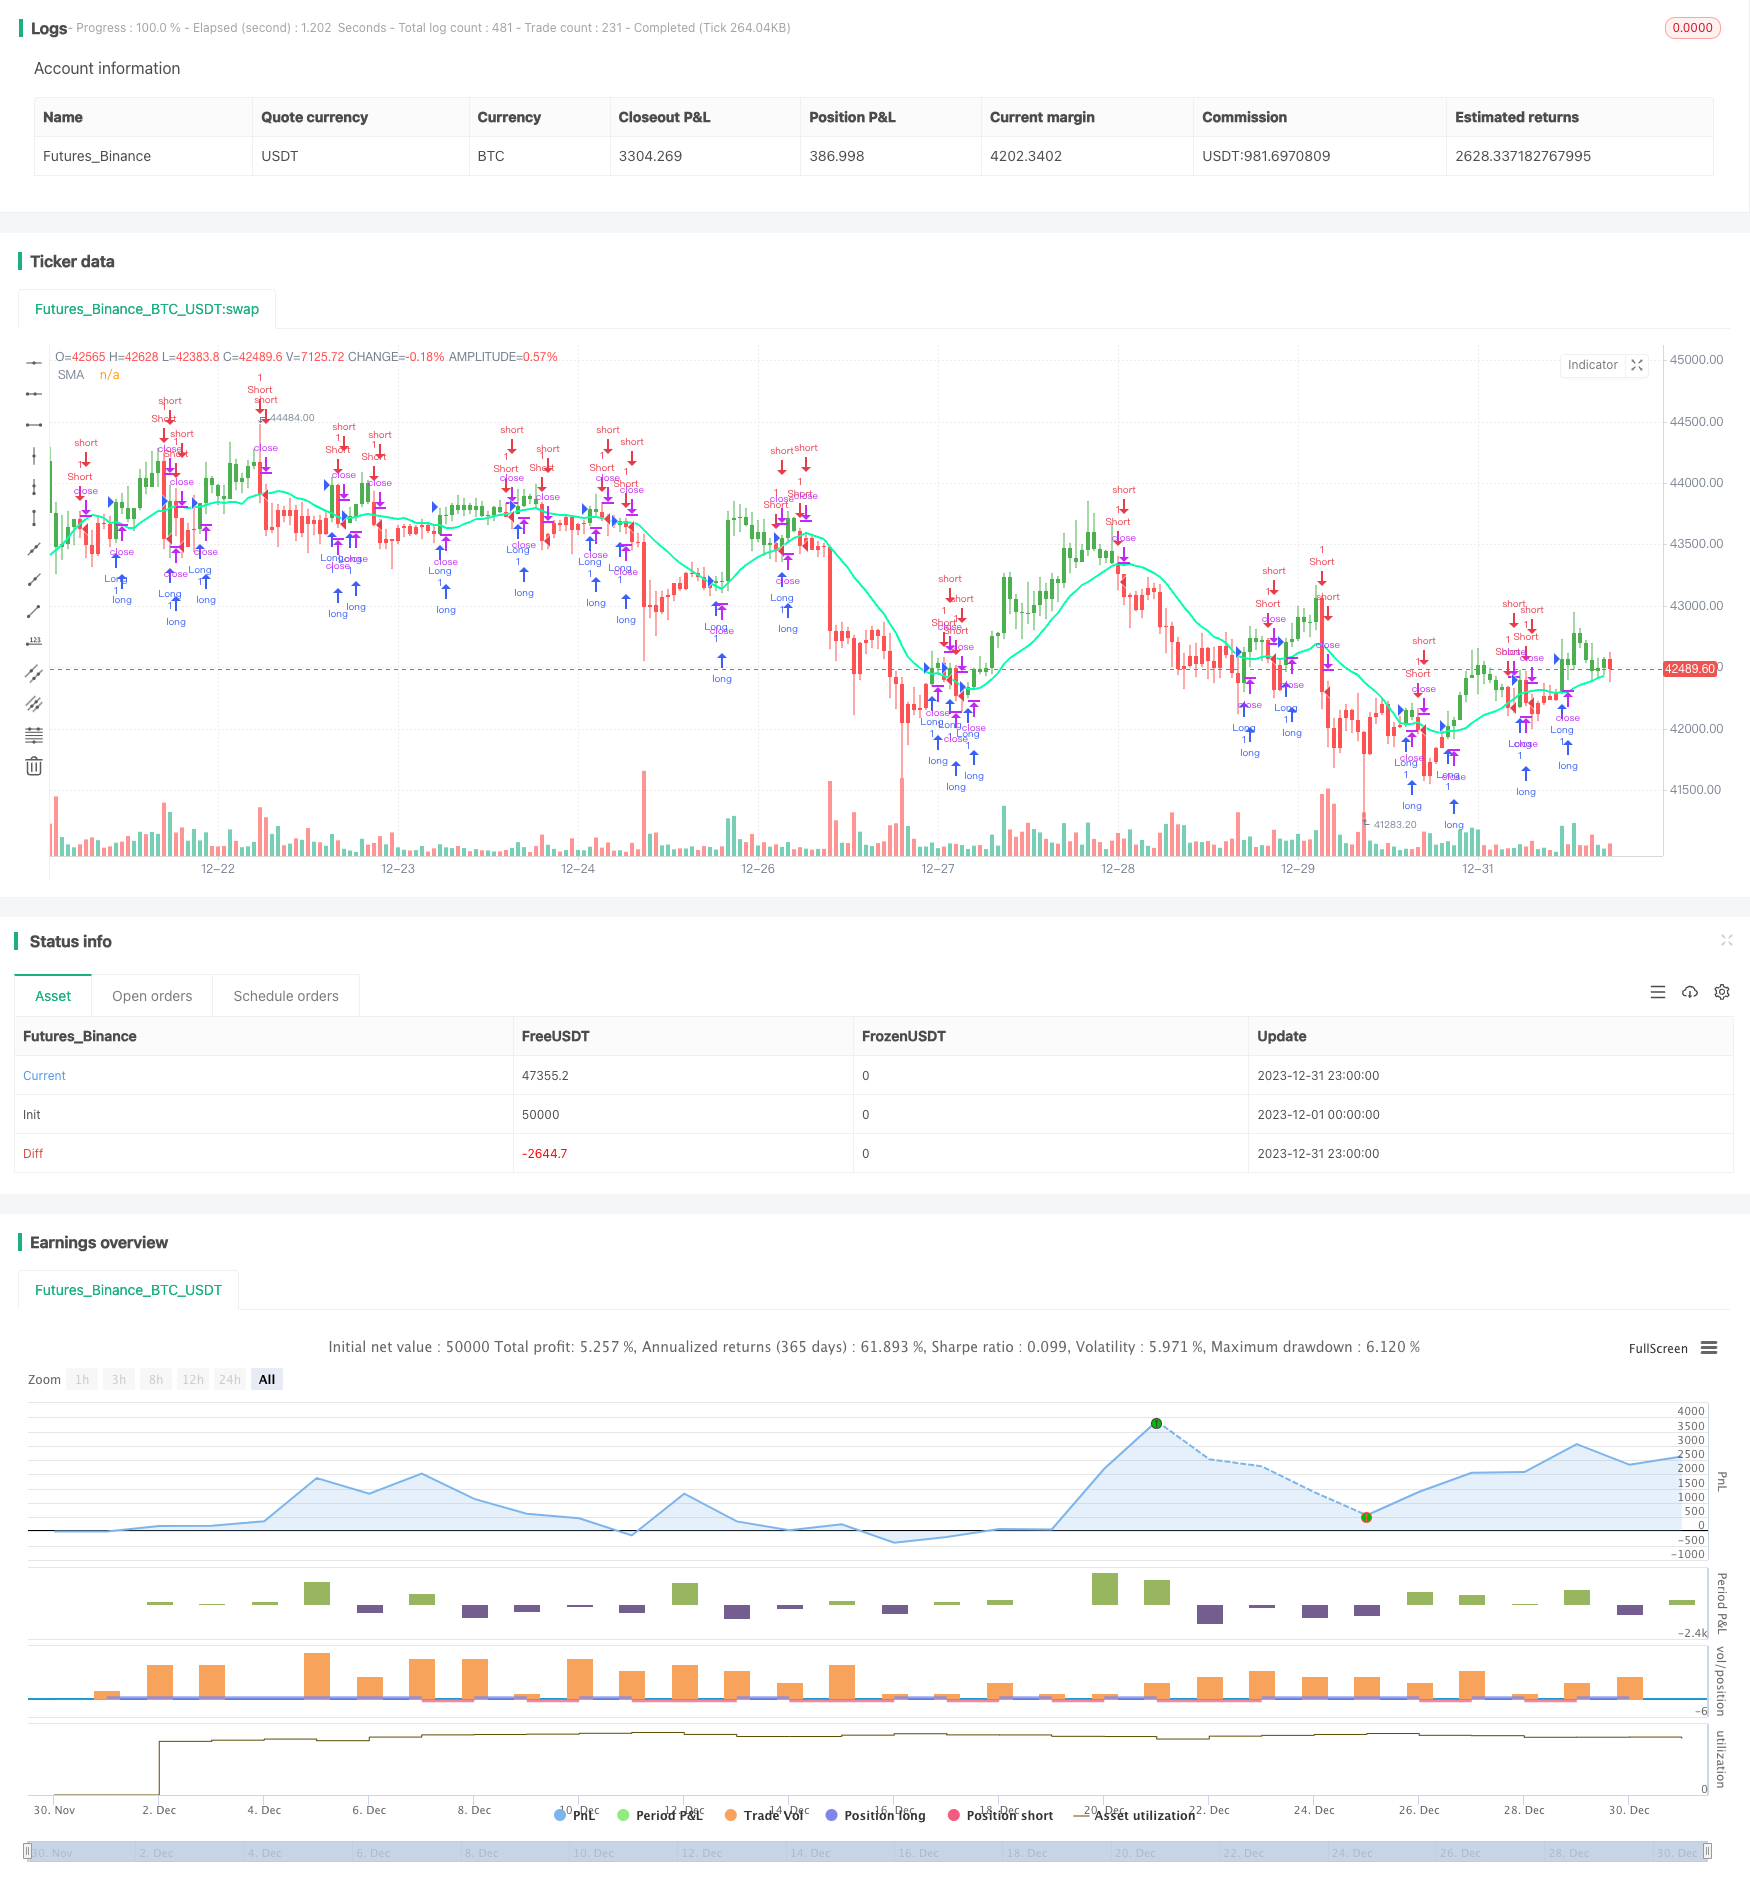
/*backtest
start: 2023-12-01 00:00:00
end: 2023-12-31 23:59:59
period: 1h
basePeriod: 15m
exchanges: [{"eid":"Futures_Binance","currency":"BTC_USDT"}]
*/

// This source code is subject to the terms of the Mozilla Public License 2.0 at https://mozilla.org/MPL/2.0/
// © HPotter
//  Simple SMA strategy
//
// WARNING:
//      - For purpose educate only
//      - This script to change bars colors
//@version=4
strategy(title="Simple SMA Strategy Backtest", shorttitle="SMA Backtest", precision=6, overlay=true)
Resolution = input(title="Resolution", type=input.resolution, defval="D")
Source = input(title="Source", type=input.source, defval=close)
xSeries = security(syminfo.tickerid, Resolution, Source)
Length = input(title="Length", type=input.integer, defval=14, minval=2)
TriggerPrice = input(title="Trigger Price", type=input.source, defval=close)
TakeProfit = input(50, title="Take Profit", step=0.01)
StopLoss = input(20, title="Stop Loss", step=0.01)
UseTPSL = input(title="Use Take\Stop", type=input.bool, defval=false)
BarColors = input(title="Painting bars", type=input.bool, defval=true)
ShowLine = input(title="Show Line", type=input.bool, defval=true)
UseAlerts = input(title="Use Alerts", type=input.bool, defval=false)
reverse = input(title="Trade Reverse", type=input.bool, defval=false)
pos = 0
xSMA = sma(xSeries, Length)
pos := iff(TriggerPrice > xSMA, 1,
         iff(TriggerPrice < xSMA, -1, nz(pos[1], 0)))
nRes = ShowLine ? xSMA : na
alertcondition(UseAlerts == true and pos != pos[1] and pos == 1, title='Signal Buy', message='Strategy to change to BUY')
alertcondition(UseAlerts == true and pos != pos[1] and pos == -1, title='Signal Sell', message='Strategy to change to SELL')
alertcondition(UseAlerts == true and pos != pos[1] and pos == 0, title='FLAT', message='Strategy get out from position')
possig =iff(pos[1] != pos,
         iff(reverse and pos == 1, -1,
           iff(reverse and pos == -1, 1, pos)), 0)
if (possig == 1)
    strategy.entry("Long", strategy.long)
if (possig == -1)
    strategy.entry("Short", strategy.short)

if (UseTPSL)
    strategy.close("Long", when = high > strategy.position_avg_price + TakeProfit, comment = "close buy take profit")
    strategy.close("Long", when = low < strategy.position_avg_price - StopLoss, comment = "close buy stop loss")
    strategy.close("Short", when = low < strategy.position_avg_price - TakeProfit, comment = "close buy take profit")
    strategy.close("Short", when = high > strategy.position_avg_price + StopLoss, comment = "close buy stop loss")
nColor = BarColors ? strategy.position_avg_price != 0  and pos == 1 ? color.green :strategy.position_avg_price != 0 and pos == -1 ? color.red : color.blue : na
barcolor(nColor)
plot(nRes, title='SMA', color=#00ffaa, linewidth=2, style=plot.style_line)