개요
이중 RSI 거래 전략은 상대적으로 강한 지수 ((RSI) 를 기반으로 한 양적 거래 전략이다. 이 전략은 동시에 빠른 RSI와 느린 RSI를 거래 신호로 사용하여 신호 품질을 높이고 가짜 신호를 필터링하기 위해 두 번 확인을 수행합니다.
전략 원칙
이 전략은 두 개의 다른 주기의 RSI를 주요 거래 지표로 사용합니다. 빠른 RSI 주기는 5 일이며, 단기 오버 바이 오버 셀 상황을 포착합니다. 느린 RSI 주기는 14 일이며, 중기 및 장기적인 추세와 핵심 지지 저항을 판단합니다.
구체적인 거래 규칙은 다음과 같습니다.
- 빠른 RSI가 70을 넘고 느린 RSI가 50보다 높을 때, 더 많은 것을하십시오. 빠른 RSI가 30을 넘고 느린 RSI가 50보다 낮을 때, 공백을하십시오.
- 더 많은 스톱 라인을 빠른 RSI 아래로 55를 통과하십시오; 더 많은 스톱 라인을 빠른 RSI 위에 45를 통과하십시오.
이 전략은 빠르고 느린 RSI의 조합을 사용하여 서로 다른 주기간의 상호 작용을 수행하여 중장기 트렌드를 확인하면서 중장기 트렌드를 효과적으로 식별하여 양질의 거래 신호를 생성합니다. 이중 RSI 필터링 메커니즘은 또한 가짜 돌파구로 인한 거래 소음을 줄일 수 있습니다.
우위 분석
이중 RSI 전략의 가장 큰 장점은 가짜 신호를 효과적으로 필터링하고 신호 품질을 향상시켜 불필요한 거래를 줄이고 거래 빈도를 줄일 수 있다는 것입니다. 구체적인 장점은 다음과 같습니다:
- 빠른 느린 RSI 조합을 사용하여 단기, 중기 및 장기 오버 바이 오버 판매 지점을 식별하여 신호의 정확성을 향상시킵니다.
- 듀얼 RSI 필터 메커니즘, 효과적으로 소음을 줄이고, 막힘을 방지
- 낮은 거래 빈도, 거래 비용 및 슬라이드 손실을 줄이는 데 도움이됩니다.
- 단편 손실과 최대 인출을 제어하는 손해 방지 장치
위험 분석
이중 RSI 전략에는 다음과 같은 몇 가지 요소로 인한 위험이 있습니다.
- RSI 자체의 지연은 거래 지연을 초래할 수 있습니다.
- 이중 필터링은 거래 기회를 놓칠 수 있습니다.
- 극단적인 행동의 체계적인 위험은 완전히 피할 수 없습니다.
이 위험은 다음과 같은 방법으로 줄일 수 있습니다.
- 빠른 RSI의 매개 변수를 적절하게 조정하여 민감성을 높여줍니다.
- 포지션 개시 및 중지 조건을 최적화하고, 위험과 수익을 균형을 맞추기
- 트렌드 시스템, 기계 학습 등의 알고리즘과 함께 사용
최적화 방향
이중 RSI 전략에는 더 많은 최적화가 가능합니다. 주요 방향은 다음과 같습니다.
- 동적으로 최적화된 RSI 변수, 시장 환경에 따라 자동으로 조정
- 변동율 기반의 위험 제어 모듈을 추가합니다.
- 텍스트 분석, 소셜 데이터 등과 결합된 대안 신호
- 기계 학습 모델을 사용하여 보조 필터링 신호
이러한 최적화를 통해 전략의 수익성, 안정성 및 적응성을 더욱 향상시킬 수 있습니다.
요약하다
이중 RSI 전략은 전체적으로 매우 실용적인 양적 거래 전략입니다. 그것은 트렌드 추적, 과매매 과매매 식별 및 이중 필터링과 같은 메커니즘을 결합하여 비교적 완전한 거래 시스템을 형성합니다. 이 전략은 위험을 제어하고 거래 빈도를 줄이는 데 탁월한 성능을 발휘하며 중·장기 기간에 적합합니다. 지속적인 최적화와 반복을 통해 이중 RSI 전략은 새로운 1세대 양적 전략의 중요한 구성 요소가 될 전망입니다.
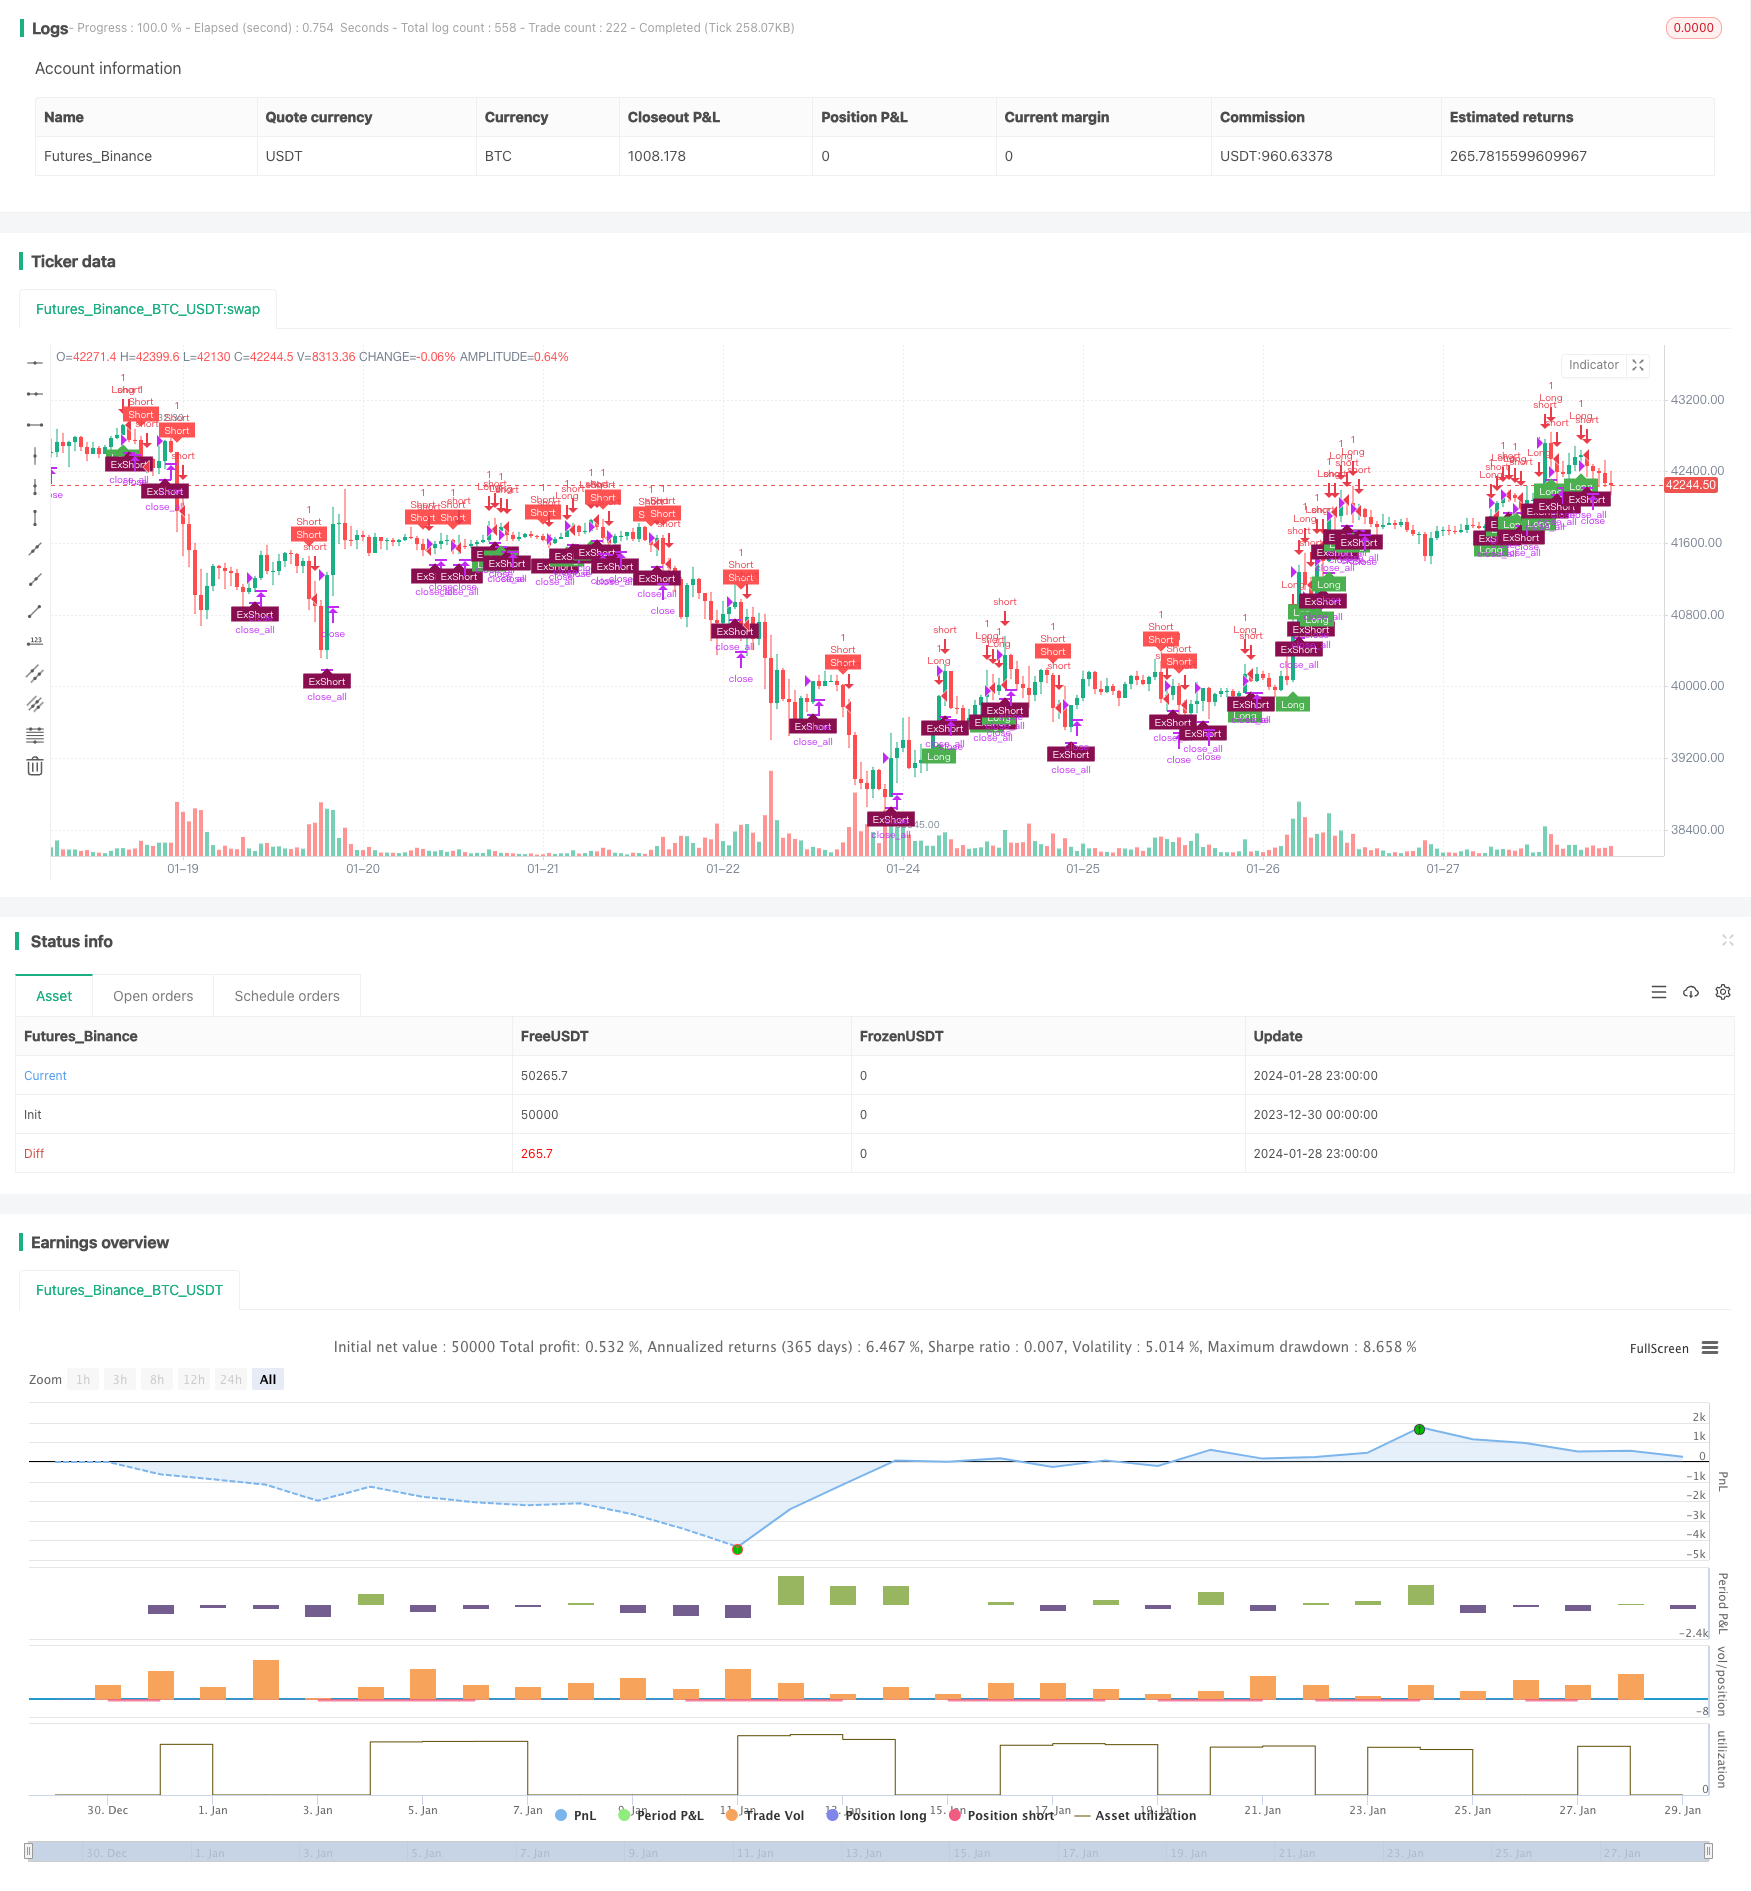
/*backtest
start: 2023-12-30 00:00:00
end: 2024-01-29 00:00:00
period: 1h
basePeriod: 15m
exchanges: [{"eid":"Futures_Binance","currency":"BTC_USDT"}]
*/

// This source code is subject to the terms of the Mozilla Public License 2.0 at https://mozilla.org/MPL/2.0/
// © Ankit_Quant
//@version=4

// ********************************************************************************************************
// This was coded live during webinar on Backtesting in Tradingview
// That was held on 16-Jan-21
// Aim of this strategy is to code a Double Decker RSI Strategy - Rules of Strategy are given in Description
// *********************************************************************************************************

// Identifier of strategy or an indicator (study())
strategy(title="Strategy- Double Decker RSI",shorttitle='Strategy - Double Decker RSI',overlay=true)

// ********************
// INPUTS
// ********************
// RSI Lookback Periods
slowRSI=input(defval=14,title='Slow RSI Period',type=input.integer)
fastRSI=input(defval=5,title='Fast RSI Period',type=input.integer)

// Time Period Backtesting Input
start_year=input(defval=2000,title='Backtest Start Year',type=input.integer)
end_year=input(defval=2021,title='Backtest End Year',type=input.integer)

//Specific Years to Test Starategy
timeFilter=true


// Trade Conditions and signals
long = rsi(close,fastRSI)>70 and rsi(close,slowRSI)>50
short = rsi(close,fastRSI)<40 and rsi(close,slowRSI)<50
long_exit=rsi(close,fastRSI)<55
short_exit=rsi(close,fastRSI)>45

//positionSize - 1 Unit (also default setting)
positionSize=1

// Trade Firing - Entries and Exits
if(timeFilter)
    if(long and strategy.position_size<=0)
        strategy.entry(id='Long',long=strategy.long,qty=positionSize)
    if(short and strategy.position_size>=0)
        strategy.entry(id="Short",long=strategy.short,qty=positionSize)
    if(long_exit and strategy.position_size>0)
        strategy.close_all(comment='Ex')
    if(short_exit and strategy.position_size<0)
        strategy.close_all(comment='Ex')


// Plot on Charts the Buy Sell Labels
plotshape(strategy.position_size<1 and long,style=shape.labelup,location=location.belowbar,color=color.green,size=size.tiny,text='Long',textcolor=color.white)
plotshape(strategy.position_size>-1 and short,style=shape.labeldown,location=location.abovebar,color=color.red,size=size.tiny,text='Short',textcolor=color.white)
plotshape(strategy.position_size<0 and short_exit?1:0,style=shape.labelup,location=location.belowbar,color=color.maroon,size=size.tiny,text='ExShort',textcolor=color.white)
plotshape(strategy.position_size>0 and long_exit?1:0,style=shape.labeldown,location=location.abovebar,color=color.olive,size=size.tiny,text='ExLong',textcolor=color.white)