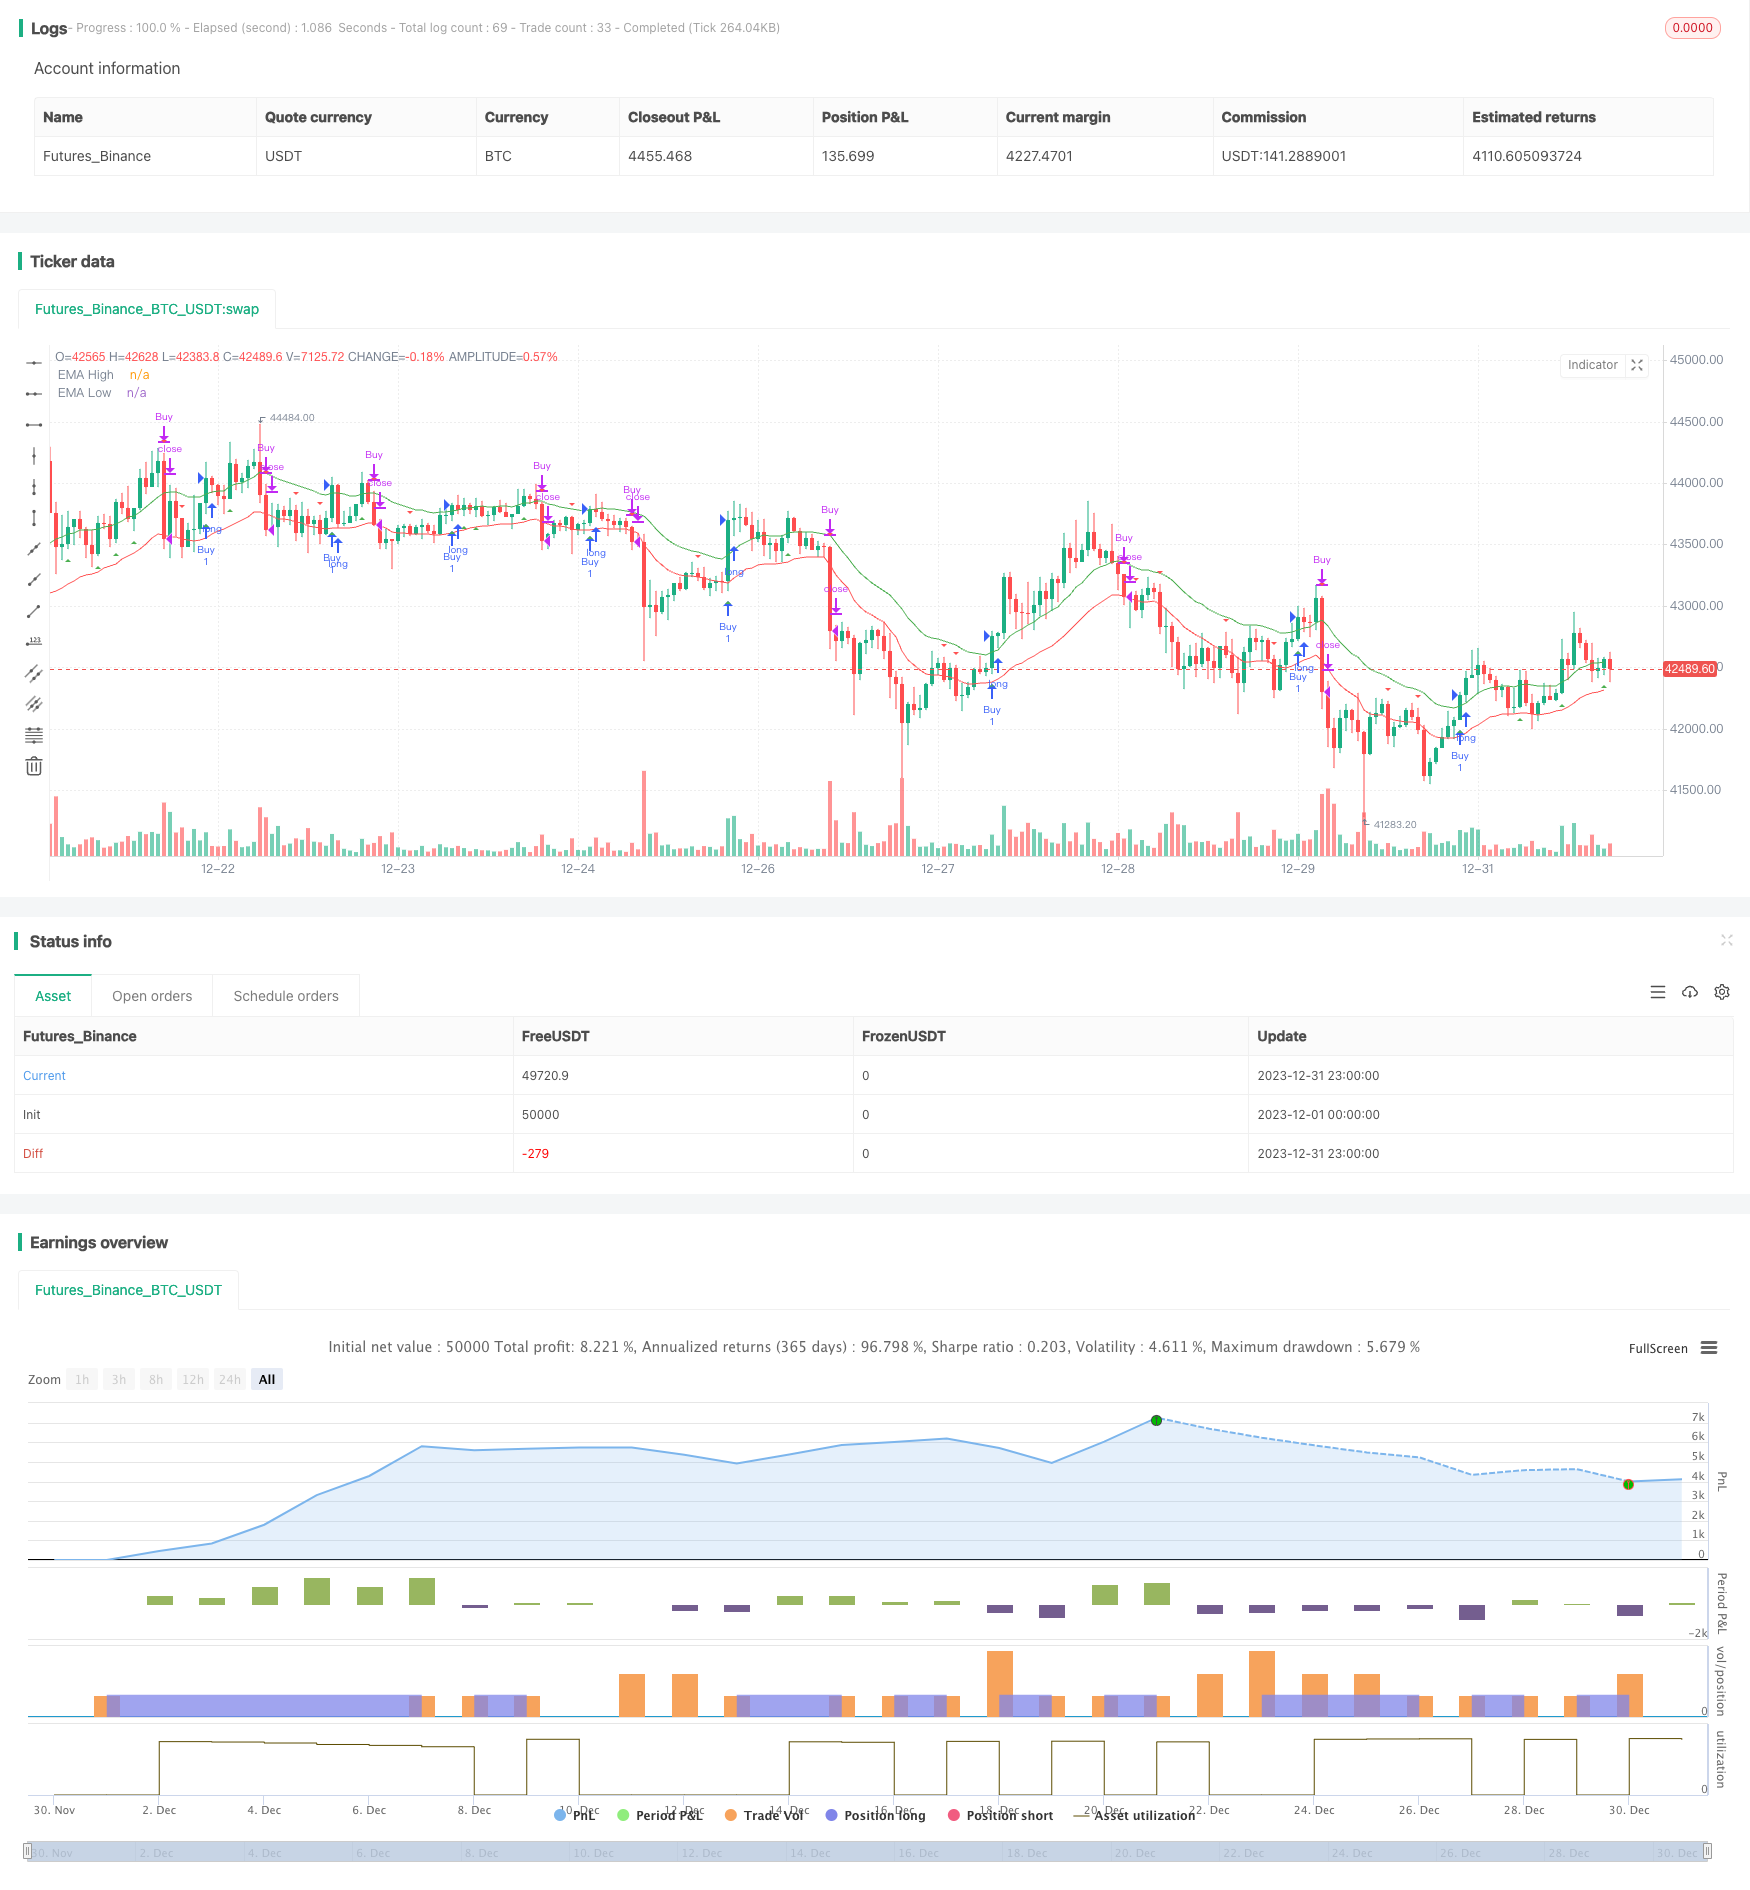
개요
이 전략은 20일 지수 이동 평균 ((EMA) 에 기반하여 채널을 구축하고, 가격이 채널 위를 넘어서면 더 많이 하고, 가격이 채널 아래를 넘어서면 더 적게 하며, 트렌드 추적 전략에 속한다.
전략 원칙
- 20일 EMA의 높고 낮을 계산하고, 통로를 구성한다.
- 20일 EMA 최고점보다 클로즈오프가 높을 때 더 많이 니다.
- 마감 가격이 20일 EMA 하위점보다 작으면 공백을 다.
- 스톱피스는 통로의 다른 끝으로, 예를 들어 20일 EMA의 낮은 지점으로 스톱피스를 합니다.
우위 분석
- EMA를 사용하여 채널을 구축하여 트렌드를 효과적으로 추적할 수 있습니다.
- 20일 EMA 파라미터는 간단하고 실용적이다.
- 을 통해 거래의 오류를 줄일 수 있습니다.
- 스톱포인트는 합리적으로 설정되어 있으며, 위험을 최대한 통제합니다.
위험 분석
- 은 신호는 잘못된 신호가 될 수 있습니다.
- 지진으로 인한 피해가 발생하기 쉽다.
- 잘못된 매개 변수는 너무 민감하거나 느리게 만들 수 있다.
위험 해결 방법:
- 다른 지표와 함께 필터링 신호.
- 최적화 매개 변수, 다른 주기들에 적응한다.
- 신중하게 운영하고, 자금 관리에 주의하십시오.
최적화 방향
- 수량과 가격 지표가 결합된 필터링 오류 신호.
- 다양한 EMA 주기 변수의 효과를 테스트한다.
- 이동한 손실을 증가시켜 수익을 잠금합니다.
- 동향이 강하다는 것은 변동률 지표와 결합해서 판단할 수 있습니다.
요약하다
이 전략은 전반적으로 간단하고 실용적이며, EMA 채널을 기반으로 구성되어 있으며, 전형적인 트렌드 추적 전략에 속한다. 돌파구 신호의 특징이 있지만, 또한 일정한 오해의 위험이 존재한다. 최적화 매개 변수, 필터를 추가하는 등의 방법으로 전략 효과를 향상시킬 수 있으며, 추가 테스트 및 최적화를 할 가치가 있다.
전략 소스 코드
/*backtest
start: 2023-12-01 00:00:00
end: 2023-12-31 23:59:59
period: 1h
basePeriod: 15m
exchanges: [{"eid":"Futures_Binance","currency":"BTC_USDT"}]
*/

//@version=4
strategy("EMA Channel Strategy with Alerts", shorttitle="EMA Channel", overlay=true)

// Define EMA length
emaLength = 20

// Calculate EMA values
emaHigh = ema(high, emaLength)
emaLow = ema(low, emaLength)

// Define the condition for a buy signal
buyCondition = crossover(close, emaHigh)

// Define the condition for a sell signal
sellCondition = crossunder(close, emaLow)

// Plot the EMA lines
plot(emaHigh, color=color.green, title="EMA High")
plot(emaLow, color=color.red, title="EMA Low")

// Plot buy and sell signals
plotshape(buyCondition, style=shape.triangleup, location=location.belowbar, color=color.green, title="Buy Signal")
plotshape(sellCondition, style=shape.triangledown, location=location.abovebar, color=color.red, title="Sell Signal")

// Strategy
strategy.entry("Buy", strategy.long, when=buyCondition)
strategy.close("Buy", when=sellCondition)

// Define and trigger alerts
alertcondition(buyCondition, title="Buy Alert", message="Buy signal - Price crossed above EMA High")
alertcondition(sellCondition, title="Sell Alert", message="Sell signal - Price crossed below EMA Low")