개요
이 전략은 시장 유동성, 트렌드 및 기술 지표와 같은 여러 차원을 종합적으로 고려하여 단선 전략 거래를 구현합니다. 이 전략은 추세를 따라가고, 시장 유동성이 더 좋을 때 포지션을 개설하여 단선 이익을 얻을 수 있습니다.
전략 원칙
기본 원칙: 이 전략은 주로 시장 유동성 및 트렌드 두 차원을 고려한다. 시장 유동성이 좋고 트렌드가 나타나면 단선 조작한다.
시장 유동성 지표: 이 전략은 주로 MFI와 거래량 변화를 시장 유동성 지표로 사용합니다. MFI가 증가하고 거래량이 증가하면 시장 유동성이 더 좋으며 입장을 열기에 적합하다고 생각합니다.
동향 판단: 이 전략은 ADX, EMA 등 여러 지표의 동향 판단을 결합한다. ADX가 30보다 높고 그 EMA가 동향이 강하다는 것을 나타낸다. 동향을 검증할 수 있는 것은 금이 교차하는 등 빠른 속도로 EMA가 발생하는 경우도 있다.
포지션 개시 조건: 시장의 유동성이 좋고 동시 동시 추세가 나타났을 때, 다른 보조 조건 (SAR 위치 판단 등) 도 충족되면 포지션 개시 신호가 발생한다.
스톱 스톱 스로스 설정: 이 전략은 각 거래에 대해 고정 스톱 스로스 (10 포인트) 와 스톱 스로스 (7.5 포인트) 를 설정합니다.
우위 분석
이 전략은 다음과 같은 장점을 가지고 있습니다.
시장 유동성을 판단할 때: MFI와 거래량에 따라 시장 유동성을 판단하고 시장 유동성이 떨어질 때 포지션을 열지 마십시오.
트렌드를 추적하여 수익을 얻습니다. EMA와 같은 지표와 함께 트렌드 방향을 판단하여 트렌드 수익을 얻습니다.
리스크 제어 위치: 고정 스톱 스톱 손실을 설정하여 단일 거래 최대 손실을 효과적으로 제어합니다.
거래 빈도가 높다: 단선 전략으로 거래 빈도가 높고, 점차적으로 이익을 축적하는 데 적합하다.
매개 변수 최적화 공간이 넓다. 예를 들어 MA 매개 변수, 스톱 스톱 설정 등이 최적화되어 전략 효과를 높일 수 있다.
위험 분석
이 전략에는 몇 가지 위험도 있습니다.
실 디스크 슬라이드 제어 위험: 이론적 스톱 스톱은 실 디스크 상황을 완전히 반영하지 않으며, 실 디스크의 슬라이드 포인트가 상대적으로 클 수 있다.
동향 판단 실패 위험: 이 전략은 동향 판단에 더 많은 지표에 의존하지만 여전히 실패할 가능성이 있다.
과도한 거래 위험: 단선 전략으로, 만약 변수가 잘못 설정되면 과도한 거래가 발생할 수 있다.
시장의 이상 상황 위험: 시장의 유동성이 매우 낮거나 정책의 변화와 같은 극단적인 상황에서는 이 전략이 정상적으로 작동하지 않을 수 있습니다.
“이런 일이 벌어진다면, 우리는 이 위험을 줄일 수 있습니다.
실디 스라이드 요소를 고려하여 적절한 스포드 레저를 완화하십시오.
트렌드 판단 논리를 최적화하고, 더 많은 지표를 도입하여 실패 확률을 낮추십시오.
포지션 개설 횟수 제한을 추가하여 과도한 거래를 방지하십시오.
시장 상황에 따라 변수를 유연하게 조정하고, 비정상적인 상황에 대응한다.
최적화 방향
이 전략의 최적화 방향은 다음과 같습니다.
더 많은 지표를 도입하여 트렌드 판단을 최적화하여 판단을 더 정확하게 한다. 예를 들어 MACD 지표를 도입한다.
MA의 주기 변수를 최적화하여 최적의 변수 조합을 찾는다.
이동식 상쇄, 간격상쇄와 같은 상쇄 전략의 개선.
거래 횟수에 제한을 추가하여 너무 높은 거래 빈도를 피하십시오. 예를 들어, 하루에 최대 3번의 포지션을 열 수 있습니다.
더 나은 시장 유동성 지표를 찾고, 포지션 개시 시점을 더 판단하십시오. 예를 들어, 순 유입량과 같은 지표를 도입하십시오.
매개 변수 최적화 기능을 추가하여 매개 변수를 자동으로 최적화하여 최적의 매개 변수 조합을 찾습니다.
요약하다
이 전략은 시장 유동성 및 추세와 같은 여러 차원을 종합적으로 고려하여 단선 내에서 수익을 포착합니다. 전통적인 추세 전략에 비해 이 전략의 가장 큰 혁신은 시장 유동성 지표를 도입하여 시장 유동성이 떨어질 때 포지션을 중단하지 않는 것입니다. 이에 따라 이 전략에는 특정 실물 제어 위험과 추세 판단 실패 위험이 있습니다. 우리는 더 많은 지표, 최적화 파라미터 및 위험 관리 방법을 도입하여 지속적으로 전략을 개선 할 수 있습니다.
/*backtest
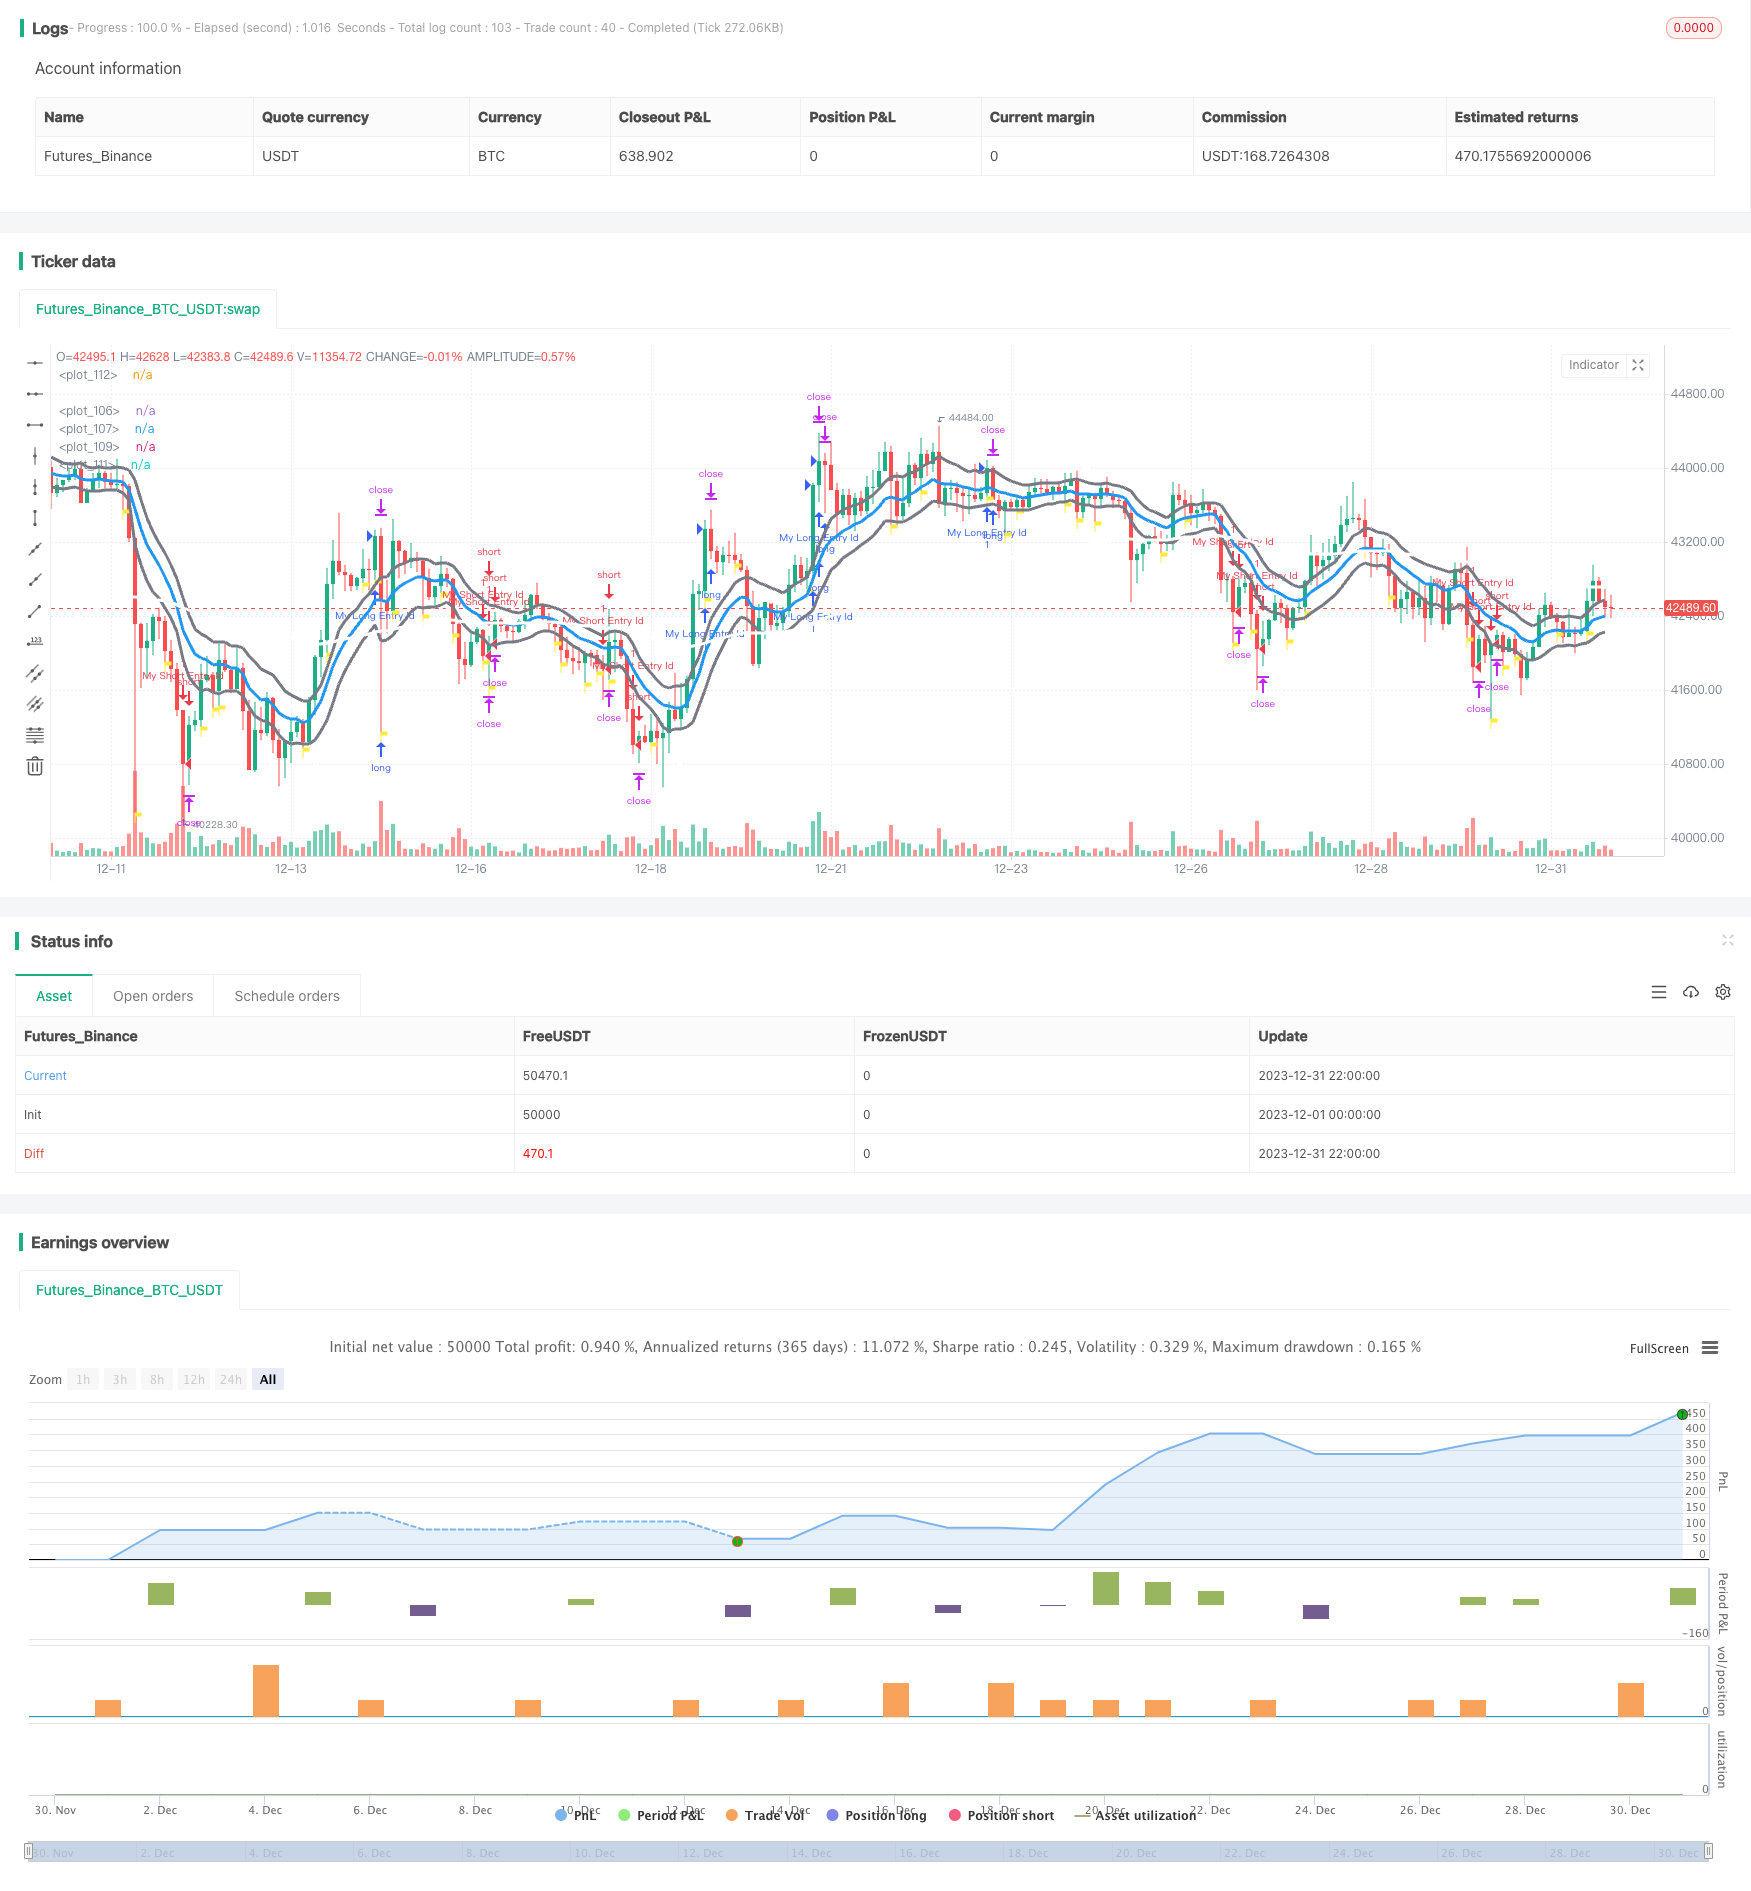
start: 2023-12-01 00:00:00
end: 2023-12-31 23:59:59
period: 2h
basePeriod: 15m
exchanges: [{"eid":"Futures_Binance","currency":"BTC_USDT"}]
*/
// This source code is subject to the terms of the Mozilla Public License 2.0 at https://mozilla.org/MPL/2.0/
// © trent777brown
//@version=5
strategy("scalping with market facilitation", overlay=true, margin_long=100, margin_short=100)
MFI0 = (high - low) / volume
MFI1 = (high[1] - low[1]) / volume[1]
MFIplus = MFI0 > MFI1
MFIminus = MFI0 < MFI1
//Current Trend-(Changed mean to trend)-revised
trendplus = hl2 > high[1]
trendzero = hl2 < high[1] and hl2 > low[1] //addition of script
trendminus = hl2 < low[1] //changed high to low
//Volume +/-
volplus = volume > volume[1]
volminus = volume < volume[1]
//Period Control by Buyers or Sellers is determined with reference to Price action of the period
//divided into 3 sectors, sector 1 is the Top third, Sector 2 is the middle third,
//and sector 3 is the Bottom third of the period. Control classifications are: Extremes(11, 33), Neutral(22),
//Climbers(31,21,32) Open lower than Close, and Drifters(13,23,12)Close lower than Open
//value0 = low
//value1 = ((high - low)/3)
//value2 = ((high - low)/3)*2
//value3 = high
//o1 = (open >= (((high - low)/3) * 2) + low)
//c1 = (close >= (((high - low)/3) * 2) + low)
//o2 = (open <= o1)
//c2 = (close <= c1)
//o3 = (open <= ((high - low)/3) + low)
//c3 = (close <= ((high - low)/3) + low)
//sector2 = if((high - low)/3) + low and sector2 <= (((high - low)/3)*2) + low
//sector3 = if((high - low)/3) + low and >= low
//Extremes-Full Control of Period by Buyers or Sellers
//pg79 notes an 85% chance that the current trend will change in the next 1 to 5 bars
b11 = open >= (high - low) / 3 * 2 + low and close >= (high - low) / 3 * 2 + low //Extreme Buyer Control:Chartruse
b33 = open <= (high - low) / 3 + low and close <= (high - low) / 3 + low //Extreme Seller Control:Crimson
//Neutral pg80
b22 = open >= (high - low) / 3 + low and open <= (high - low) / 3 * 2 and close >= (high - low) / 3 + low and open <= (high - low) / 3 * 2 //Bracketed Price Control
//Climber-Open lower than Close pg81
b31 = open <= (high - low) / 3 + low and close >= (high - low) / 3 * 2 + low //Strong Buyer Control:Dark Green
b21 = open >= (high - low) / 3 + low and open <= (high - low) / 3 * 2 and close >= (high - low) / 3 * 2 + low //Moderate Buyer Control:Green
b32 = open <= (high - low) / 3 + low and close >= (high - low) / 3 + low and open <= (high - low) / 3 * 2 //Weak Buyer Control:Light Green
//Drifter-Close lower than Open pg81
b13 = open >= (high - low) / 3 * 2 + low and close <= (high - low) / 3 + low //Strong Seller Control:Dark Red
b23 = open >= (high - low) / 3 + low and open <= (high - low) / 3 * 2 and close <= (high - low) / 3 + low //Moderate Seller Control:Red
b12 = open >= (high - low) / 3 * 2 + low and close >= (high - low) / 3 + low and open <= (high - low) / 3 * 2 //Weak Seller Control:Light Red/Pink
//
psar= ta.sar(.09, .2, .2)
ema8= ta.ema(hlc3, 8)
ema13h= ta.ema(high, 13)
ema13l= ta.ema(low, 13)
ema13= ta.ema(close, 13)
ema55= ta.ema(close, 100)
[dip, dim, adx]= ta.dmi(5, 5)
adxema=ta.ema(adx, 3)
[macdl, sigl, histl]= ta.macd(close, 8, 13, 5)
obv= ta.obv
obvema= ta.ema(obv, 8)
obvema55= ta.ema(obv, 55)
mfigreen= MFIplus and volplus
adx_x_over= ta.crossover(adx, adxema) and adx >= 25
barssincemfi= ta.barssince(mfigreen)
longtrig2= adx > 30 and adx > adxema and barssincemfi <= 4
shorttrig2= adx > 30 and adx > adxema and barssincemfi <= 4
long= macdl > sigl and obv > obvema55 and ema8 > ema55 and psar < low and trendplus//and ema13l > ema55//and open > hull200 and close > hull200
short= macdl < sigl and obv < obvema55 and ema8 < ema55 and psar > high and trendminus//and ema13h < ema55//open < hull200 and close < hull200
//plot(hull200, color=color.red, linewidth=3)
plot(ema13h, color=color.gray, linewidth=3)
plot(ema13l, color=color.gray, linewidth=3)
plot(ema13, color=color.blue, linewidth=3)
//
plot(ema55, color=color.white, linewidth=3)
plot(psar, color=color.white, style=plot.style_circles)
plotshape(mfigreen, color=color.yellow, style=shape.flag, location=location.belowbar, size= size.tiny)
longCondition = long
if (longCondition)
strategy.entry("My Long Entry Id", strategy.long, 1, when= longtrig2)
strategy.exit("exit long", "My Long Entry Id", profit= 100, loss= 75)
shortCondition = short
if (shortCondition)
strategy.entry("My Short Entry Id", strategy.short, 1, when= shorttrig2)
strategy.exit("exit short", "My Short Entry Id", profit= 100, loss= 75)