개요
이 전략의 핵심 아이디어는 Wix 수리 지표와 그것의 선형 회귀를 결합하여 시장의 낮은 지점을 정확하게 포착하는 것이다. 이 전략은 ?? 수리 선형 회귀 낮은 지점 전략 ?? 이라고 불린다.
전략 원칙
- Wix 수리 지표를 계산하면 시장의 하락을 더 잘 알 수 있습니다.
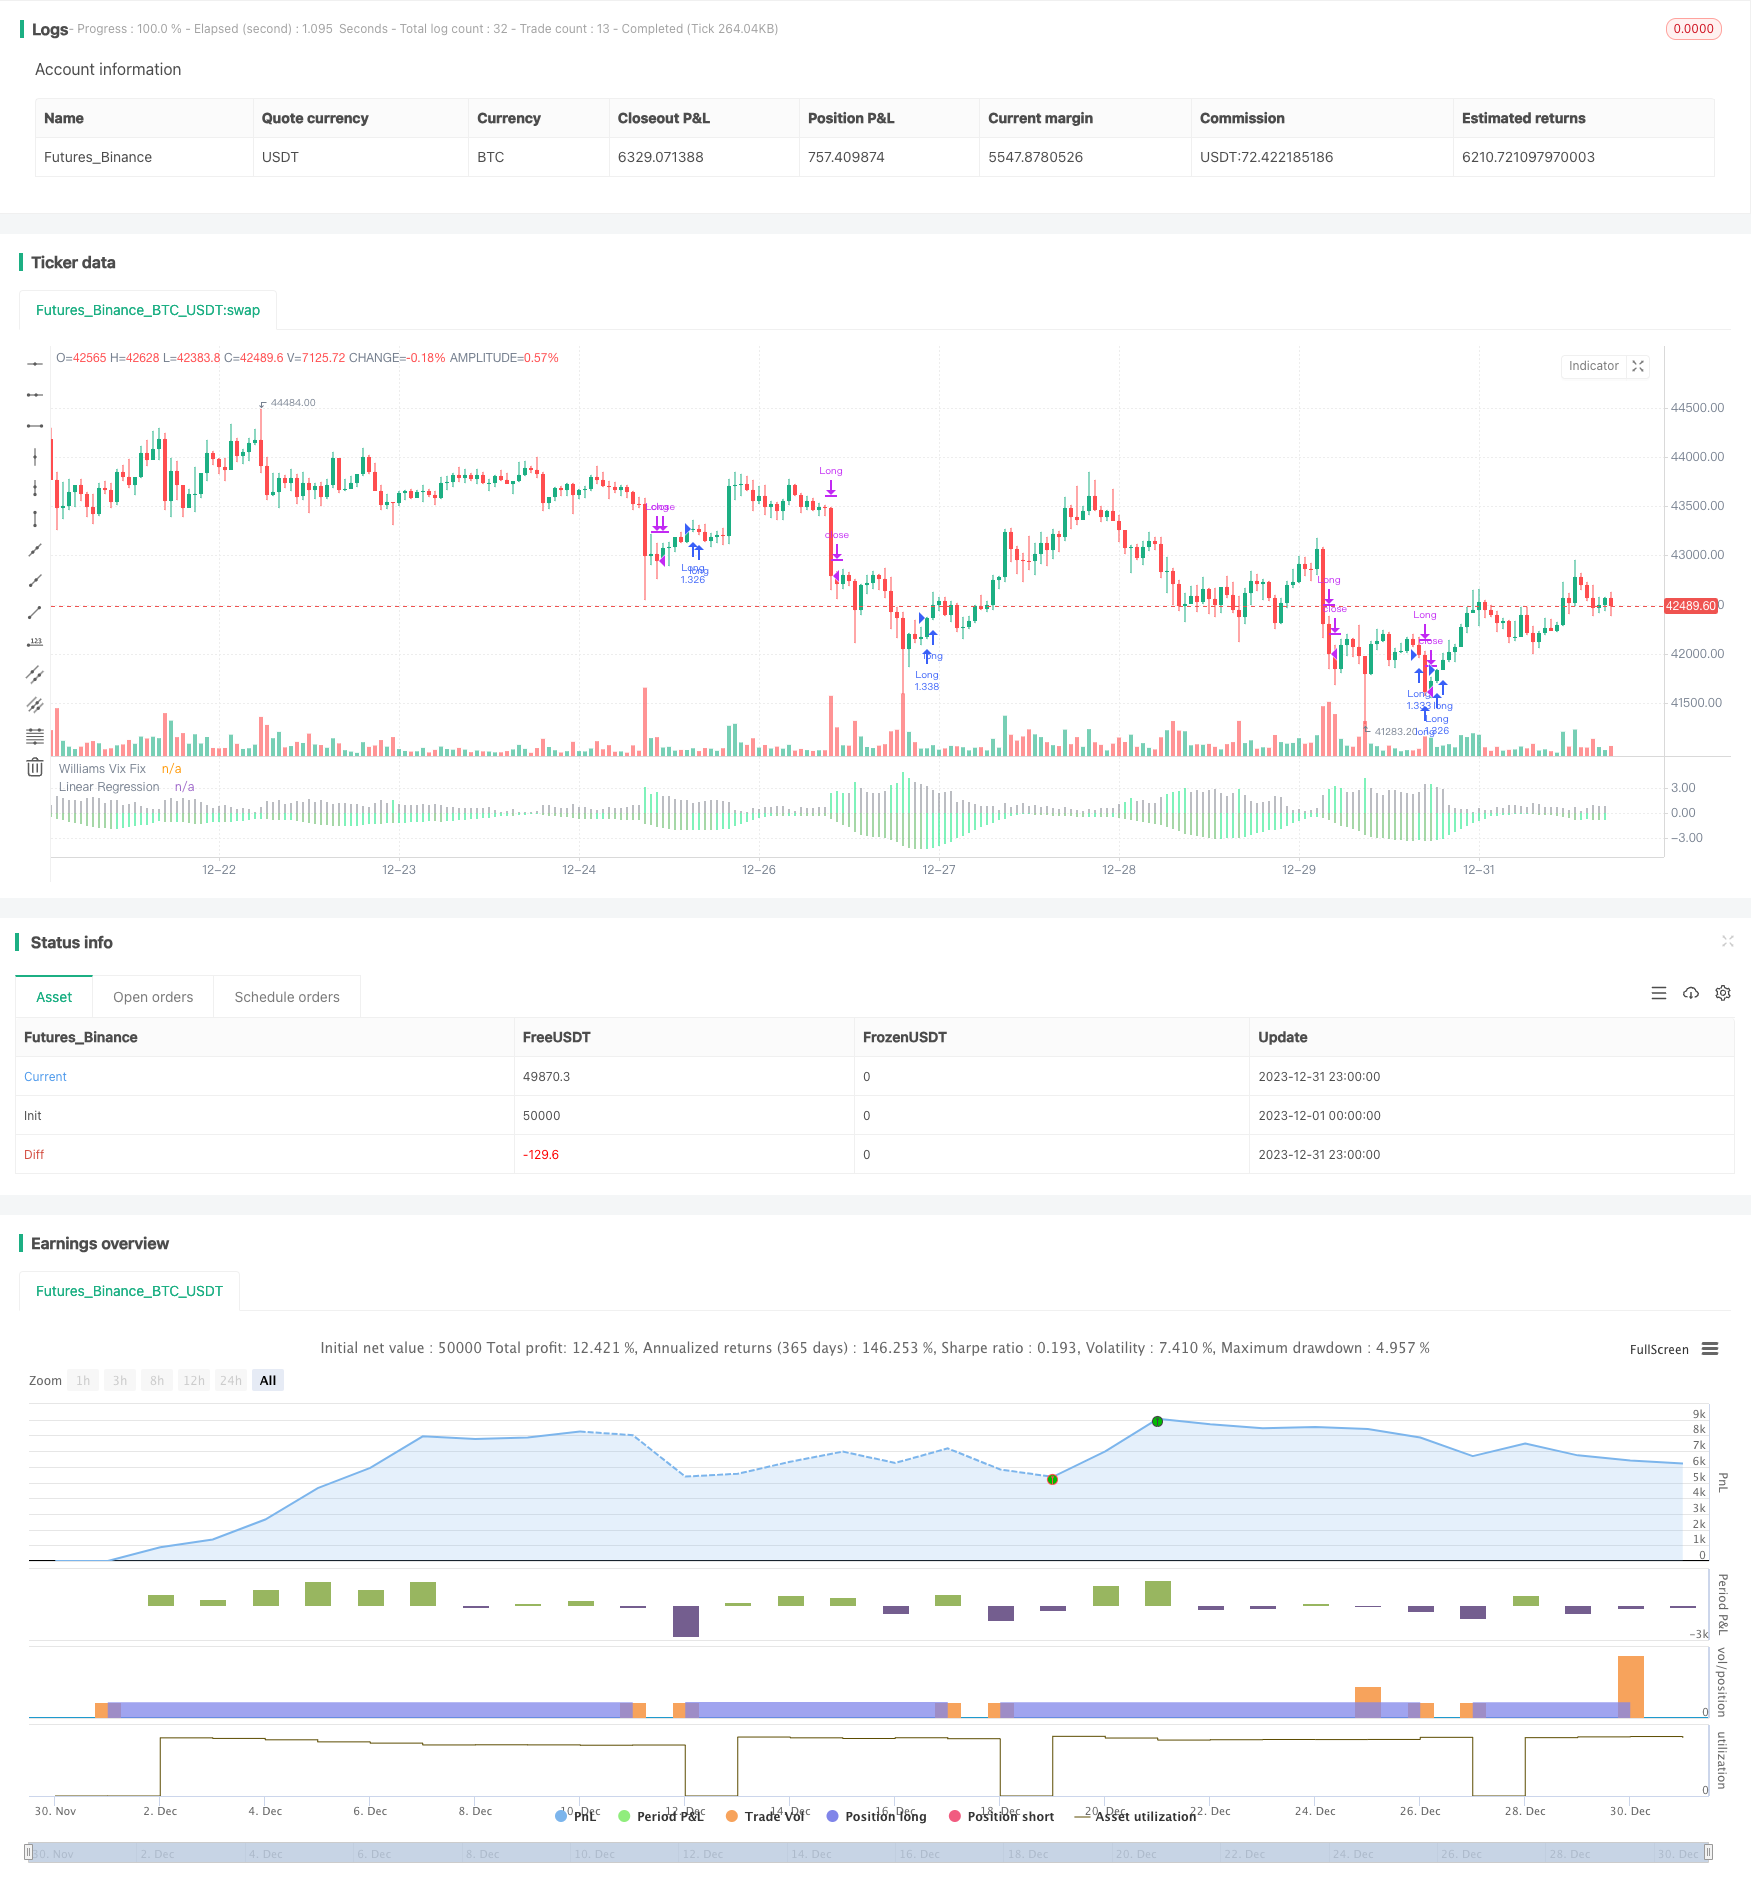
- Wix 수리 지표에 선형 회귀를 적용하십시오. 선형 회귀 히스토그램 색이 초록색으로 변하면 구매 신호를 발산할 수 있습니다.
- Wix 수리 지표의 녹색 기둥과 결합하여 구매 시기를 추가로 확인할 수 있습니다.
- 리니어 회귀 히스토그램 색이 빨간색으로 변하면, Wix가 리니어 회귀를 수리하기 시작하면 판매 신호를 발산합니다.
위 프로세스는 선형 회귀를 사용하여 Wix가 지표 신호의 정확도와 적시에 고치며, 일부 가짜 신호를 필터링하여 저점을 정확하게 잡습니다.
우위 분석
- 구매/판매 신호를 더 정확하고 신뢰할 수 있도록 비크스 수리 지표의 일부 가짜 신호를 리니어 회귀 필터링하는 전략
- 선형 회귀는 신호의 감수성과 적시성을 높여 시장의 전환점을 빠르게 잡을 수 있습니다.
- 전략 논리는 간단하고 명확하며, 이해하기 쉬운 구현, 양적 거래에 적합합니다.
- 많은 구성 가능한 매개 변수, 시장의 변화에 적응할 수 있는 유연한 조정
위험과 해결
- 이 전략은 주로 시장 전체의 낮은 지점을 판단하기 위해 사용되며 개별 주식에는 적합하지 않습니다.
- 선형 회귀는 가짜 신호를 완전히 필터링 할 수 없으며, Wix 수리 지표와 결합하면 위험을 줄일 수 있습니다.
- 변수를 적절하게 조정하여 실황의 변화에 적응하여 실효성을 방지해야 합니다.
- 신호를 추가 확인하기 위해 다른 지표와 함께 사용하는 것이 좋습니다.
최적화 방향
- 진동률 지표 또는 양력 지표와 결합하여 신호를 더 필터링 할 수 있습니다.
- 더 똑똑한 전략을 만들기 위해 최적화 방법을 연구할 수 있습니다.
- 더 복잡한 모델을 사용하여 Wix 수리 움직임을 예측하는 기계 학습 방법을 탐색 할 수 있습니다.
- 개인 주식에서도 비슷한 방법을 사용해 가짜 신호를 필터링하는 방법을 연구할 수 있습니다.
요약하다
이 전략은 Wix 수리 지표의 낮은 점을 판단하는 동시에, 선형 회귀를 도입하여 신호 품질을 향상시켜 시장의 낮은 점을 효과적으로 포착할 수 있다. 전략은 간단하고 실용적이며, 결과는 이상적이며, 주요 위험은 거짓 신호를 완전히 필터링하지 못하다. 우리는 여전히 파라미터 설정을 최적화하고, 다른 수단의 도입을 고려하여 신호를 더 확인하여 전략을 더 완성시킨다.
전략 소스 코드
/*backtest
start: 2023-12-01 00:00:00
end: 2023-12-31 23:59:59
period: 1h
basePeriod: 15m
exchanges: [{"eid":"Futures_Binance","currency":"BTC_USDT"}]
*/

// This source code is subject to the terms of the Mozilla Public License 2.0 at https://mozilla.org/MPL/2.0/
// © HeWhoMustNotBeNamed

//@version=4
strategy("VixFixLinReg-Strategy", shorttitle="VixFixLinReg - Strategy",
                     overlay=false, initial_capital = 100000,
                     default_qty_type = strategy.percent_of_equity, default_qty_value = 100, commission_type = strategy.commission.percent, pyramiding = 1,
                     commission_value = 0.01)
pd = input(22, title="LookBack Period Standard Deviation High")
bbl = input(20, title="Bolinger Band Length")
mult = input(2.0    , minval=1, maxval=5, title="Bollinger Band Standard Devaition Up")
lb = input(50  , title="Look Back Period Percentile High")
ph = input(.85, title="Highest Percentile - 0.90=90%, 0.95=95%, 0.99=99%")
pl = input(1.01, title="Lowest Percentile - 1.10=90%, 1.05=95%, 1.01=99%")
hp = input(false, title="Show High Range - Based on Percentile and LookBack Period?")
sd = input(false, title="Show Standard Deviation Line?")
i_startTime = input(defval = timestamp("01 Jan 2010 00:00 +0000"), title = "Start Time", type = input.time)
i_endTime = input(defval = timestamp("01 Jan 2099 00:00 +0000"), title = "End Time", type = input.time)
inDateRange = true
considerVIXFixClose = input(false)
lengthKC=input(20, title="KC Length")
multKC = input(1.5, title="KC MultFactor")

atrLen = input(22)
atrMult = input(5)
initialStopBar = input(5)
waitForCloseBeforeStop = input(true)
f_getStop(atrLen, atrMult)=>
    stop = strategy.position_size > 0 ? close - (atrMult * atr(atrLen)) : lowest(initialStopBar)
    stop := strategy.position_size > 0 ? max(stop,nz(stop[1], stop)) : lowest(initialStopBar)
    stop

wvf = ((highest(close, pd)-low)/(highest(close, pd)))*100

sDev = mult * stdev(wvf, bbl)
midLine = sma(wvf, bbl)
lowerBand = midLine - sDev
upperBand = midLine + sDev

rangeHigh = (highest(wvf, lb)) * ph
rangeLow = (lowest(wvf, lb)) * pl


col = wvf >= upperBand or wvf >= rangeHigh ? color.lime : color.gray

val = linreg(wvf, pd, 0)
absVal = abs(val)

linRegColor = val>val[1]? (val > 0 ? color.green : color.orange): (val > 0 ? color.lime : color.red)
plot(hp and rangeHigh ? rangeHigh : na, title="Range High Percentile", style=plot.style_line, linewidth=4, color=color.orange)
plot(hp and rangeLow ? rangeLow : na, title="Range High Percentile", style=plot.style_line, linewidth=4, color=color.orange)
plot(wvf, title="Williams Vix Fix", style=plot.style_histogram, linewidth = 4, color=col)
plot(sd and upperBand ? upperBand : na, title="Upper Band", style=plot.style_line, linewidth = 3, color=color.aqua)

plot(-absVal, title="Linear Regression", style=plot.style_histogram, linewidth=4, color=linRegColor)

vixFixState = (col == color.lime) ? 1: 0
vixFixState := strategy.position_size == 0? max(vixFixState, nz(vixFixState[1],0)) : vixFixState

longCondition = (vixFixState == 1 and linRegColor == color.lime) and inDateRange
exitLongCondition = (linRegColor == color.orange or linRegColor == color.red) and considerVIXFixClose

stop = f_getStop(atrLen, atrMult)
label_x = time+(60*60*24*1000*20)
myLabel = label.new(x=label_x, y=0, text="Stop : "+tostring(stop), xloc=xloc.bar_time, style=label.style_none, textcolor=color.black, size=size.normal)
label.delete(myLabel[1])
strategy.entry("Long", strategy.long, when=longCondition, oca_name="oca_buy")
strategy.close("Long", when=exitLongCondition or (close < stop and waitForCloseBeforeStop and linRegColor == color.green))
strategy.exit("ExitLong", "Long", stop = stop, when=not waitForCloseBeforeStop and linRegColor == color.green)