개요
이 글은 포식 패턴으로 수익 기회를 식별하고 가격과 이동 평균의 교차로 입문 신호로 하는 알고리즘 거래 전략을 소개한다. 이 전략은 가격 기술 분석과 트렌드 추적 방법을 결합하여 종합하고 트렌드 역점 지점을 수익으로 만드는 것을 목표로 한다.
원칙
이 전략의 핵심 논리는 두 개의 상관없는 지표의 결합에 기초하고 있습니다.
삼키기 형태: K선 두 개의 역전 모드, K선 두 번째의 개체가 K선 첫 번째의 개체를 완전히 삼키고, 역전 기회를 식별하기 위해 사용된다.
가격과 이동 평균의 교차: 가격이 이동 평균 아래에서 상향 교차 이동 평균을 돌파 할 때, 구매 신호를 생성; 가격이 이동 평균 위에서 상향 교차 이동 평균을 돌파 할 때, 판매 신호를 생성.
포식형태를 통해 시장이 반전할 수 있는 시점을 판단하고, 가격과 이동 평균의 교차를 결합하여 반전을 결정하는 필터 신호로, 수익을 얻을 수 있는 확률을 높일 수 있다.
구체적으로, 이 전략은 3가지 포식 형태를 추적함으로써, 즉, 다중 헤드 포식, 공백 헤드 포식, 무선 포식, 평형 및 반전의 가능성을 판단한다. 그리고 가격과 이동 평균의 골드 포크와 데드 포크 신호를 필터링하여, 결국 포지션 방향을 결정한다.
장점
이 전략의 가장 큰 장점은 비관적 지표의 결합을 사용하여 의사결정의 효과를 높이는 것입니다. 포식 형태는 시장의 반전의 시간과 가능성을 판단합니다. 가격과 이동 평균의 교차는 반전의 방향과 강도를 검증합니다. 둘은 상호 검증되어 잘못된 신호로 인한 거래 손실을 효과적으로 줄일 수 있습니다.
또 다른 장점은 변수 설정의 유연성이다. 사용자는 직접 이동 평균 주기, 스톱 로즈 폭과 같은 변수를 설정하여 전략을 최적화 할 수 있다.
위험
여러 지표를 활용하여 판단의 효과를 높였음에도 불구하고, 이 전략은 여전히 잘못된 신호의 위험을 가지고 있습니다. 포식 형태는 100% 신뢰할 수 있는 반전 신호가 아니며, 가격과 이동 평균의 교차는 무효가 될 수도 있습니다.
또한, 대부분의 기술 분석 전략과 마찬가지로, 이 전략은 가격 변동과 같은 충돌 상황을 정리하는 시장에 좋지 않습니다. 지속적인 변동은 스톱로스를 유발하거나 수익 공간을 줄일 수 있습니다.
위험을 제어하기 위해 이동 평균 파라미터를 적절히 조정하여 손해 중지 범위를 최적화 할 수 있습니다. 다른 지표와 함께 동적 조정 전략의 참여 정도를 고려할 수 있습니다.
최적화 방향
이 전략은 다음과 같은 몇 가지 측면에서 최적화될 수 있습니다.
더 많은 종류의 이동 평균을 테스트하여 최적의 변수 조합을 찾습니다. 가중 이동 평균, 이동 평균의 순차적인 평형 등등.
트렌드를 판단하는 지표를 늘리고, 흔들리는 시장에서 포지션을 열지 마십시오. 예를 들어, ADX, 브린 띠 등이 있습니다.
손실을 막는 방법을 최적화하여 손실을 막는 효과를 향상시킵니다. 손실을 추적하는, Chandelier Exit와 같은 손실을 막는 전략을 고려할 수 있습니다.
K선 형태를 판단하는 기계학습 방법을 추가하고, 吞 인식의 정확도를 향상시킨다.
자동 변수 최적화 기능을 추가하여 변수 자조를 구현한다.
요약하다
이 전략은 형태를 판단하는 역전 시기를 삼켜 가격과 이동 평균을 교차하여 역전 방향을 검증한다. 지표 융합을 통해 의사결정 효과를 향상시키는 기술 분석 전략이다. 장점은 지표 상호보완, 매개 변수가 유연하다; 단점은 여전히 가짜 신호 위험이 있으며, 변동 상황에 약하다. 이동 평균 매개 변수를 최적화하고, 손해 중지 방법을 추가하고, 추세 판단 등의 방법을 사용하여 전략 효과를 더욱 강화할 수 있다.
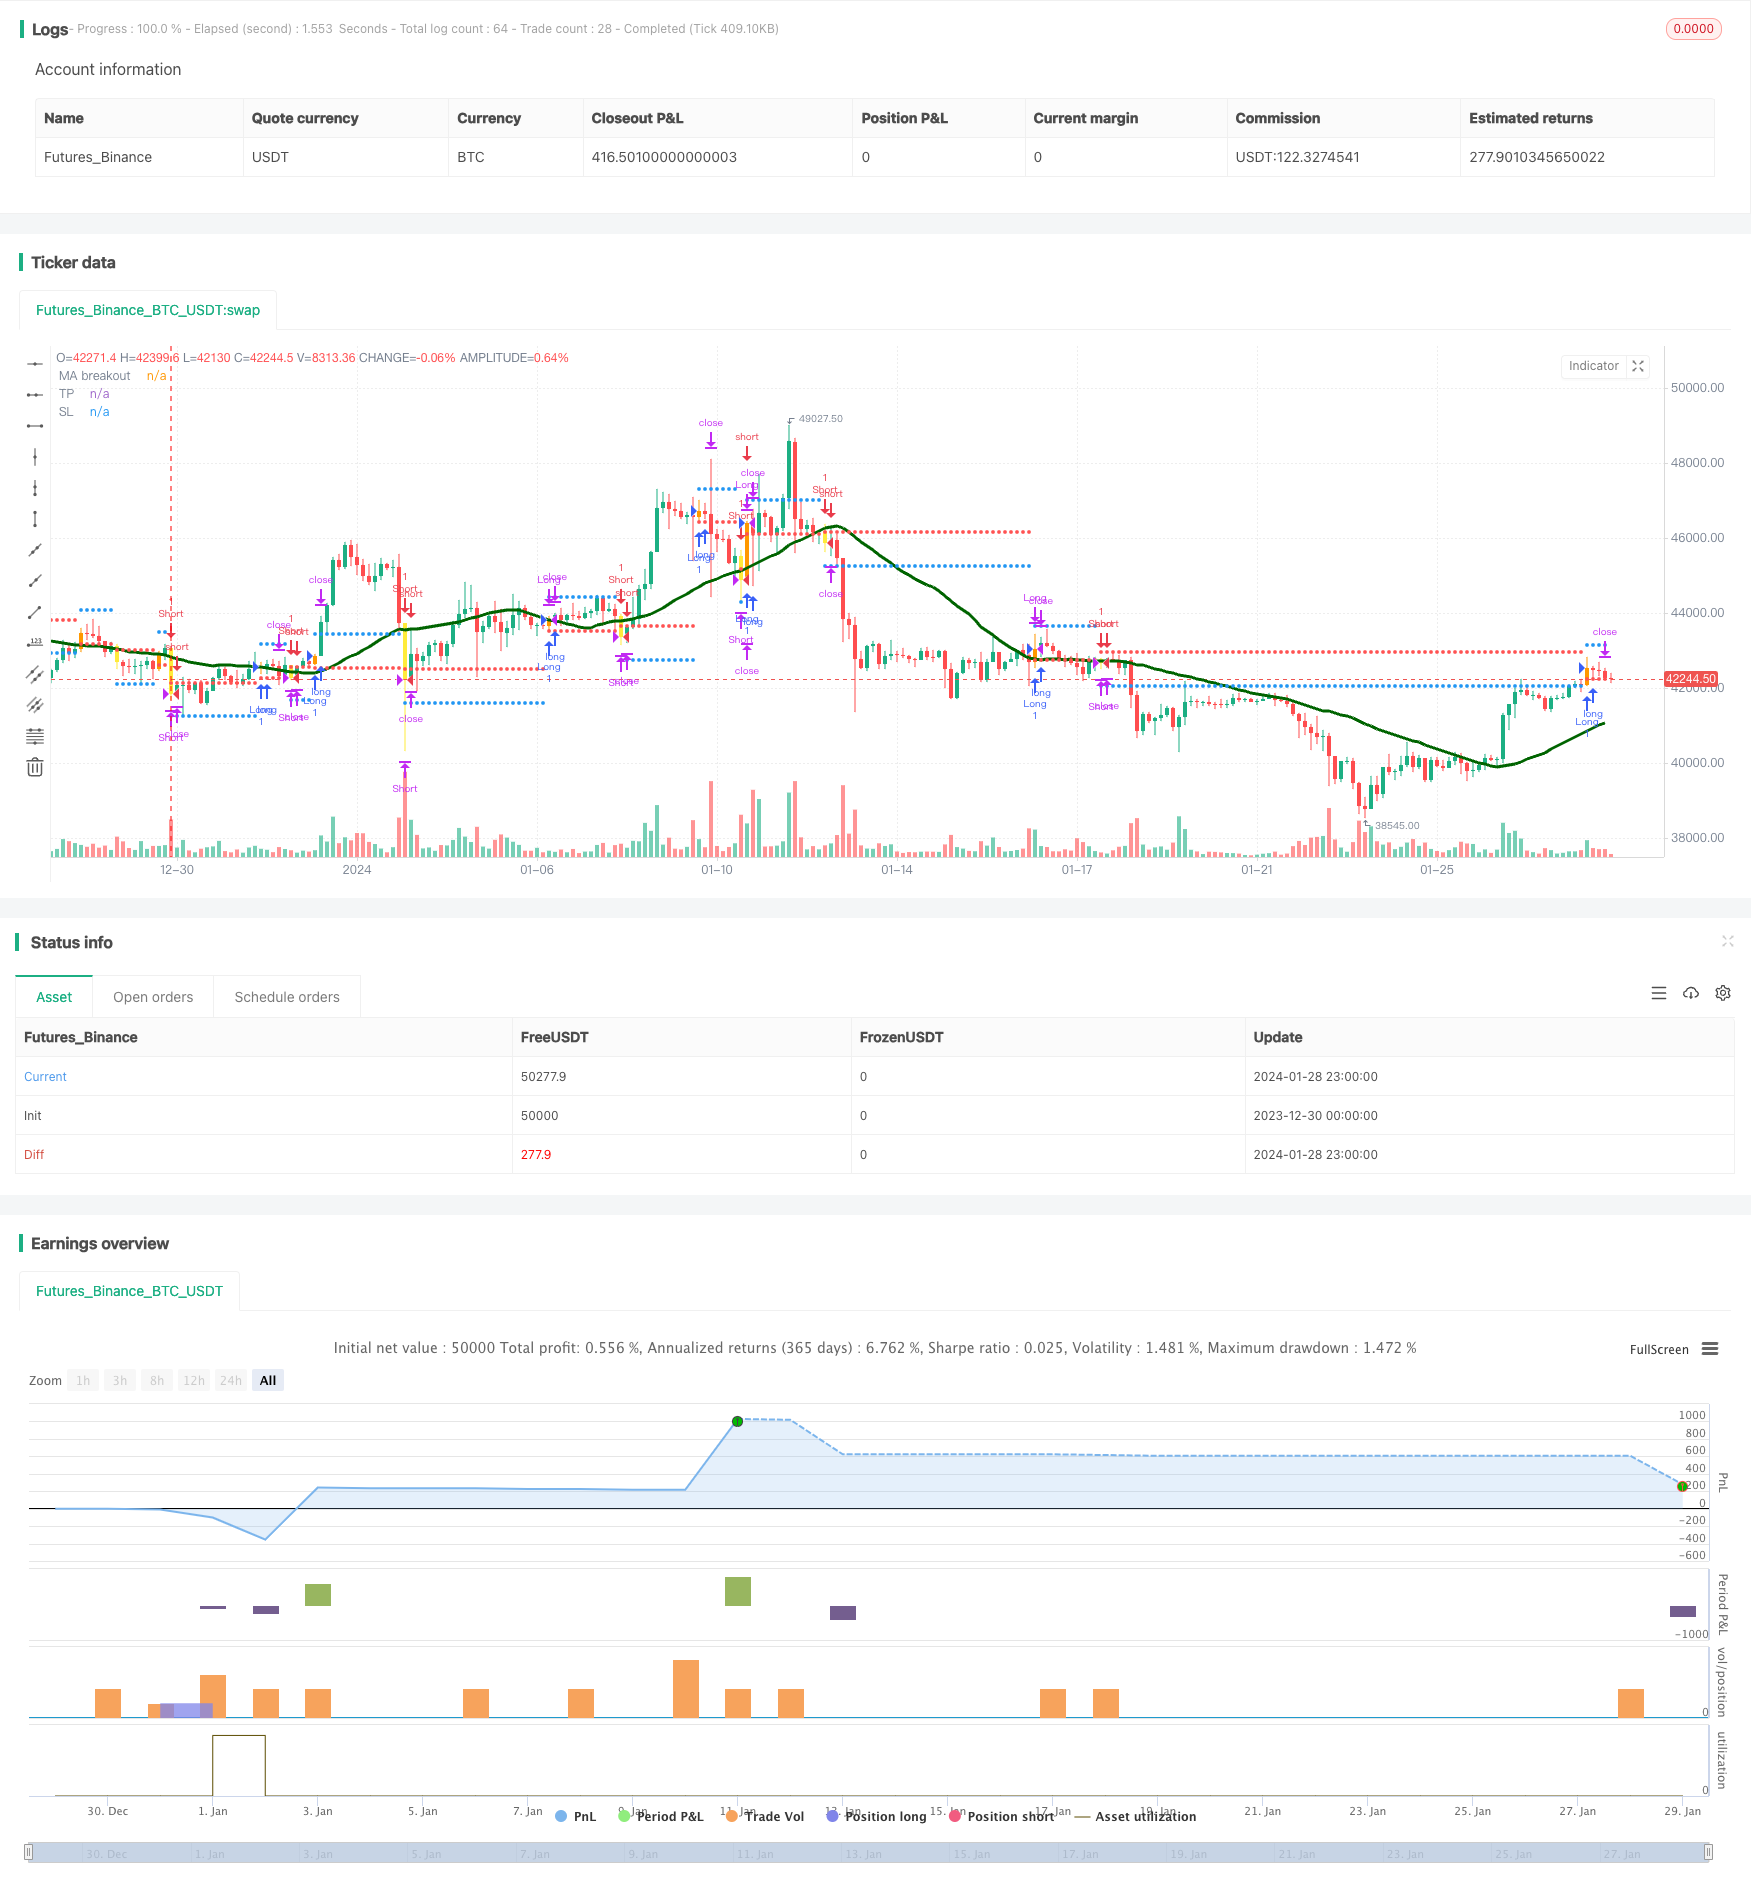
/*backtest
start: 2023-12-30 00:00:00
end: 2024-01-29 00:00:00
period: 3h
basePeriod: 15m
exchanges: [{"eid":"Futures_Binance","currency":"BTC_USDT"}]
*/

//@version=4
//@author=Daveatt

StrategyName = "BEST Engulfing + MA"
ShortStrategyName = "BEST Engulfing + MA"

strategy(title=StrategyName, shorttitle=ShortStrategyName, overlay=true)

includeEngulfing = true

includeMA = true
source_ma = input(title="Source Price vs MA", type=input.source, defval=close)
typeofMA = input(title="Type of MA", defval="SMA", options=["RMA", "SMA", "EMA", "WMA", "VWMA", "SMMA", "KMA", "TMA", "HullMA", "DEMA", "TEMA"])
length_ma = input(32, title = "MA Length", type=input.integer)

// ---------- Candle components and states
GreenCandle = close > open
RedCandle = close < open
NoBody = close==open
Body = abs(close-open)


// bullish conditions
isBullishEngulfing1 = max(close[1],open[1]) < max(close,open) and min(close[1],open[1]) > min(close,open) and Body > Body[1] and GreenCandle and RedCandle[1]
isBullishEngulfing2 = max(close[1],open[1]) < max(close,open) and min(close[1],open[1]) <= min(close,open) and Body > Body[1] and GreenCandle and RedCandle[1]

// bearish conditions
isBearishEngulfing1 = max(close[1],open[1]) < max(close,open) and min(close[1],open[1]) > min(close,open) and Body > Body[1] and RedCandle and GreenCandle[1]
isBearishEngulfing2 = max(close[1],open[1]) >= max(close,open) and min(close[1],open[1]) > min(close,open) and Body > Body[1] and RedCandle and GreenCandle[1]

// consolidation of conditions
isBullishEngulfing = isBullishEngulfing1 or isBullishEngulfing2
isBearishEngulfing = isBearishEngulfing1 or isBearishEngulfing2

//isBullishEngulfing = max(close[1],open[1]) < max(close,open) and min(close[1],open[1]) > min(close,open) and Body > Body[1] and GreenCandle and RedCandle[1]
//isBearishEngulfing = max(close[1],open[1]) < max(close,open) and min(close[1],open[1]) > min(close,open) and Body > Body[1] and RedCandle and GreenCandle[1]

Engulf_curr = 0 - barssince(isBearishEngulfing) + barssince(isBullishEngulfing)
Engulf_Buy = Engulf_curr < 0 ? 1 : 0
Engulf_Sell = Engulf_curr > 0 ? 1 : 0


// Price vs MM


smma(src, len) =>
    smma = 0.0
    smma := na(smma[1]) ? sma(src, len) : (smma[1] * (len - 1) + src) / len
    smma

ma(smoothing, src, length) =>
    if smoothing == "RMA"
        rma(src, length)
    else
        if smoothing == "SMA"
            sma(src, length)
        else
            if smoothing == "EMA"
                ema(src, length)
            else
                if smoothing == "WMA"
                    wma(src, length)
				else
					if smoothing == "VWMA"
						vwma(src, length)
					else
						if smoothing == "SMMA"
						    smma(src, length)
						else
							if smoothing == "HullMA"
								wma(2 * wma(src, length / 2) - wma(src, length), round(sqrt(length)))
							else
								if smoothing == "LSMA"
									src
								else
								    if smoothing == "KMA"
								        xPrice = src
                                        xvnoise = abs(xPrice - xPrice[1])
                                        nfastend = 0.666
                                        nslowend = 0.0645
                                        nsignal = abs(xPrice - xPrice[length])
                                        nnoise = sum(xvnoise, length)
                                        nefratio = iff(nnoise != 0, nsignal / nnoise, 0)
                                        nsmooth = pow(nefratio * (nfastend - nslowend) + nslowend, 2)
                                        nAMA = 0.0
                                        nAMA := nz(nAMA[1]) + nsmooth * (xPrice - nz(nAMA[1]))
                                        nAMA
								    else
								        if smoothing == "TMA"
									        sma(sma(close, length), length)
						                else
							                if smoothing == "DEMA"
							                    2 * src - ema(src, length)
							                else
							                    if smoothing == "TEMA"
							                        3 * (src - ema(src, length)) + ema(ema(src, length), length)
							                    else
		    							            src


MA = ma(typeofMA, source_ma, length_ma)

plot(MA, color=#006400FF, title="MA breakout", linewidth=3)

macrossover  = crossover (source_ma, MA)
macrossunder = crossunder(source_ma, MA)

since_ma_buy = barssince(macrossover)
since_ma_sell = barssince(macrossunder)
macross_curr = 0 - since_ma_sell + since_ma_buy
bullish_MA_cond = macross_curr < 0 ?  1 : 0
bearish_MA_cond = macross_curr > 0 ? 1  : 0

posUp = (Engulf_Buy ? 1 : 0) + (bullish_MA_cond ? 1 : 0)
posDn = (Engulf_Sell ? 1 : 0) + (bearish_MA_cond ? 1 : 0)

conditionUP = posUp == 2 and posUp[1] < 2
conditionDN = posDn == 2 and posDn[1] < 2


sinceUP = barssince(conditionUP)
sinceDN = barssince(conditionDN)

// primary-first signal of the trend
nUP = crossunder(sinceUP,sinceDN)
nDN = crossover(sinceUP,sinceDN)


// and the following secondary signals

// save of the primary signal
sinceNUP = barssince(nUP)
sinceNDN = barssince(nDN)

buy_trend   = sinceNDN > sinceNUP
sell_trend  = sinceNDN < sinceNUP

// engulfing by
barcolor(nUP ? color.orange : na, title="Bullish condition")
barcolor(nDN ? color.yellow : na, title="Bearish condition")

isLong  = nUP
isShort = nDN

long_entry_price    = valuewhen(nUP, close, 0)
short_entry_price   = valuewhen(nDN, close, 0)

longClose   = close[1] < MA
shortClose  = close[1] > MA

///////////////////////////////////////////////
//* Backtesting Period Selector | Component *//
///////////////////////////////////////////////


StartYear = input(2017, "Backtest Start Year",minval=1980)
StartMonth = input(1, "Backtest Start Month",minval=1,maxval=12)
StartDay = input(1, "Backtest Start Day",minval=1,maxval=31)
testPeriodStart = timestamp(StartYear,StartMonth,StartDay,0,0)

StopYear = input(2020, "Backtest Stop Year",minval=1980)
StopMonth = input(12, "Backtest Stop Month",minval=1,maxval=12)
StopDay = input(31, "Backtest Stop Day",minval=1,maxval=31)
testPeriodStop = timestamp(StopYear,StopMonth,StopDay,0,0)

testPeriod() => true


//////////////////////////
//* Profit Component *//
//////////////////////////

input_tp_pips = input(600, "Backtest Profit Goal (in USD)",minval=0)
input_sl_pips = input(300, "Backtest STOP Goal (in USD)",minval=0)


tp = buy_trend? long_entry_price + input_tp_pips : short_entry_price - input_tp_pips
sl = buy_trend? long_entry_price - input_sl_pips : short_entry_price + input_sl_pips


long_TP_exit  = buy_trend and high >= tp
short_TP_exit = sell_trend and low <= tp

plot(tp, title="TP", style=plot.style_circles, linewidth=3, color=color.blue)
plot(sl, title="SL", style=plot.style_circles, linewidth=3, color=color.red)

if testPeriod()
    strategy.entry("Long", 1, when=isLong)
    strategy.close("Long", when=longClose )
    strategy.exit("XL","Long", limit=tp,  when=buy_trend, stop=sl)


if testPeriod()
    strategy.entry("Short", 0,  when=isShort)
    strategy.close("Short", when=shortClose )
    strategy.exit("XS","Short", when=sell_trend, limit=tp, stop=sl)