개요
이 전략은 고전적인 MACD 지표에 기반을 두고 있으며, 동향을 판단하는 지표, 손해 중지 방법, 그리고 정지 방법 등 여러 보조 판단과 결합하여 비교적 완전한 동향 추적 거래 전략을 형성한다. 이 전략은 디지털 통화뿐만 아니라 외환 및 주식 거래에도 사용할 수 있다.
전략 원칙
MACD 지표 판단
- FASTLENGTH 기간 EMA와 SLOWLENGTH 기간 EMA의 차이는 MACD 기둥을 형성한다
- MACDLENGTH기EMA 평평한 MACD 기둥으로 MACD 라인을 형성
- MACD 기둥이 0축을 뚫고 매매 신호를 형성한다
트렌드 판단
- ADX: 평균 트렌드 지표, 트렌드 여부를 판단하는 지표
- MA: 이동 평균, MA 위와 아래로 트렌드하는 가격
- SAR: 패러폴리 SAR, SAR는 가격 상하로 이동하는 판단 경향
손해 방지 방법
- ATR 비율 절감: ATR 인자에 따라 비율 절감 설정
- SAR 중지: 패러블 라인이 출전 후 중지
정지방법
- ATR 고정 스톱 거리: ATR 인자에 따라 고정 스톱 거리를 설정
- 백분율 차단: 백분율 차단 거리를 설정합니다.
시간 손실
- 정해진 항목 수 후에 멈출 수 있습니다.
우위 분석
여러 보조 판단
- 추세와 저항의 판단을 결합하여 잘못된 신호를 줄일 수 있습니다.
- ATR/SAR 손실을 막고, 위험을 더 잘 통제하는 방법
유연한 구성
- 트렌드 필터링을 선택할 수 있습니다
- 선택적으로 ATR 또는 SAR 상쇄
- 선택 가능한 ATR 또는 표준 정지
- 매개 변수는 유연하게 구성됩니다.
리모델링 분석
- 역사에 대한 긍정적인 반향을 보여주는
- 텍스트 힌트를 제공합니다.
편리하고 최적화된 조정
- 정책에 많은 구성 가능한 변수가 내장되어 있습니다.
- 다양한 변수 조합을 편리하게 테스트할 수 있다.
위험 분석
변수가 잘못되면 손실이 커질 수 있습니다.
- ATR, SAR 매개 변수가 잘못 설정되어 조기 중단될 수 있습니다.
- 조 비율이 너무 커서 너무 일찍 조할 수 있습니다.
동향을 판단하는 실패의 위험
- 트렌드 지표 변수가 잘못되면 판단이 잘못될 수 있습니다.
- 트렌드 판단에 영향을 미치는 갑작스러운 사건
시간 단축 위험
- 고정 시간 중지 설정으로 손실 위험이 있습니다.
최적화 방향
- ATR, SAR 파라미터를 조정하여 손해를 더 부드럽게 막습니다.
- 다양한 MA 주기를 테스트하여 트렌드를 최적화합니다.
- 테스트를 통해 정지 비율을 조정하여 수익률을 최적화합니다.
- 변동률 지표 최적화 매개 변수와 결합
요약하다
이 전략 종합은 트렌드 판단, 손해 중지, 회귀 인식 등의 여러 측면을 고려하여 비교적 포괄적인 디지털 통화 거래 전략을 형성한다. MACD 지표의 장점을 결합하여 트렌드 필터링을 증가시키고 잘못된 거래를 방지하고 ATR/SAR 상쇄를 증가시켜 위험을 더 잘 제어하고 회귀 인식은 추가적인 참조를 제공합니다. 다양한 구성 가능한 매개 변수를 사용하여 편리하게 테스트 및 최적화 할 수 있습니다.
전략 소스 코드
/*backtest
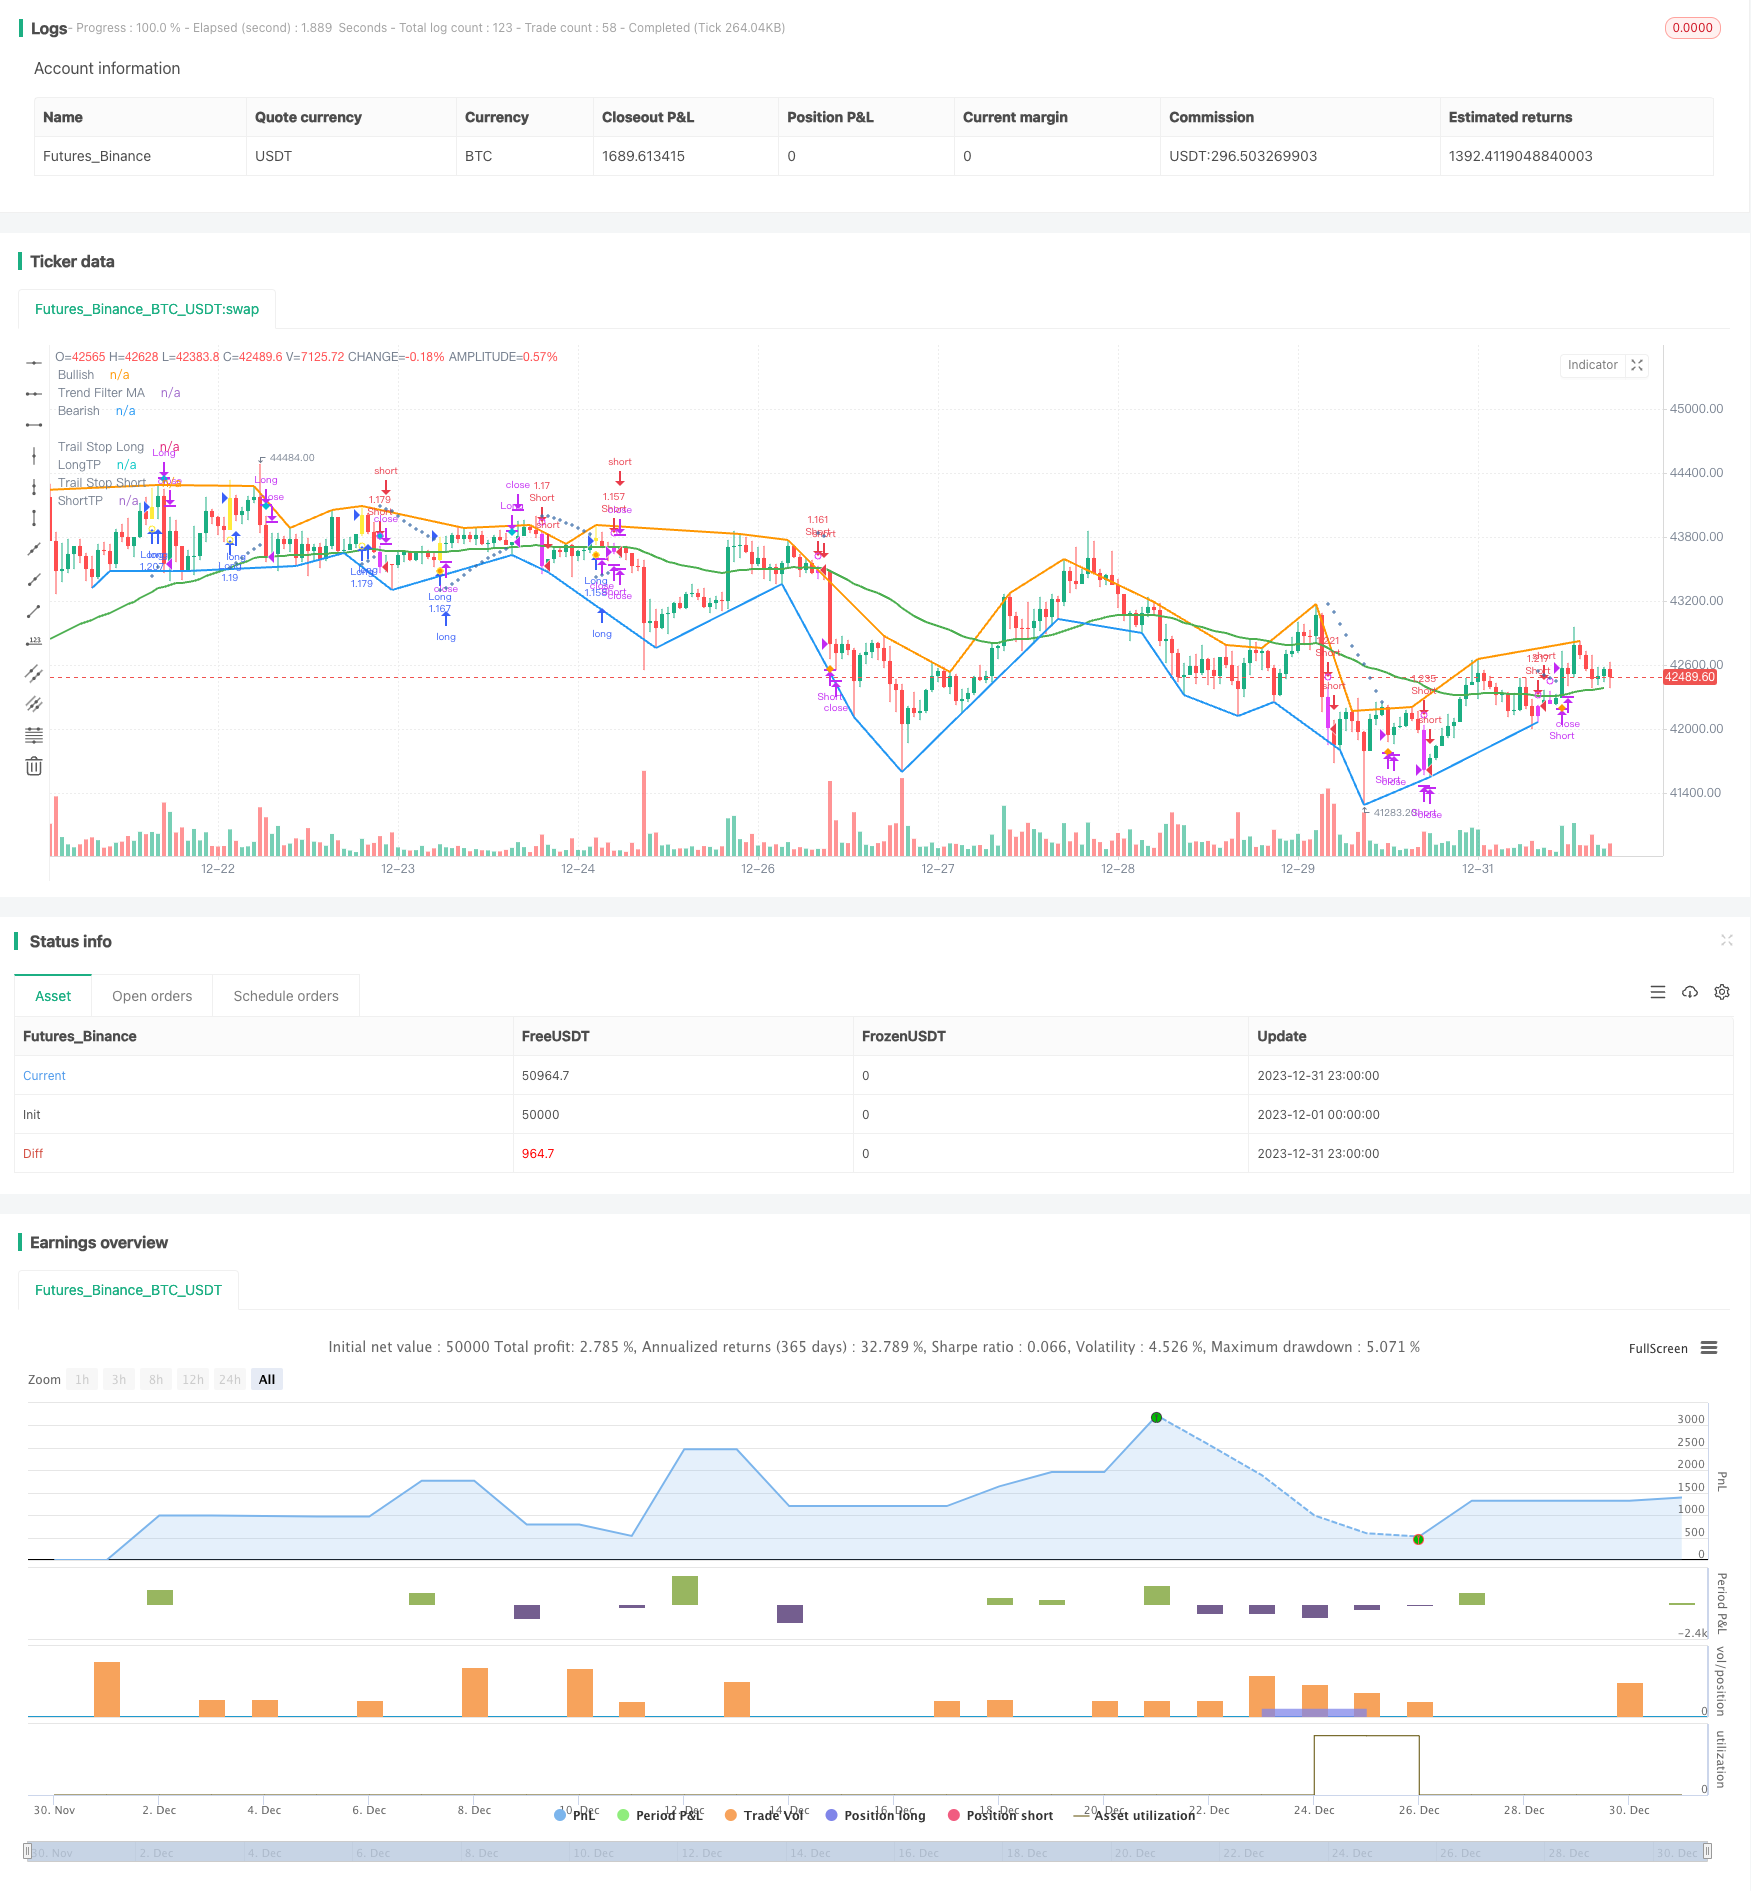
start: 2023-12-01 00:00:00
end: 2023-12-31 23:59:59
period: 1h
basePeriod: 15m
exchanges: [{"eid":"Futures_Binance","currency":"BTC_USDT"}]
*/
// This source code is subject to the terms of the Mozilla Public License 2.0 at https://mozilla.org/MPL/2.0/
// © systemalphatrader
//@version=4
strategy(title="MACD+ Strategy [SystemAlpha]", shorttitle="MACD+ Strategy [SA]", overlay=true, initial_capital=10000, currency='USD',
default_qty_type=strategy.percent_of_equity, default_qty_value=100, commission_type=strategy.commission.percent, commission_value=0.04)
// == MAIN INPUT ==
// TREND FILTER
// Make input option to configure trend filter
trendFilter = input(title="Trend Filter", defval='MA', options=['ADX', 'MA', 'SAR', 'All', 'None'])
// Translate input into trend filters
useADXFilter = (trendFilter == 'ADX') or (trendFilter == 'All')
useSARFilter = (trendFilter == 'SAR') or (trendFilter == 'All')
useMAFilter = (trendFilter == 'MA') or (trendFilter == 'All')
// TRAIL STOP
// Make input option to configure trail stop
trailStop = input(title="Trailing Stop Loss", defval='SAR', options=['ATR', 'SAR', 'None'])
// Translate input
useATRStop = (trailStop == 'ATR')
useSARStop = (trailStop == 'SAR')
// TAKE PROFIT TARGET
// Make input option to configure trail stop
TPtarget = input(title="Take Profit Type", defval='ATR', options=['ATR', 'Percent', 'None'])
// Translate input
useATRTP = (TPtarget == 'ATR')
usePercentTP = (TPtarget == 'Percent')
// ALERTS and BAR COLOR
// Make input option to configure alerts
alerts = input(title="Select Alerts to Display", defval='None', options=['Buy/Sell', 'Exit', 'Both', 'None'])
// Translate input
showsignals = (alerts == 'Buy/Sell') or (alerts == 'Both')
showexitsignals = (alerts == 'Exit') or (alerts == 'Both')
showBarColor = input(true, title="Show Bar Color")
// == /MAIN INPUT ==
/////////////////////////////////////
//*STRATEGY LOGIC *//
/////////////////////////////////////
// == MACD ==
fastLength = input(12, title="Fast Length")
slowlength = input(26, title="Slow Length")
MACDLength = input(9, title="MACD Length")
MACD = ema(close, fastLength) - ema(close, slowlength)
aMACD = ema(MACD, MACDLength)
delta = MACD - aMACD
// Calc breakouts
break_up = crossover(delta, 0)
break_down = crossunder(delta,0)
// == /MACD ==
// == DIVERGENCE ==
method = input(title="Divergence Method", defval='Hist', options=['Hist', 'MACD'])
divtype = input(title="Divergence Type", defval='None', options=['Regular', 'Hidden', 'Both', 'None'])
uReg = divtype == 'Regular' or divtype == 'Both'
uHid = divtype == 'Hidden' or divtype == 'Both'
showlabel = input(true, title="Show Divergence Label")
v_show_last = input(500, "Plotting Lookback Bars Length")
high_src = high
low_src = low
// || Functions:
f_top_fractal(_src) =>
_src[4] < _src[2] and _src[3] < _src[2] and _src[2] > _src[1] and
_src[2] > _src[0]
f_bot_fractal(_src) =>
_src[4] > _src[2] and _src[3] > _src[2] and _src[2] < _src[1] and
_src[2] < _src[0]
f_fractalize(_src) =>
f_bot_fractal__1 = f_bot_fractal(_src)
f_top_fractal(_src) ? 1 : f_bot_fractal__1 ? -1 : 0
// === End of Functions
// || Method selection
oscilator_high = float(na)
oscilator_low = float(na)
if method == 'MACD'
oscilator_high := MACD
oscilator_low := MACD
if method == 'Hist'
oscilator_high := delta
oscilator_low := delta
//
fractal_top = f_fractalize(oscilator_high) > 0 ? oscilator_high[2] : na
fractal_bot = f_fractalize(oscilator_low) < 0 ? oscilator_low[2] : na
high_prev = valuewhen(fractal_top, oscilator_high[2], 0)[2]
high_price = valuewhen(fractal_top, high[2], 0)[2]
low_prev = valuewhen(fractal_bot, oscilator_low[2], 0)[2]
low_price = valuewhen(fractal_bot, low[2], 0)[2]
regular_bearish_div = fractal_top and high[2] > high_price and oscilator_high[2] < high_prev
hidden_bearish_div = fractal_top and high[2] < high_price and oscilator_high[2] > high_prev
regular_bullish_div = fractal_bot and low[2] < low_price and oscilator_low[2] > low_prev
hidden_bullish_div = fractal_bot and low[2] > low_price and oscilator_low[2] < low_prev
// Plotting
plot(title='Bullish', series=fractal_top ? high[2] : na, color = regular_bearish_div and uReg or hidden_bearish_div and uHid ? color.red : na, linewidth = 2, transp=50, offset=-2, show_last = v_show_last)
plot(title='Bearish', series=fractal_bot ? low[2] : na, color = regular_bullish_div and uReg or hidden_bullish_div and uHid ? color.green : na, linewidth = 2, transp=50, offset=-2, show_last = v_show_last)
plotshape(title='Regular Bearish', series=not showlabel or not uReg ? na : regular_bearish_div ? high[2] : na, text='R', style=shape.labeldown, location=location.absolute, color=color.red, textcolor=color.white, transp=50, offset=-2, show_last = v_show_last)
plotshape(title='Hidden Bearish', series=not showlabel or not uHid ? na : hidden_bearish_div ? high[2] : na, text='H', style=shape.labeldown, location=location.absolute, color=color.red, textcolor=color.white, transp=80, offset=-2, show_last = v_show_last)
plotshape(title='Regular Bullish', series=not showlabel or not uReg ? na : regular_bullish_div ? low[2] : na, text='R', style=shape.labelup, location=location.absolute, color=color.green, textcolor=color.white, transp=50, offset=-2, show_last = v_show_last)
plotshape(title='Hidden Bullish', series=not showlabel or not uHid ? na : hidden_bullish_div ? low[2] : na, text='H', style=shape.labelup, location=location.absolute, color=color.green, textcolor=color.white, transp=80, offset=-2, show_last = v_show_last)
// == /DIVERGENCE ==
// == ENTRY ==
// == ADX FILTERING ==
// Look at ADX when it is above a user-defined key level (23 default) and this is to identify when it is trending.
// It then looks at the DMI levels. If D+ is above D- and the ADX is sloping upwards and above the key level, it triggers a buy condition. Opposite for short.
adxlen = 13 //input(13, title="TF ADX Smoothing")
dilen = 13 //input(13, title="TF DI Period")
keyLevel = 23 //input(23, title="TF Keylevel for ADX")
// == USE BUILT-IN DMI FUNCTION TO DETERMINE ADX AND BULL/BEAR STRENGTH
[diplus, diminus, adx] = dmi(dilen, adxlen)
//Buy and Sell Filter
ADXBuyCheck = useADXFilter? diplus > diminus : true
ADXSellCheck = useADXFilter? diplus < diminus : true
// == /ADX FILTERING ==
// == MOVING AVERAGE FILTERING ==
// MA FILTER: Use a user-defined moving average to filter long/short if desried.
maType = input(defval="EMA", options=["EMA", "SMA"], title = "TF MA Type")
maLength = input(defval = 50, title = "TF MA Period", minval = 1)
// Declare function to be able to swap out EMA/SMA
ma(maType, src, length) =>
maType == "EMA" ? ema(src, length) : sma(src, length)
maFilter = ma(maType, close, maLength)
// Check to see if the useMaFilter check box is checked, this then inputs this conditional "maFilterCheck" variable into the strategy entry
maFilterCheck = if useMAFilter == true
maFilter
else
close
// == /MOVING AVERAGE FILTERING ==
// == PARABOLIC SAR AS AN ENTRY and EXIT OPTION ==
// SAR FILTER: The Parabolic SAR (Stop and Reverse) is a time and price technical analysis tool primarily used to identify points of potential stops and reverses.
// Go long when is located below price (BULLISH) and go short when is located above price (BEARISH).
sarStart = 0.04 //input(0.04, "SAR Start")
sarIncrement = 0.02 //input(0.02, "SAR Increment")
sarMaximum = 0.5 //input(0.5, "SAR Max Value")
htclose = close
sarOut = useSARFilter or useSARStop ? sar(sarStart, sarIncrement, sarMaximum) : na
Trend = sarOut < htclose ? 1 : -1
//Buy and Sell Filter
sarBuyCheck = useSARFilter? Trend == 1: true
sarSellCheck = useSARFilter? Trend == -1: true
// Trigger stop based on High/Low
trigResistance = high
trigSupport = low
// Determine if price is above resistance or below support
sarResistanceHit = close >= sarOut and useSARStop == true
sarSupportHit = close <= sarOut and useSARStop == true
// == /PARABOLIC SAR AS AN ENTRY and EXIT OPTION ==
// == EXITS ==
// == ATR TRAILING STOPS ==
// The ATR % stop method can be used by any type of trader because the width of the stop is determined by the percentage of average true range (ATR).
// ATR is a measure of volatility over a specified period of time.
// Exit with ATR support/resistance is hit.
atrLookback = 14 //input(defval=14,title="ATR Lookback Period",type=input.integer)
multiplier = input(defval=2,title="ATR Trailing Stop Multiplier",type=input.float, step=0.1, minval=0.5, maxval=5)
// Calculate the trailing ATR
atrValue = atr(atrLookback)
atrMultiplied = atrValue * multiplier
// Plot the price plus or minus the ATR
atrLow = low - atrMultiplied
atrHigh = high + atrMultiplied
// Calculate both the low and high trailing ATRs every time. The low one never goes down, and the high one never goes up
// Set them to something to start with
trailAtrLow = atrLow
trailAtrHigh = atrHigh
// If the ATR Low has gone up AND it has gone above the trail, the low trailing ATR should also go up. If the ATR Low has gone up or down, but not below the trail, the ATR trail stays where it is
trailAtrLow := na(trailAtrLow[1]) ? trailAtrLow : atrLow >= trailAtrLow[1] ? atrLow : trailAtrLow[1]
// Same for the High
trailAtrHigh := na(trailAtrHigh[1]) ? trailAtrHigh : atrHigh <= trailAtrHigh[1] ? atrHigh : trailAtrHigh[1]
// Determine if price is above resistance or below support
atrResistanceHit = trigResistance >= trailAtrHigh and useATRStop == true
atrSupportHit = trigSupport <= trailAtrLow and useATRStop == true
// If price is above resistance or below support, reset the trailing ATR
trailAtrLow := atrSupportHit ? atrLow : trailAtrLow
trailAtrHigh := atrResistanceHit ? atrHigh : trailAtrHigh
// == /ATR TRAILING STOPS ==
// == INITIAL TP==
// ATR
tpmultiplier = input(defval=3,title="ATR Take Profit Multiplier",type=input.float, step=0.1, minval=0.5, maxval=5)
ema = ema(close, atrLookback)
atr = rma(tr(true), atrLookback)
longATRTP = ema + (atr * tpmultiplier)
shortATRTP = ema - (atr * tpmultiplier)
// Determine if price is above resistance or below support
longATRTPHit = high >= longATRTP and useATRTP == true
shortATRTPHit = low <= shortATRTP and useATRTP == true
// STANDARD TAKE PROFIT %
// User Options to Change Inputs (%)
takePer = input(10, title='Take Profit %', type=input.float, step=0.1, minval=0.5, maxval=100) / 100
//fixed TP prices
longPercentTP = ema * (1 + takePer)
shortPercentTP = ema * (1 - takePer)
// Determine if price is above resistance or below support
longPercentTPHit = high >= longPercentTP and usePercentTP == true
shortPercentTPHit = low <= shortPercentTP and usePercentTP == true
// Set Stop and TP Values
buyStop = trailStop == 'ATR'? trailAtrLow : trailStop == 'SAR'? sarOut : na
sellStop = trailStop == 'ATR'? trailAtrHigh : trailStop == 'SAR'? sarOut : na
longTP = TPtarget == 'ATR'? longATRTP : TPtarget == 'Percent'? longPercentTP : na
shortTP = TPtarget == 'ATR'? shortATRTP : TPtarget == 'Percent'? shortPercentTP : na
// == /EXITS ==
// == PLOTTING ==
buySignal = break_up and ADXBuyCheck and close >= maFilterCheck and sarBuyCheck
shortSignal = break_down and ADXSellCheck and close <= maFilterCheck and sarSellCheck
sellSignal = atrSupportHit or sarSupportHit or longPercentTPHit or longATRTPHit
coverSignal = atrResistanceHit or sarResistanceHit or shortPercentTPHit or shortATRTPHit
//Set BarSince counter
barsSinceLong = 0
barsSinceShort = 0
barsSinceLong := nz(barsSinceLong[1])
barsSinceShort := nz(barsSinceShort[1])
//Plot Sell and Cover Signal
plotshape(not showexitsignals and sellSignal and barsSinceLong == 1? sellSignal : na, title="Sell Long", location=location.abovebar, style=shape.diamond, size=size.auto, color=color.aqua, transp=0, show_last = v_show_last, editable = false)
plotshape(not showexitsignals and coverSignal and barsSinceShort == 1 ? coverSignal : na, title="Cover Short", location=location.belowbar, style=shape.diamond, size=size.auto, color=color.orange, transp=0, show_last = v_show_last, editable = false)
plotshape(showexitsignals and sellSignal and barsSinceLong == 1? sellSignal : na, title="Close Long Text", location=location.abovebar, style=shape.diamond, size=size.auto, color=color.aqua, transp=0, show_last = v_show_last, textcolor=color.aqua, text = "Close\nLong", editable = false)
plotshape(showexitsignals and coverSignal and barsSinceShort == 1 ? coverSignal : na, title="Cover Short Text", location=location.belowbar, style=shape.diamond, size=size.auto, color=color.orange, transp=0, show_last = v_show_last, textcolor=color.orange, text = "Cover\nShort", editable = false)
// Reset BarSince counter
if buySignal
barsSinceLong := 1
barsSinceShort := 0
if shortSignal
barsSinceShort := 1
barsSinceLong := 0
if sellSignal
barsSinceLong := 0
if coverSignal
barsSinceShort := 0
// Show bar color
barcolor(showBarColor? (buySignal or shortSignal ? (shortSignal ? color.fuchsia : color.yellow) : na) : na)
// Plot Buy Alerts
plotshape(buySignal ? buySignal : na, title="Breakout Up", location=location.belowbar, style=shape.circle, size=size.auto, color=color.yellow, transp=0, editable = false)
plotshape(showsignals and buySignal, title= "Long", color=color.green, style=shape.labelup, location=location.belowbar, size=size.auto, show_last = v_show_last, text = "BUY", textcolor=color.white, editable = false)
// Plot Sell Alerts
plotshape(shortSignal ? shortSignal : na, title="Breakout Down", location=location.abovebar, style=shape.circle, size=size.auto, color=color.fuchsia, transp=0, editable = false)
plotshape(showsignals and shortSignal, title= "Short", color=color.red, style=shape.labeldown, location=location.abovebar, size=size.auto, show_last = v_show_last, text = "SELL", textcolor=color.white, editable = false)
// Plot MA Trend Filter
plot(useMAFilter? maFilter : na, title = "Trend Filter MA", color = color.green, linewidth = 2, style = plot.style_line, transp = 20, editable = true)
// Plot Initial Stop
plot(trailStop != 'None' and barsSinceLong >= 1? buyStop : na, color=#3A6CA8, title="Trail Stop Long", style = plot.style_cross, linewidth = 1, transp = 20, editable = true)
plot(trailStop != 'None' and barsSinceShort >= 1? sellStop : na, color=#3A6CA8, title="Trail Stop Short", style = plot.style_cross, linewidth = 1, transp = 20, editable = true)
// Plot Initial Target Profit
plot(TPtarget != 'None' and buySignal? longTP : na, color=color.green, title="LongTP", style = plot.style_linebr, linewidth = 1, editable = false)
plot(TPtarget != 'None' and shortSignal? shortTP : na, color=color.green, title="ShortTP", style = plot.style_linebr, linewidth = 1, editable = false)
// == /PLOTTING ==
// == ALERTS ==
// Buy and Sell Signal
alertcondition(buySignal, title='MACD Long', message='MACD {{exchange}}:{{ticker}} TF: {{interval}}. LONG (TRADE). ENTRY: {{close}}, Target Profit: {{plot("LongTP")}}, STOP LOSS: {{plot("Trail Stop Long")}}')
alertcondition(shortSignal, title='MACD Short', message='MACD {{exchange}}:{{ticker}} TF: {{interval}}. SHORT (TRADE). ENTRY: {{close}}, Target Profit: {{plot("ShortTP")}}, STOP LOSS: {{plot("Trail Stop Short")}}')
alertcondition(sellSignal, title='MACD Close Long', message='MACD {{exchange}}:{{ticker}} Close Long, Price = {{close}}')
alertcondition(coverSignal, title='MACD Cover Short', message='MACD {{exchange}}:{{ticker}} Cover Short, Price = {{close}}')
alertcondition(sellSignal or coverSignal, title="MACD Close Orders", message="{{ticker}} Close Orders")
// Initial SL and TP Hit
stophit = low <= buyStop or high >= sellStop
tphit = low <= shortTP or high >= longTP
alertcondition(stophit, title='MACD SL Hit', message='MACD {{exchange}}:{{ticker}} Stop Loss Hit, Price = {{close}}')
alertcondition(tphit, title='MACD TP Hit', message='MACD {{exchange}}:{{ticker}} Target Profit Hit, Price = {{close}}')
//Divergence Alerts
alertcondition(regular_bullish_div, title='MACD Bullish Divergence', message='MACD Regular Bullish Divergence')
alertcondition(regular_bearish_div, title='MACD Bearish Divergence', message='MACD Regular Bearish Divergence')
alertcondition(hidden_bullish_div, title='MACD Hidden Bullish Divergence', message='MACD Hidden Bullish Divergence')
alertcondition(hidden_bearish_div, title='MACD Hidden Bearish Divergence', message='MACD Hidden Bearish Divergence')
// == /ALERTS ==
//////////////////////////
//* STRATEGY COMPONENT *//
//////////////////////////
// === BACKTEST RANGE ===
From_Year = input(defval = 2017, title = "BACKTEST: From Year")
From_Month = input(defval = 1, title = "BACKTEST: From Month", minval = 1, maxval = 12)
From_Day = input(defval = 1, title = "BACKTEST: From Day", minval = 1, maxval = 31)
To_Year = input(defval = 9999, title = "BACKTEST: To Year")
To_Month = input(defval = 1, title = "BACKTEST: To Month", minval = 1, maxval = 12)
To_Day = input(defval = 1, title = "BACKTEST: To Day", minval = 1, maxval = 31)
Start = timestamp(From_Year, From_Month, From_Day, 00, 00) // backtest start window
Finish = timestamp(To_Year, To_Month, To_Day, 23, 59) // backtest finish window
testPeriod() => true
// === /BACKTEST RANGE ===
// === STRATEGY ===
// Make input option to configure trade direction
tradeDirection = input(title="Trade Direction", defval="Both", options=["Long", "Short", "Both"])
// Translate input into trading conditions
longOK = (tradeDirection == "Long") or (tradeDirection == "Both")
shortOK = (tradeDirection == "Short") or (tradeDirection == "Both")
// == STRATEGY ENTRIES/EXITS ==
timedExit = input(title = "Use Timed Exit", type = input.bool, defval = true)
exitmethod = input(title="Timed Exit Method", defval='3', options=['1', '2', '3'])
bse = input(10, "Bar Since Entry") // Bars to exit after entry
barsSinceEntry = 0
barsSinceEntry := nz(barsSinceEntry[1]) + 1
longCondition = longOK and buySignal and testPeriod()
shortcondition = shortOK and shortSignal and testPeriod()
if strategy.position_size == 0
barsSinceEntry := 0
// === STRATEGY - LONG POSITION EXECUTION ===
if longCondition
strategy.entry("Long", strategy.long)
barsSinceEntry := 0
// === STRATEGY - SHORT POSITION EXECUTION ===
if shortcondition
strategy.entry("Short", strategy.short)
barsSinceEntry := 0
// == STRATEGY EXITS ==
if sellSignal
strategy.close("Long")
barsSinceEntry := 0
if coverSignal
strategy.close("Short")
barsSinceEntry := 0
// Enable Timed Exit
// Exit after specified number of bars.
if timedExit and exitmethod == '1' and barsSinceEntry > bse
strategy.close_all()
barsSinceEntry := 0
// Exit after specified number of bars, ONLY if position is currently profitable.
if timedExit and exitmethod == '2' and strategy.openprofit > 0 and barsSinceEntry > bse
strategy.close_all()
barsSinceEntry := 0
// Exit after specified number of bars, ONLY if position is currently losing.
if timedExit and exitmethod == '3' and strategy.openprofit < 0 and barsSinceEntry > bse
strategy.close_all()
barsSinceEntry := 0
// === /STRATEGY ===
//EOF