
이 전략의 주요 아이디어는 더 큰 시간 프레임에서 트렌드 방향을 식별하고 더 작은 시간 프레임에서 브레이크 포인트 입장을 찾는 것이며, 스톱 로즈 출구는 더 큰 시간 프레임에서 이동 평균을 추적하는 것입니다.
이 전략은 크게 세 가지 지표에 근거하여 판단됩니다.
첫째, 더 긴 주기 (일선과 같은) 의 X일간 간단한 이동 평균을 계산하여, 가격 스테이션에 이동 평균이 있을 때만 구매를 허용한다. 이것은 전반적인 경향 방향을 판단하여 거래의 흔들림 기간을 피하기 위해 사용될 수 있다.
둘째, 짧은 기간 (예를 들어 5일) 의 최고 가격인 스윙 하이를 계산하고, 가격이 그 최고 가격을 돌파했을 때 구매 신호를 유발한다. 여기서 회귀 주기 변수 lb와 결합하여 적절한 돌파점을 찾는다.
셋째, 스톱 라인을 설정한다. 입상 후, 스톱 라인은 가장 가까운 최저점으로부터 일정한 주기 lbStop의 최저 가격에 잠겨있다. 또한 이동 평균을 설정한다 (일계 10일 EMA와 같은) 출구 메커니즘으로, 가격이 이동 평균보다 낮을 때 입장을 종료한다.
이 전략은 동시에 ATR 값을 설정하여 과장된 점수를 구입하는 것을 방지합니다. 또한 재검토 시간 범위와 같은 다른 보조 조건이 있습니다.
이 세 가지 지표의 상호 작용은 이 전략의 핵심 논리를 형성한다.
이 전략은 다음과 같은 장점을 가지고 있습니다.
두 개의 시간 프레임을 사용해서 흔들리는 시장의 가짜 돌파구를 피하십시오. 더 긴 시간 프레임은 전반적인 추세를 판단하고, 더 짧은 시간 프레임은 특정 진입 지점을 찾습니다.
스윙 하이 (swing high) 를 이용한 돌파구가 형성되는데, 이러한 돌파구는 일정하게 관성적이며 쉽게 추적이 형성된다. 또한, 회기 lb 파라미터를 다시 살펴보면 실제로 효과적인 돌파구를 찾기 위해 조정할 수 있다.
손해 차단 방식은 엄격하고, 최근 하위점을 추적하고, 일정 거리를 남겨두고, 주식 시장에 부딪히지 않도록 한다.
이동 평균을 출구 메커니즘으로 사용하여 상황에 따라 유연하게 중지 할 수 있습니다.
ATR 지표는 과도한 방출으로 인한 위험을 피합니다.
다양한 파라미터 조합을 설정하여 효과를 테스트할 수 있으며, 최적화할 수 있는 공간이 넓다.
이 전략에는 위험도 있습니다.
가격이 이동 평균 근처에서 오르락 내리락 할 때, 반복적으로 입출력으로 전환될 수 있다. 이 때 더 높은 수수료의 위험에 직면한다.
구매 지점을 이동 평균에 가까이 돌파할 때, 상대적으로 큰 철회 위험이 있습니다. 이것은 전략 자체의 특징입니다.
시장이 명확한 경향을 보이지 않을 때, 포지션 보유 기간이 너무 길어질 수 있으며, 시간 위험에 직면할 수 있다.
ATR 파라미터를 합리적으로 설정해야 한다. ATR이 너무 작으면 필터링 효과가 약하고, 너무 크면 입학 기회가 줄어들다.
다른 lb 파라미터의 결과에 대한 영향을 테스트해야 한다. 너무 큰 파라미터는 일부 기회를 놓칠 수 있고, 너무 작은 파라미터는 가짜 돌파구를 식별할 수 있다.
위험 해결 방법:
이 전략은 다음과 같은 차원에서 최적화될 수 있습니다.
다른 이동 평균 변수 조합을 테스트하여 최적의 변수를 찾습니다.
다른 ATR 변수 설정을 시도하여 입시 기회와 위험 관리를 균형 잡으십시오.
더 효율적인 돌파구를 식별하기 위해 주기 lb 파라미터를 최적화하십시오.
동적 스톱을 설정하고, 변동과 철수율에 따라 위험을 조절합니다.
거래량 지표와 같은 다른 요소들과 함께 돌파구의 유효성을 판단한다.
</‘,</,>< 등의 극한점을 참조로 찾는 방법을 개발한다.
최적의 변수를 얻기 위해 Machine Learning을 사용하세요.
이 전략은 전체적으로 전형적인 돌파구 추적 전략이다. 이중 시간 프레임 판단, 스윙 하이 입점 시점, 스톱 라인 및 이동 평균 이중 보험 퇴출 메커니즘을 식별하여 전체 논리 시스템을 형성한다. 이 전략의 위험과 수익 특성은 명확하고 중장기 추적 유형 투자자에게 적합하다.
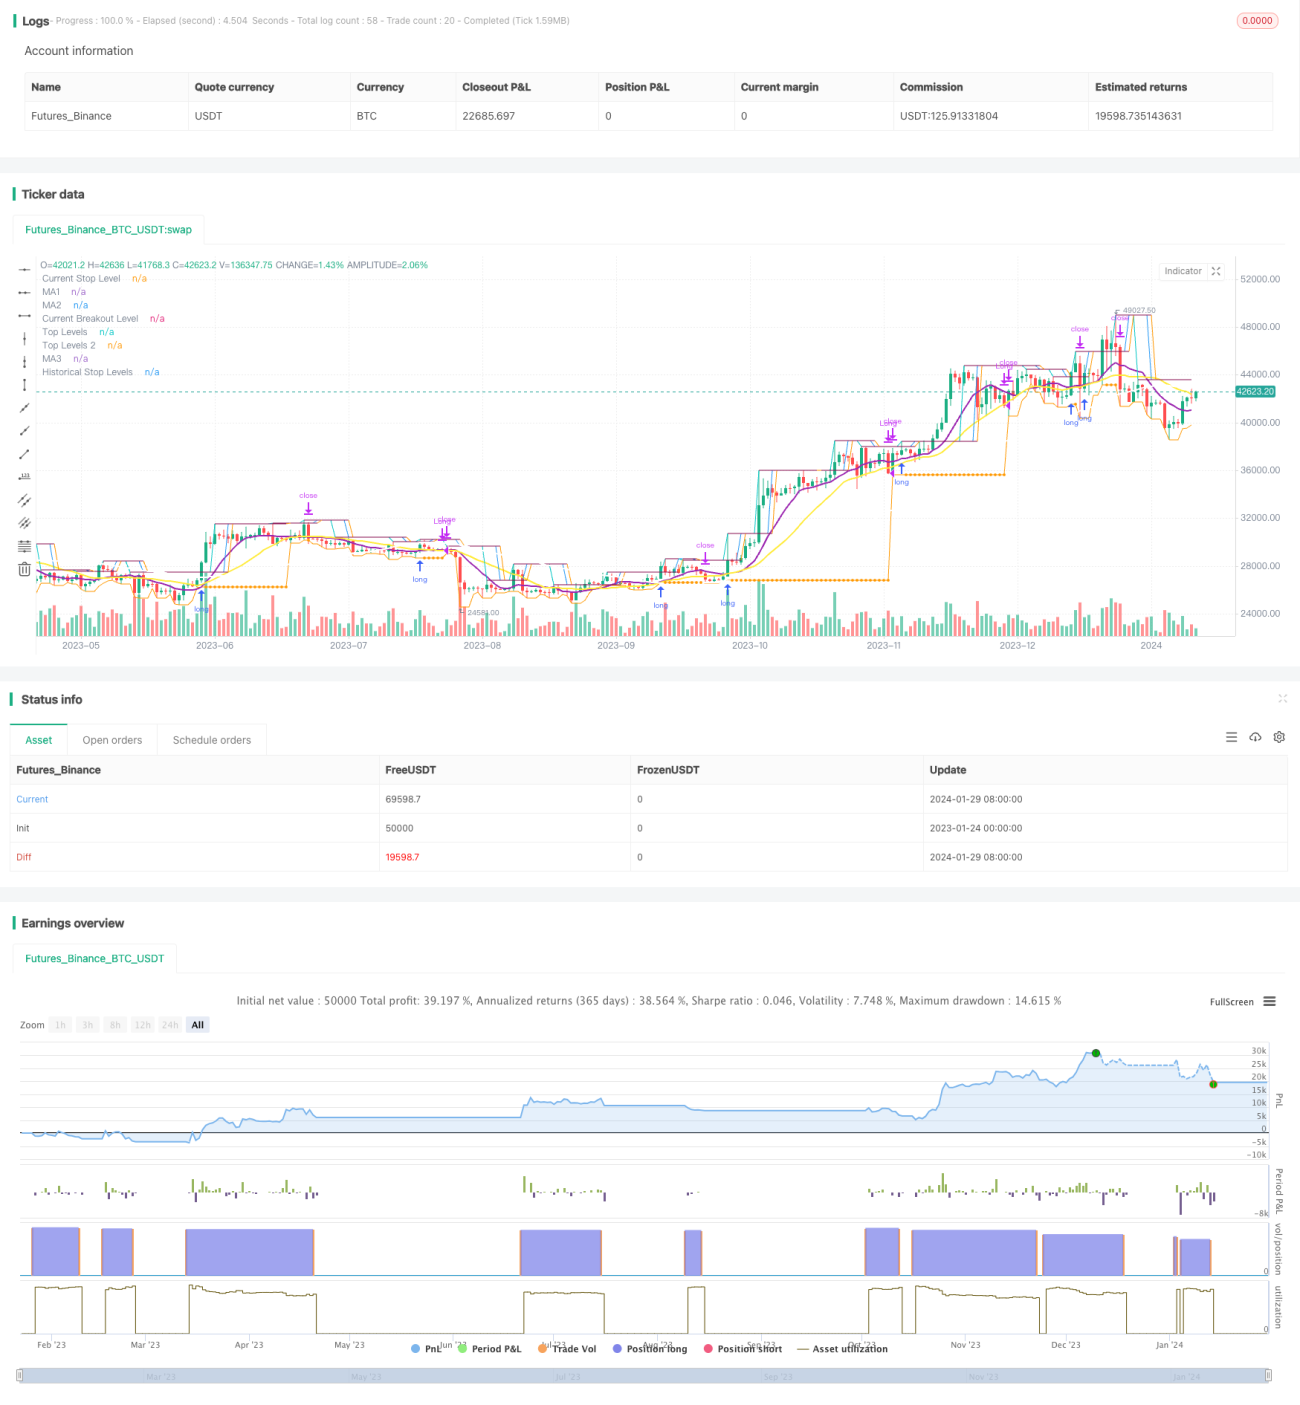
/*backtest
start: 2023-01-24 00:00:00
end: 2024-01-30 00:00:00
period: 1d
basePeriod: 1h
exchanges: [{"eid":"Futures_Binance","currency":"BTC_USDT"}]
*/
// This source code is subject to the terms of the Mozilla Public License 2.0 at https://mozilla.org/MPL/2.0/
// © millerrh
// The intent of this strategy is to buy breakouts with a tight stop on smaller timeframes in the direction of the longer term trend.
// Then use a trailing stop of a close below either the 10 MA or 20 MA (user choice) on that larger timeframe as the position
// moves in your favor (i.e. whenever position price rises above the MA).
// Option of using daily ATR as a measure of finding contracting ranges and ensuring a decent risk/reward.
// (If the difference between the breakout point and your stop level is below a certain % of ATR, it could possibly find those consolidating periods.)
//@version=4
strategy("Qullamaggie Breakout", overlay=true, initial_capital=10000, currency='USD',
default_qty_type=strategy.percent_of_equity, default_qty_value=100, commission_type=strategy.commission.percent, commission_value=0.1)
// === BACKTEST RANGE ===
Start = input(defval = timestamp("01 Jan 2019 06:00 +0000"), title = "Backtest Start Date", type = input.time)
Finish = input(defval = timestamp("01 Jan 2100 00:00 +0000"), title = "Backtest End Date", type = input.time)
// Inputs
lb = input(defval = 3, title = "Lookback Period for Swing High", minval = 1,
tooltip = "Lookback period for defining the breakout level.")
lbStop = input(defval = 3, title = "Lookback Bars for Stop Level", minval = 1,
tooltip = "Initial stop placement is the lowest low this many bars back. Allows for tighter stop placement than referencing swing lows.")
htf = input(defval="D", title="Timeframe of Moving Averages", type=input.resolution,
tooltip = "Allows you to set a different time frame for the moving averages. The default behavior is to identify good tightening setups on a larger timeframe
(like daily) and enter the trade on a breakout occuring on a smaller timeframe, using the moving averages of the larger timeframe to trail your stop.")
maType = input(defval="SMA", options=["EMA", "SMA"], title = "Moving Average Type")
ma1Length = input(defval = 10, title = "1st Moving Average Length", minval = 1)
ma2Length = input(defval = 20, title = "2nd Moving Average Length", minval = 1)
ma3Length = input(defval = 50, title = "3rd Moving Average Length", minval = 1)
useMaFilter = input(title = "Use 3rd Moving Average for Filtering?", type = input.bool, defval = true,
tooltip = "Signals will be ignored when price is under this slowest moving average. The intent is to keep you out of bear periods and only
buying when price is showing strength or trading with the longer term trend.")
trailMaInput = input(defval="2nd Moving Average", options=["1st Moving Average", "2nd Moving Average"], title = "Trailing Stop")
// MA Calculations
ma(maType, src, length) =>
maType == "EMA" ? ema(src, length) : sma(src, length) //Ternary Operator (if maType equals EMA, then do ema calc, else do sma calc)
ma1 = security(syminfo.tickerid, htf, ma(maType, close, ma1Length))
ma2 = security(syminfo.tickerid, htf, ma(maType, close, ma2Length))
ma3 = security(syminfo.tickerid, htf, ma(maType, close, ma3Length))
plot(ma1, color=color.purple, style=plot.style_line, title="MA1", linewidth=2, transp = 60)
plot(ma2, color=color.yellow, style=plot.style_line, title="MA2", linewidth=2, transp = 60)
plot(ma3, color=color.white, style=plot.style_line, title="MA3", linewidth=2, transp = 60)
// === USE ATR FOR FILTERING ===
// The idea here is that you want to buy in a consolodating range for best risk/reward. So here you can compare the current distance between
// support/resistance vs.the ATR and make sure you aren't buying at a point that is too extended from normal.
useAtrFilter = input(title = "Use ATR for Filtering?", type = input.bool, defval = false,
tooltip = "Signals will be ignored if the distance between support and resistance is larger than a user-defined percentage of Daily ATR.
This allows the user to ensure they are not buying something that is too extended and instead focus on names that are consolidating more.")
atrPerc = input(defval = 100, title = "% of Daily ATR Value", minval = 1)
atrValue = security(syminfo.tickerid, "D", atr(14))*atrPerc*.01
// === PLOT SWING HIGH/LOW AND MOST RECENT LOW TO USE AS STOP LOSS EXIT POINT ===
// Change these values to adjust the look back and look forward periods for your swing high/low calculations
pvtLenL = lb
pvtLenR = lb
// Get High and Low Pivot Points
pvthi_ = pivothigh(high, pvtLenL, pvtLenR)
pvtlo_ = pivotlow(low, pvtLenL, pvtLenR)
// Force Pivot completion before plotting.
Shunt = 1 //Wait for close before printing pivot? 1 for true 0 for flase
maxLvlLen = 0 //Maximum Extension Length
pvthi = pvthi_[Shunt]
pvtlo = pvtlo_[Shunt]
// Count How many candles for current Pivot Level, If new reset.
counthi = barssince(not na(pvthi))
countlo = barssince(not na(pvtlo))
pvthis = fixnan(pvthi)
pvtlos = fixnan(pvtlo)
hipc = change(pvthis) != 0 ? na : color.maroon
lopc = change(pvtlos) != 0 ? na : color.green
// Display Pivot lines
plot((maxLvlLen == 0 or counthi < maxLvlLen) ? pvthis : na, color=hipc, transp=0, linewidth=1, offset=-pvtLenR-Shunt, title="Top Levels")
// plot((maxLvlLen == 0 or countlo < maxLvlLen) ? pvtlos : na, color=lopc, transp=0, linewidth=1, offset=-pvtLenR-Shunt, title="Bottom Levels")
plot((maxLvlLen == 0 or counthi < maxLvlLen) ? pvthis : na, color=hipc, transp=0, linewidth=1, offset=0, title="Top Levels 2")
// plot((maxLvlLen == 0 or countlo < maxLvlLen) ? pvtlos : na, color=lopc, transp=0, linewidth=1, offset=0, title="Bottom Levels 2")
// BUY CONDITIONS
stopLevelCalc = valuewhen(pvtlo_, low[pvtLenR], 0) //Stop Level at Swing Low
buyLevel = valuewhen(pvthi_, high[pvtLenR], 0) //Buy level at Swing High
plot(buyLevel, style=plot.style_line, color=color.blue, title = "Current Breakout Level", show_last=1, linewidth=1, transp=50, trackprice=true)
// Conditions for entry and exit
stopLevel = float(na) // Define stop level here as "na" so that I can reference it in the inPosition
// variable and the ATR calculation before the stopLevel is actually defined.
buyConditions = (useMaFilter ? buyLevel > ma3 : true) and
(useAtrFilter ? (buyLevel - stopLevel[1]) < atrValue : true)
// buySignal = high > buyLevel and buyConditions
buySignal = crossover(high, buyLevel) and buyConditions
trailMa = trailMaInput == "1st Moving Average" ? ma1 : ma2
sellSignal = crossunder(close, trailMa)
// sellSignal = security(syminfo.tickerid, htf, close < trailMa) and security(syminfo.tickerid, htf, close[1] < trailMa)
// STOP AND PRICE LEVELS
inPosition = bool(na)
inPosition := buySignal[1] ? true : sellSignal[1] ? false : low <= stopLevel[1] ? false : inPosition[1]
lowDefine = lowest(low, lbStop)
stopLevel := inPosition ? stopLevel[1] : lowDefine
// plot(stopLevel)
buyPrice = buyLevel
buyPrice := inPosition ? buyPrice[1] : buyLevel
plot(stopLevel, style=plot.style_line, color=color.orange, title = "Current Stop Level", show_last=1, linewidth=1, transp=50, trackprice=true)
plot(inPosition ? stopLevel : na, style=plot.style_circles, color=color.orange, title = "Historical Stop Levels", transp=50, trackprice=false)
// plot(buyPrice, style=plot.style_line, color=color.blue, linewidth=1, transp=50, trackprice=true)
// (STRATEGY ONLY) Comment out for Study
strategy.entry("Long", strategy.long, stop = buyLevel, when = buyConditions)
strategy.exit("Exit Long", from_entry = "Long", stop=stopLevel[1])
if (low[1] > trailMa)
strategy.close("Long", when = sellSignal)
// if (low[1] > trailMa)
// strategy.exit("Exit Long", from_entry = "Long", stop=trailMa) //to get this to work right, I need to reference highest highs instead of swing highs
//because it can have me buy right back in after selling if the stop level is above the last registered swing high point.