개요
이중 ATR 추적 중지 전략은 평균 실제 파장 ((ATR) 지표에 기반한 단선 거래 전략이다. 이 전략은 동시에 빠른 ATR 라인과 느린 ATR 라인을 두 개의 중지 라인을 설정하고, 두 개의 중지 라인의 교차 상황에 따라 입문과 출구를 판단한다. 전략은 간단하고 이해하기 쉽고, 반응이 빠르게, 높은 변동성 시장에 적합하다.
전략 원칙
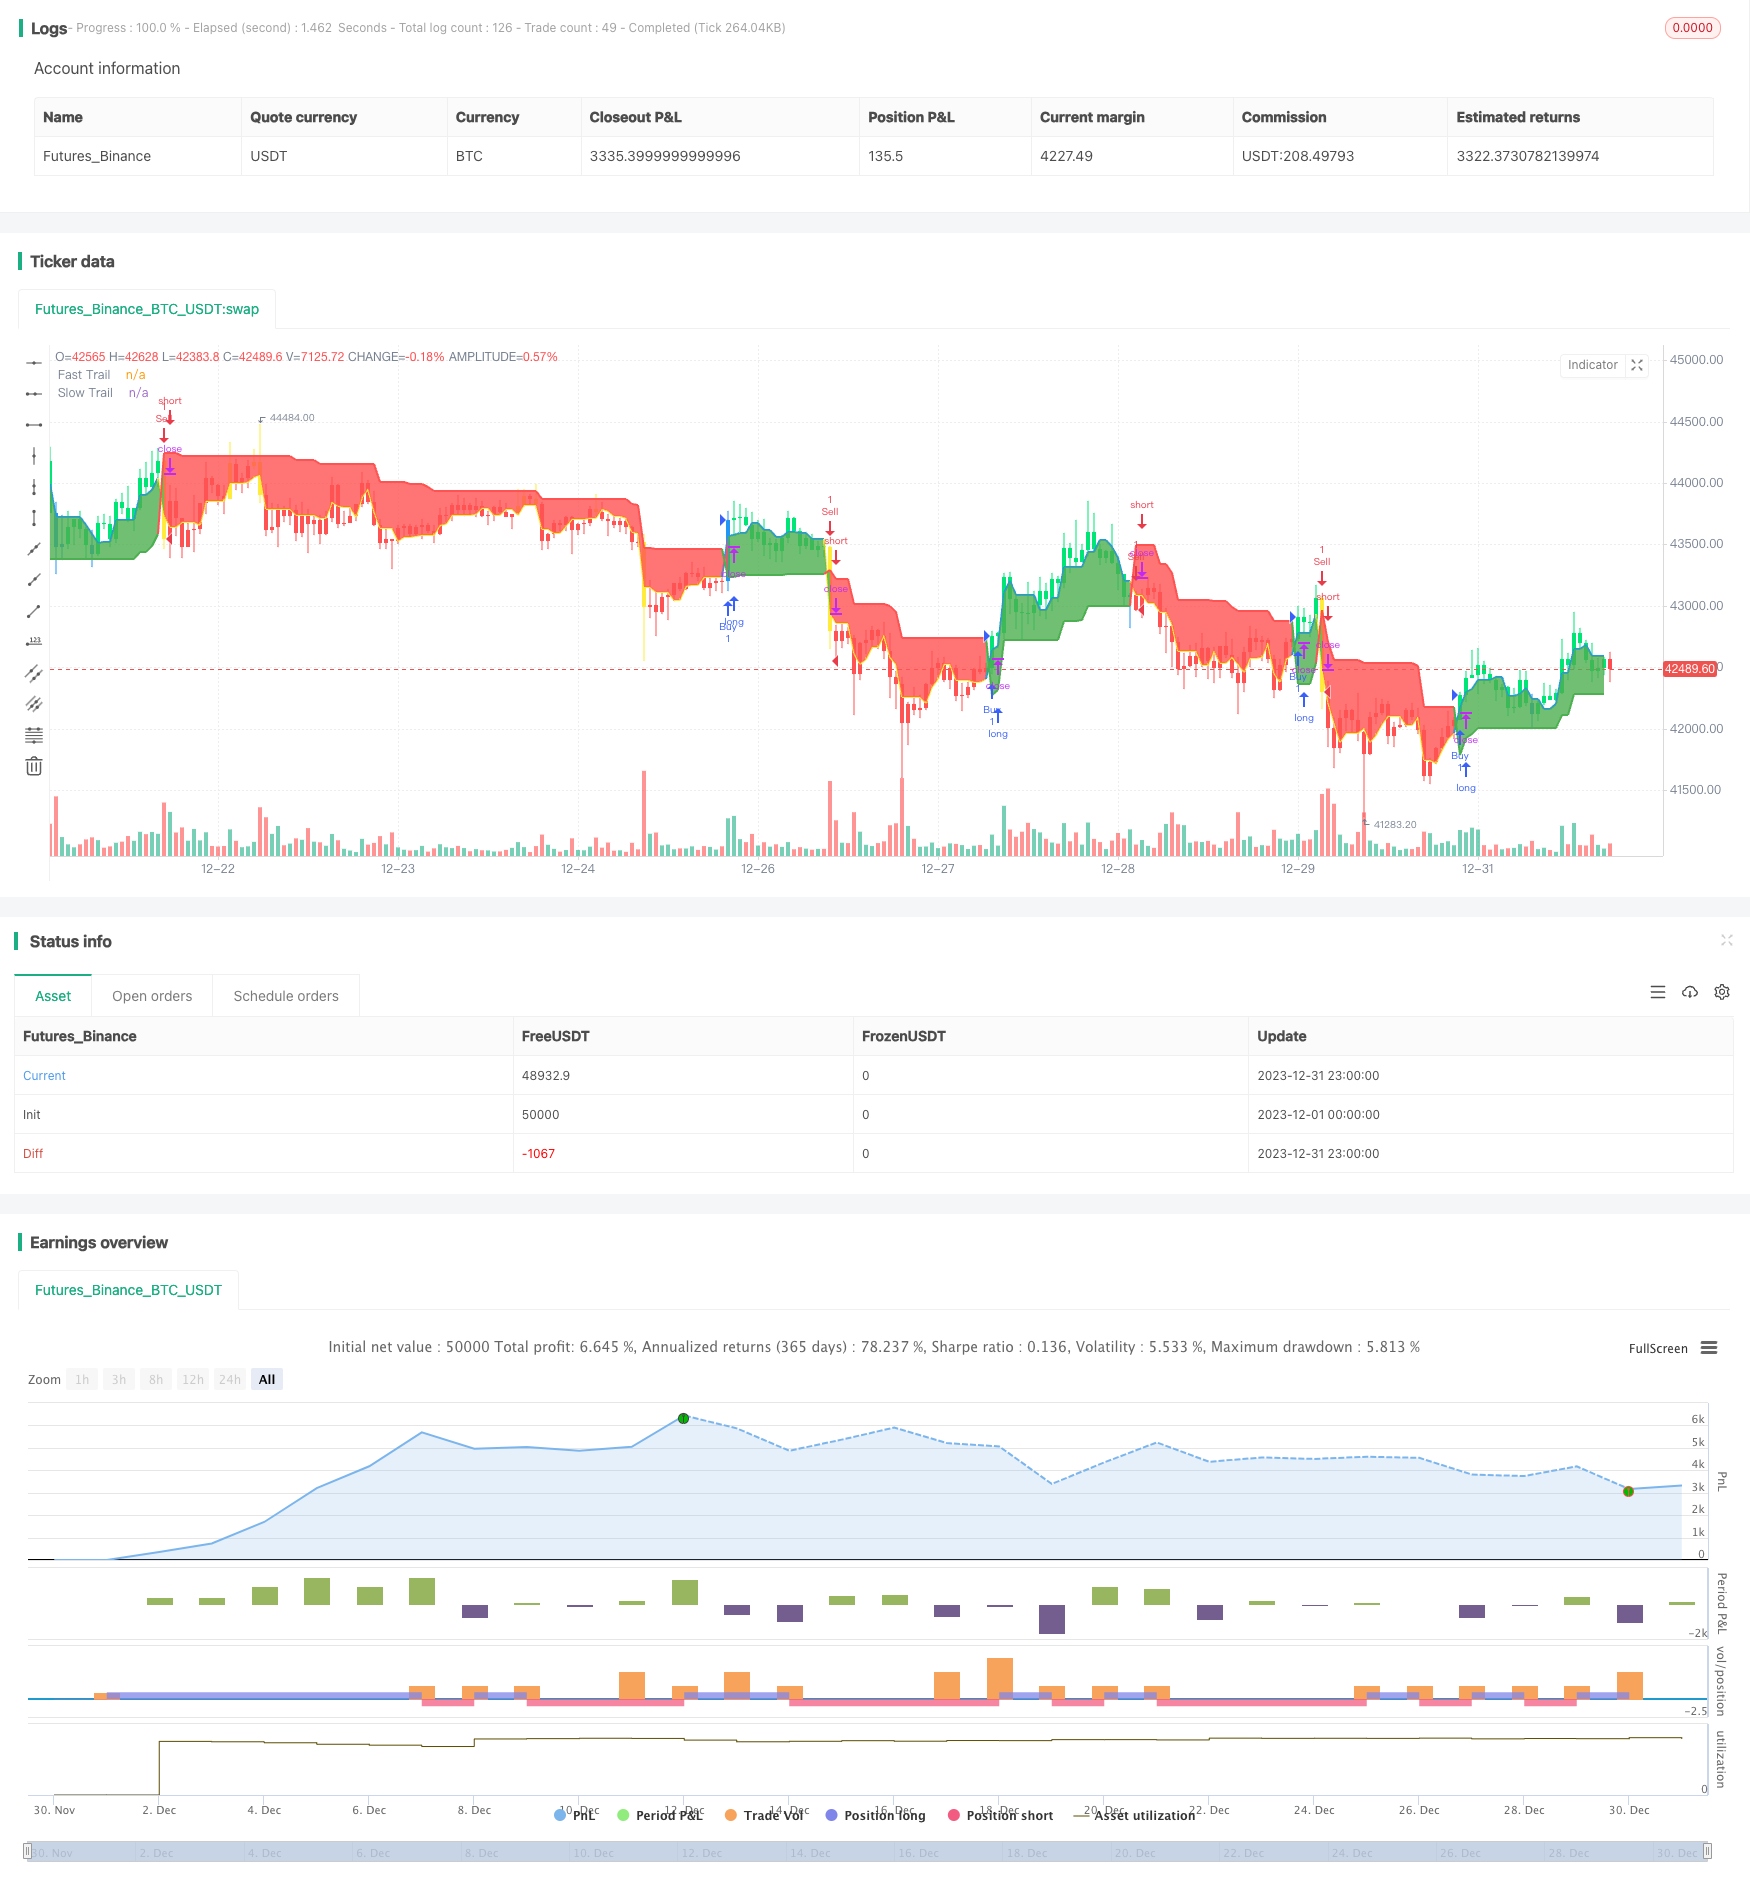
이 전략은 주로 ATR 지표를 사용하여 두 개의 중지 라인을 설정한다. 하나는 빠른 ATR 라인, ATR 주기가 짧고, 작고, 빠르게 반응한다. 다른 하나는 느린 ATR 라인, ATR 주기가 길고, 크며, 필터 역할을 한다. 빠른 ATR 라인에서 느린 ATR 라인을 통과하면 구매 신호가 발생하고, 빠른 ATR 라인에서 느린 ATR 라인을 통과하면 판매 신호가 발생한다.
구체적인 동작 논리는 다음과 같다: 빠른 ATR 라인을 계산하고 느린 ATR 라인을 계산한다. 빠른 라인 가격이 느린 라인보다 높으면 빠른 라인 꼬리를 사용해서 상쇄한다, 그렇지 않으면 느린 라인 꼬리를 사용해서 상쇄한다. 클라인 색은 현재 사용 중인 상쇄 라인을 나타내고, 녹색과 파란색은 빠른 라인 중지, 빨간색과 노란색은 느린 라인 중지한다. 시장 가격이 상쇄 라인을 만지면 출전한다.
우위 분석
이중 ATR 후속 손실 전략은 다음과 같은 장점이 있습니다.
- 운영 논리는 간단하고 명확하며, 구현을 이해하기 쉽습니다.
- 시장의 변화에 빠르게 반응하고, 높은 변동성을 가진 시장에 적합하다.
- 이중 ATR 손해 제어 위험, 효과적인 손해 막기.
- ATR 지표가 변수화되어, 스톱 로즈 폭을 조정할 수 있다.
- 시각화된 클라인 색상은 상실을 명확하게 나타냅니다.
위험 분석
이 전략에는 몇 가지 위험도 있습니다.
- 너무 자주 거래되는 경우
- ATR 지표는 곡선에 적합하지 않아 확대 손실이 발생할 수 있다.
- 이 두가지 시장 단계를 효과적으로 필터링할 수 없는 경우
ATR 주기를 최적화하고, ATR 곱수를 조정하고, 다른 지표 필터링과 결합하여 이러한 위험을 줄일 수 있습니다.
최적화 방향
이중 ATR 후속 손실 전략의 추가적인 최적화 방향은 다음과 같습니다:
- ATR 파라미터를 최적화하고, 스톱 로즈 폭을 조정한다.
- 필터링 지표를 추가하여 유효하지 않은 거래를 피하십시오. 예를 들어, 평균 지표 판단 경향을 추가하십시오.
- 포지션 개시 조건을 늘리고, 잘못된 거래를 피한다. 예를 들어 거래량 에너지 지표를 늘린다.
- 지분 기간을 늘리고, 출구를 늘리고, 너무 자주 거래하는 것을 피하십시오.
요약하다
이중 ATR 후속손실정책은 전반적으로 이해하기 쉬운 구현이며, 특히 높은 변동률의 시나리오에 적합하며, 효율적으로 위험을 제어할 수 있다. 최적화 공간도 넓으며, 매개 변수 조정, 필터 추가 등의 방법으로 향상시킬 수 있다. 추천할 만한 단선 전략이다.
/*backtest
start: 2023-12-01 00:00:00
end: 2023-12-31 23:59:59
period: 1h
basePeriod: 15m
exchanges: [{"eid":"Futures_Binance","currency":"BTC_USDT"}]
*/

// This source code is subject to the terms of the Mozilla Public License 2.0 at https://mozilla.org/MPL/2.0/
// © ceyhun

//@version=4
strategy("ATR Trailing Stop Strategy by ceyhun", overlay=true)

/////////notes////////////////////////////////////////
// This is based on the ATR trailing stop indicator //
// width addition of two levels of stops and        //
// different interpretation.                        //
// This is a fast-reacting system and is better     //
// suited for higher volatility markets             //
//////////////////////////////////////////////////////

SC = input(close, "Source", input.source)

// Fast Trail //
AP1 = input(5, "Fast ATR period", input.integer)  // ATR Period
AF1 = input(0.5, "Fast ATR multiplier", input.float)  // ATR Factor
SL1 = AF1 * atr(AP1)  // Stop Loss
Trail1 = 0.0
Trail1 := iff(SC > nz(Trail1[1], 0) and SC[1] > nz(Trail1[1], 0), max(nz(Trail1[1], 0), SC - SL1), iff(SC < nz(Trail1[1], 0) and SC[1] < nz(Trail1[1], 0), min(nz(Trail1[1], 0), SC + SL1), iff(SC > nz(Trail1[1], 0), SC - SL1, SC + SL1)))

// Slow Trail //
AP2 = input(10, "Slow ATR perod", input.integer)  // ATR Period
AF2 = input(2, "Slow ATR multiplier", input.float)  // ATR Factor
SL2 = AF2 * atr(AP2)  // Stop Loss
Trail2 = 0.0
Trail2 := iff(SC > nz(Trail2[1], 0) and SC[1] > nz(Trail2[1], 0), max(nz(Trail2[1], 0), SC - SL2), iff(SC < nz(Trail2[1], 0) and SC[1] < nz(Trail2[1], 0), min(nz(Trail2[1], 0), SC + SL2), iff(SC > nz(Trail2[1], 0), SC - SL2, SC + SL2)))

// Bar color for trade signal //
Green = Trail1 > Trail2 and close > Trail2 and low > Trail2
Blue = Trail1 > Trail2 and close > Trail2 and low < Trail2
Red = Trail2 > Trail1 and close < Trail2 and high < Trail2
Yellow = Trail2 > Trail1 and close < Trail2 and high > Trail2

// Signals //
Bull = barssince(Green) < barssince(Red)
Bear = barssince(Red) < barssince(Green)

Buy = crossover(Trail1, Trail2)
Sell = crossunder(Trail1, Trail2)

TS1 = plot(Trail1, "Fast Trail", style=plot.style_line,color=Trail1 > Trail2 ? color.blue : color.yellow, linewidth=2)
TS2 = plot(Trail2, "Slow Trail", style=plot.style_line,color=Trail1 > Trail2 ? color.green : color.red, linewidth=2)
fill(TS1, TS2, Bull ? color.green : color.red, transp=90)

plotcolor = input(true, "Paint color on chart", input.bool)

bcl = iff(plotcolor == 1, Blue ? color.blue : Green ? color.lime : Yellow ? color.yellow : Red ? color.red : color.white, na)
barcolor(bcl)

if Buy
    strategy.entry("Buy", strategy.long, comment="Buy")

if Sell
    strategy.entry("Sell", strategy.short, comment="Sell")