개요
KDJ 일사선 돌파구 구매 전략은 KDJ 지표에 기반한 양적 거래 전략이다. 이 전략은 주로 KDJ 지표의 J선과 D선의 황금 교차로로 구매 신호를 형성하고, J선에서 D선을 통과할 때 다중 입장을 한다. 이 전략은 단순하고, 실행하기 쉬운 것으로, 양적 거래 초보자에게 적합하다.
전략 원칙
이 전략이 사용하는 주요 기술 지표는 KDJ 지표이다. KDJ 지표는 K선, D선, J선으로 구성된다. 그 중:
K값= (오늘의 종식 가격-N일 최저 가격) ÷ (N일 최고 가격-N일 최저 가격) ×100;
D값 = K값의 M일 이동 평균;
J값 = 3K-2D。
KDJ 지표의 설정에 따르면, J값이 D값을 통과할 때, 주가가 상승하는 것을 표시하면, 더 많이 할 수 있다. J값이 D값을 통과할 때, 주가가 하락하는 것을 표시하면, 공백을 할 수 있다.
이 전략은 위의 규칙을 이용해서, J선에서 D선을 통과할 때, 즉 금포가 형성될 때, 구매 신호로 판단하고, 더 많은 입장을 한다. exitsignal은 J선이 100보다 크면 더 많은 입장을 한다.
전략적 이점
구매 시점을 판단하기 위해 KDJ 지표를 사용한다. 이 지표는 주가 하락 정보를 고려한 종합적인 지표이며, 비교적 신뢰할 수 있다.
전략 신호 판단 규칙은 간단하고 명확하며, 이해하기 쉬운 실행, 양적 거래 초보자에게 적합하다.
스톱 스톱 손실 전략은 위험을 효과적으로 통제할 수 있습니다.
전략 파라미터를 최적화할 수 있는 공간이 넓고, 적용할 수 있는 유연성이 있다.
전략적 위험
KDJ 지표는 잘못된 신호를 발생시키며 손실을 초래할 수 있다.
구매 후 시장 단선 조정으로 인해 손실이 중단되고 큰 추세를 잡지 못할 수 있습니다.
매개 변수 설정이 잘못되면 거래가 빈번하거나 신호가 잘 보이지 않을 수 있습니다.
거래비용이 전체 수익에 미치는 영향에 주의를 기울여야 합니다.
주요 위험 제어 방법: 합리적인 최적화 매개 변수, 추적 지수 강화, 적절하게 느슨한 중지 범위 등.
최적화 방향
KDJ의 변수를 최적화하여 최적의 변수 조합을 찾습니다.
필터링 조건을 추가하여 가짜 신호를 방지한다. 다른 지표 또는 형태와 결합하여 필터링 할 수 있다.
시장 유형에 따라 다른 파라미터 설정을 선택할 수 있다.
제약금의 폭을 적절히 완화하여 제약금의 철회 가능성을 줄일 수 있습니다.
거래량과 같은 지표 분석과 결합하여 조작을 피할 수 있습니다.
요약하다
KDJ 선선 돌파구 구매 전략은 전반적으로 간단하고 실용적이며, 쉽게 실행할 수 있으며, 특히 양적 거래를하는 초보자에게 적합하다. 이 전략은 특정 거래 장점이 있지만, 또한 몇 가지 위험이 있으며, 전략의 가치를 완전히 발휘하기 위해 타겟팅 된 최적화가 필요합니다. 전체적으로 이 전략은 연구와 응용에 중점을 두는 가치가 있습니다.
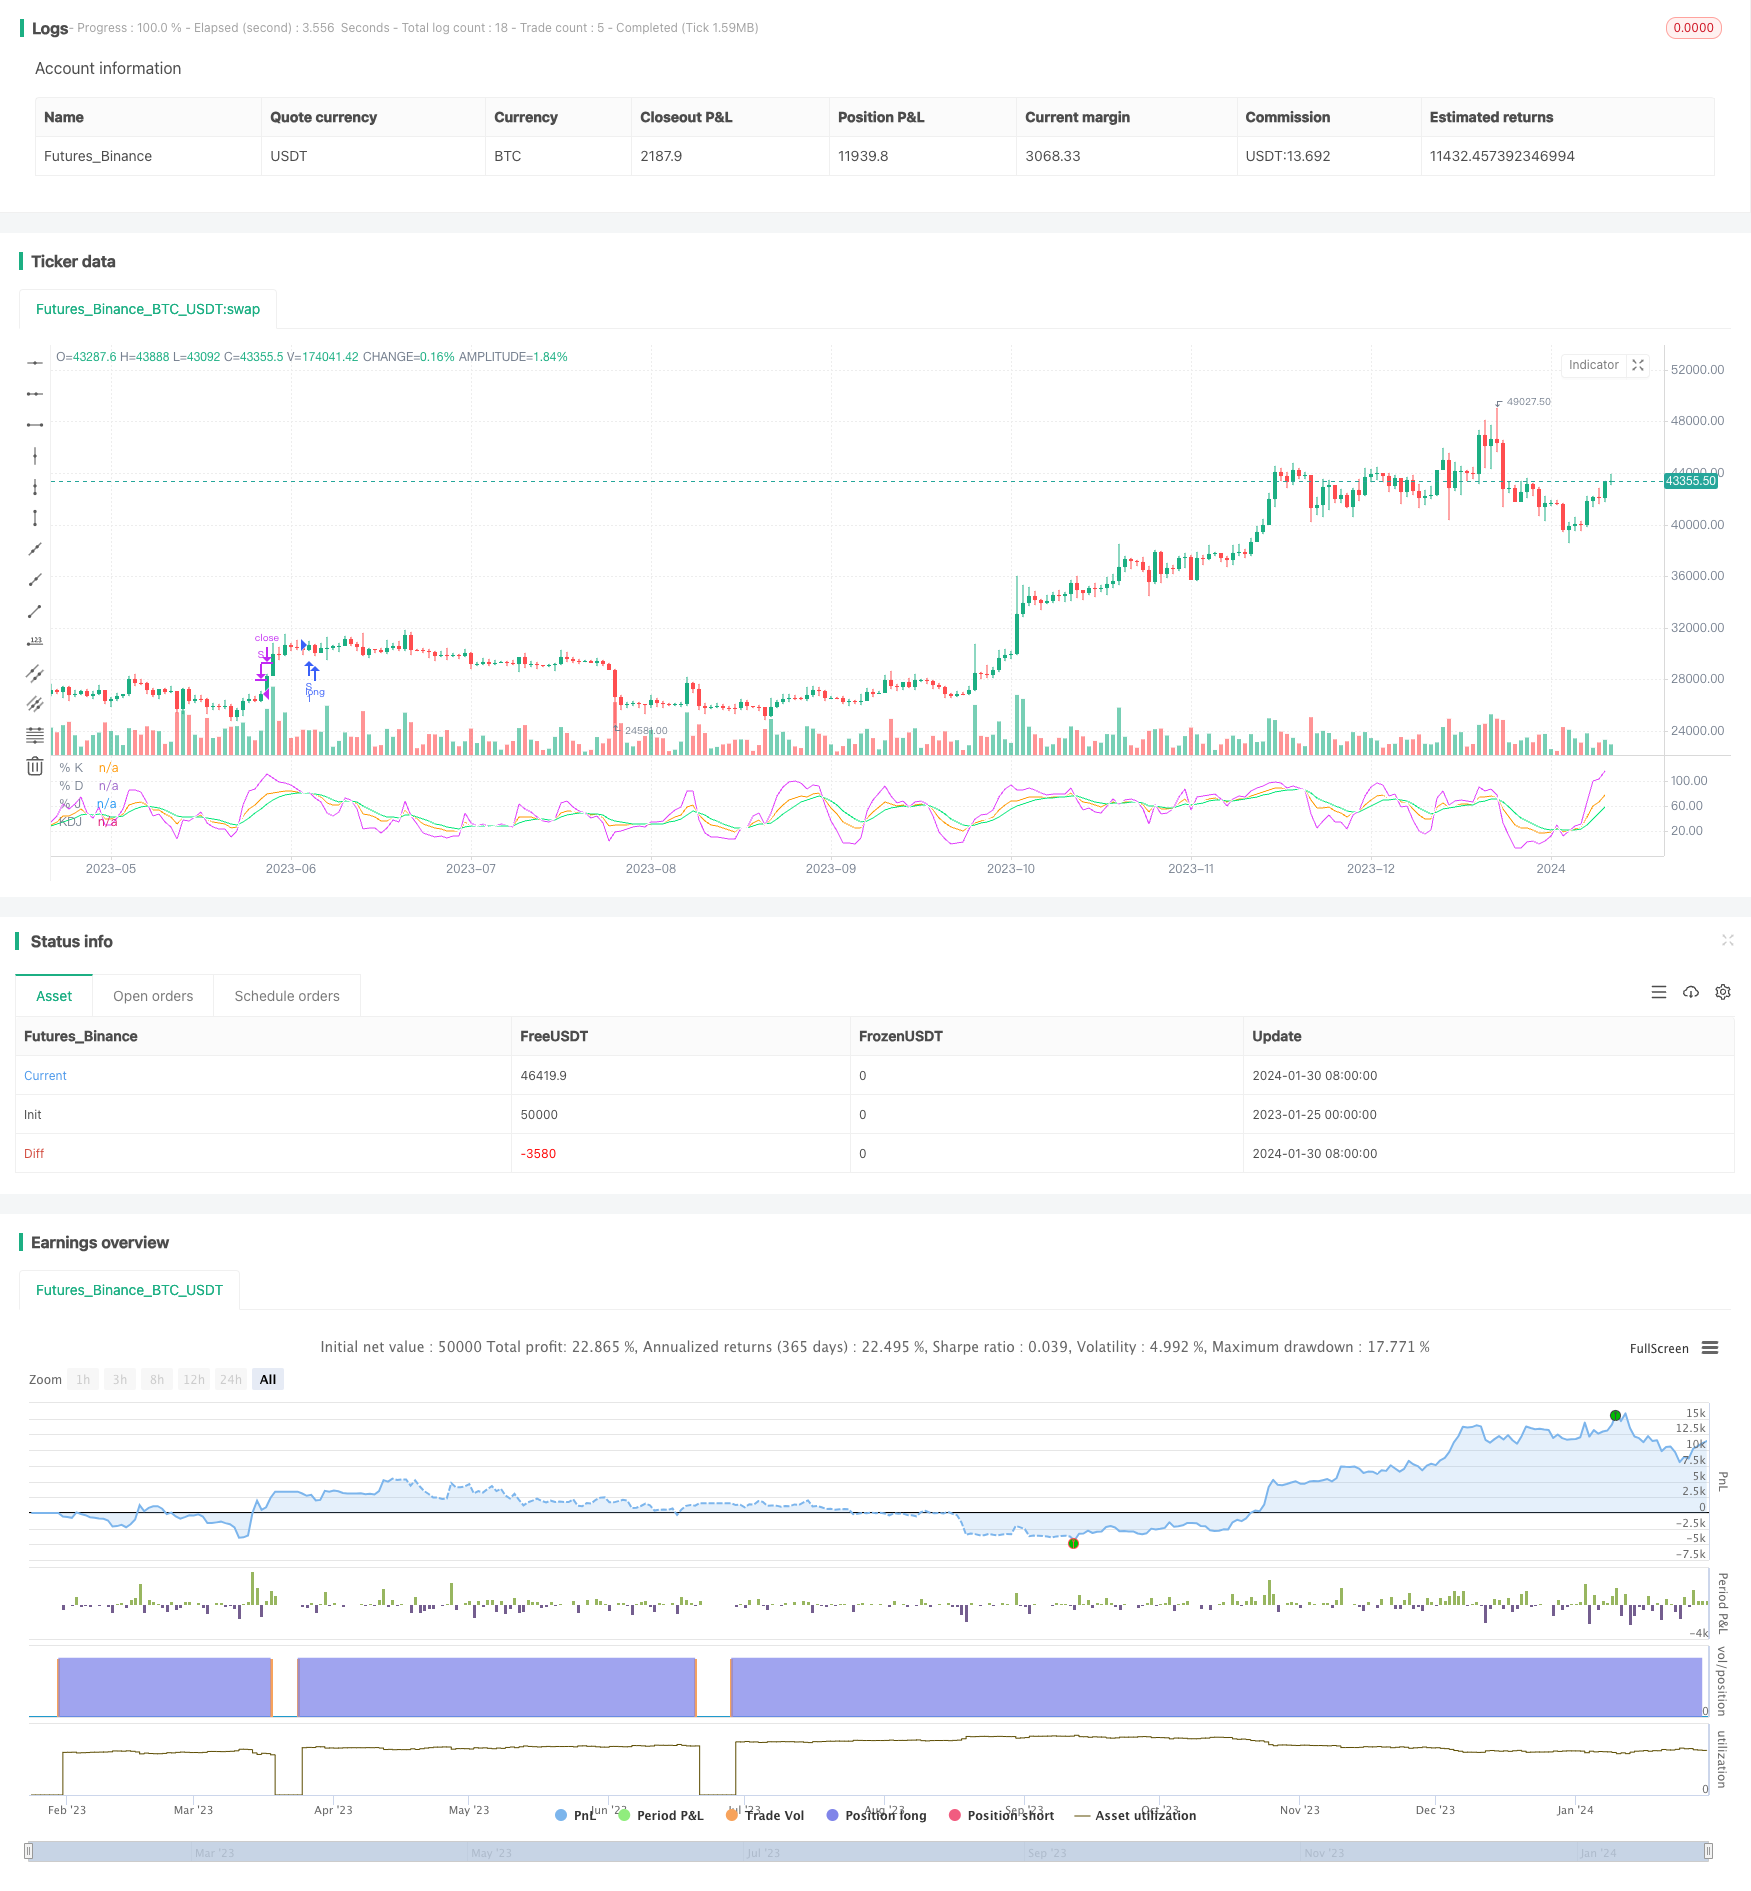
/*backtest
start: 2023-01-25 00:00:00
end: 2024-01-31 00:00:00
period: 1d
basePeriod: 1h
exchanges: [{"eid":"Futures_Binance","currency":"BTC_USDT"}]
*/

//  ## !<------------------ Script -------------------------->
//@version=5
strategy('KDJ NVDA', shorttitle='KDJ')

ilong = input(9, title='period')
isig = input(3, title='signal')

bcwsma(s, l, m) =>
    _bcwsma = float(na)
    _s = s
    _l = l
    _m = m
    _bcwsma := (_m * _s + (_l - _m) * nz(_bcwsma[1])) / _l
    _bcwsma

// profit strategy add
profit_m = input.float(1.20,"Profit Margin",minval=1.0,maxval=1.99,step=0.05)
stop_m = input.float(0.98,"Stop Loss Margin",minval=0.0,maxval=1,step=0.05)

// Make input options that configure backtest date range
startDate = input.int(title="Start Date", defval=1, minval=1,maxval=31)
startMonth = input.int(title="Start Month", defval=1,minval=1,maxval=12)
startYear = input.int(title="Start Year", defval=2023,minval=2018,maxval=2024)
endDate = input.int(title="End Date", defval=1, minval=1,maxval=31)
endMonth = input.int(title="End Month", defval=1,minval=1,maxval=12)
endYear = input.int(title="End Year", defval=2024,minval=2018,maxval=2099)

// intialization of variables
// Look if the close time of the current bar
// falls inside the date range
inDateRange = (time >= timestamp(syminfo.timezone, startYear,startMonth, startDate, 0, 0)) and (time < timestamp(syminfo.timezone, endYear, endMonth, endDate, 0, 0))

c = close
h = ta.highest(high, ilong)
l = ta.lowest(low, ilong)
RSV = 100 * ((c - l) / (h - l))
pK = bcwsma(RSV, isig, 1)
pD = bcwsma(pK, isig, 1)
pJ = 3 * pK - 2 * pD
KDJ = math.avg(pD, pJ, pK)

go_long= ta.crossunder(pD,pJ)


if (inDateRange and go_long)
    strategy.entry("S",strategy.long,comment="C")
	// strategy.exit("S", limit=c*profit_m, stop=c*stop_m, comment="SL/SP")

if (inDateRange and pJ > 100)
	strategy.close("S", comment="TP")

// Plot options
// plot(pK, color= #1E88E5)
// plot(pD, color=#FF6F00)
// plot(ma, color=color.yellow)
// bgcolor(pJ>pD? color.green : color.red)

plot(pK, title='% K', color=color.new(color.orange, 0))
plot(pD, title='% D', color=color.new(color.lime, 0))
plot(pJ, title='% J', color=color.new(color.fuchsia, 0))
plot(KDJ, title='KDJ', color=color.new(color.white, 0))
// </PINE> </SCRIPT>
// ## This source code is subject to the terms of the ozilla Public License 2.0 at https://mozilla.org/MPL/2.0/
// ## !<------------------ End Script -------------------------->