개요
이 전략은 SPY 거래 데이터를 추적하여 이동 평균, MACD, RSI 등 여러 기술 지표 신호와 결합하여 단기 움직임을 정확하게 판단하고 구매 및 판매 결정을 내리고 단선 거래 수익을 창출합니다.
전략 원칙
이 전략의 핵심 논리는 다음과 같은 기술 지표에 근거하여 단기 트렌드 및 출입 시기를 판단합니다.
- 5일과 13일 지수 이동 평균 ((EMA) 의 금포크와 사다리포크는 다공성 트렌드의 전환을 판단하는 데 사용됩니다.
- MACD 지표는 상승 동력이 있는지 판단한다.
- ADX 지표는 트렌드가 있는지 판단한다.
- RSI는 트렌드의 강도를 판단합니다.
위의 지표 파라미터를 최적화하여, 중요한 다공이 전환점을 판단한다. 5⁄6 조건이 충족되면 흰색 신호를 표시하여 L 또는 S를 표시하고, 6 가지 조건이 완전히 충족되면 금색 △ 모양 신호를 표시한다.
구매 신호를 형성하는 조건:
5일 EMA가 13일 EMA보다 크며 MACD 라인이 0.5보다 낮고 ADX가 20보다 높고 MACD 경사가 0보다 높고 신호 라인이 -0.1보다 높고 RSI가 40보다 높습니다.
판매 신호를 형성하는 조건:
5일 EMA가 13일 EMA보다 작고 MACD 선이 -0.5보다 높고 ADX가 20보다 높고 신호 선이 0보다 낮고 MACD 경사가 0보다 작고 RSI가 60보다 낮습니다.
우위 분석
이 전략은 다음과 같은 장점을 가지고 있습니다.
- 여러 지표 신호를 조합하여 판단의 정확도가 높습니다.
- 매개 변수를 최적화하여 판단의 민감성과 정확성을 균형 잡는다.
- 신호 판단이 간결하고 명확하며, 작동 은 낮다.
- 대부분의 투자자의 위험 선호에 맞는 단선 거래에 적합합니다.
- 마감시간의 높은 변동성을 피하기 위해 실 디스크 운영 요구 사항을 고려하십시오.
위험 분석
이 전략에는 다음과 같은 위험도 있습니다.
- 매개 변수 설정이 잘못되면 잘못된 판단이 발생할 수 있습니다. 지속적인 테스트와 최적화가 필요합니다.
- 단일 품종, 산업 및 자산 배분 위험을 분산할 수 없습니다.
- 거래비용과 자주 거래하는 경우의 슬라이드포인트 위험
- 마감시간이 끝나고 갱신할 수 없어서 일부 기회를 놓칠 수도 있다.
최적화 방향
이 전략은 다음과 같은 차원에서 더욱 개선될 수 있습니다.
- 테스트는 파라미터 설정을 수정하여 판단 정확도를 높인다.
- 단편적 손실을 통제하기 위해 Stop Loss Indicators를 늘립니다.
- 포지션 개시 시간을 최적화하고, 마이너스의 높은 변동기를 필터링한다.
- 다른 품종을 전략으로 추가하는 것
- 기계 학습 알고리즘과 결합하여 파라미터의 자기 적응력을 높인다.
요약하다
이 전략은 SPY 데이터를 추적하여 이동 평균, MACD, RSI 등 여러 가지 기술 지표와 결합하여 단기 경향을 판단하고, 동작 빈도가 높고, 철회율이 낮으며, 짧은 라인 거래에 적합합니다. 여러 차원에서 계속 최적화 할 수 있으며, 개선할 여지가 있습니다.
전략 소스 코드
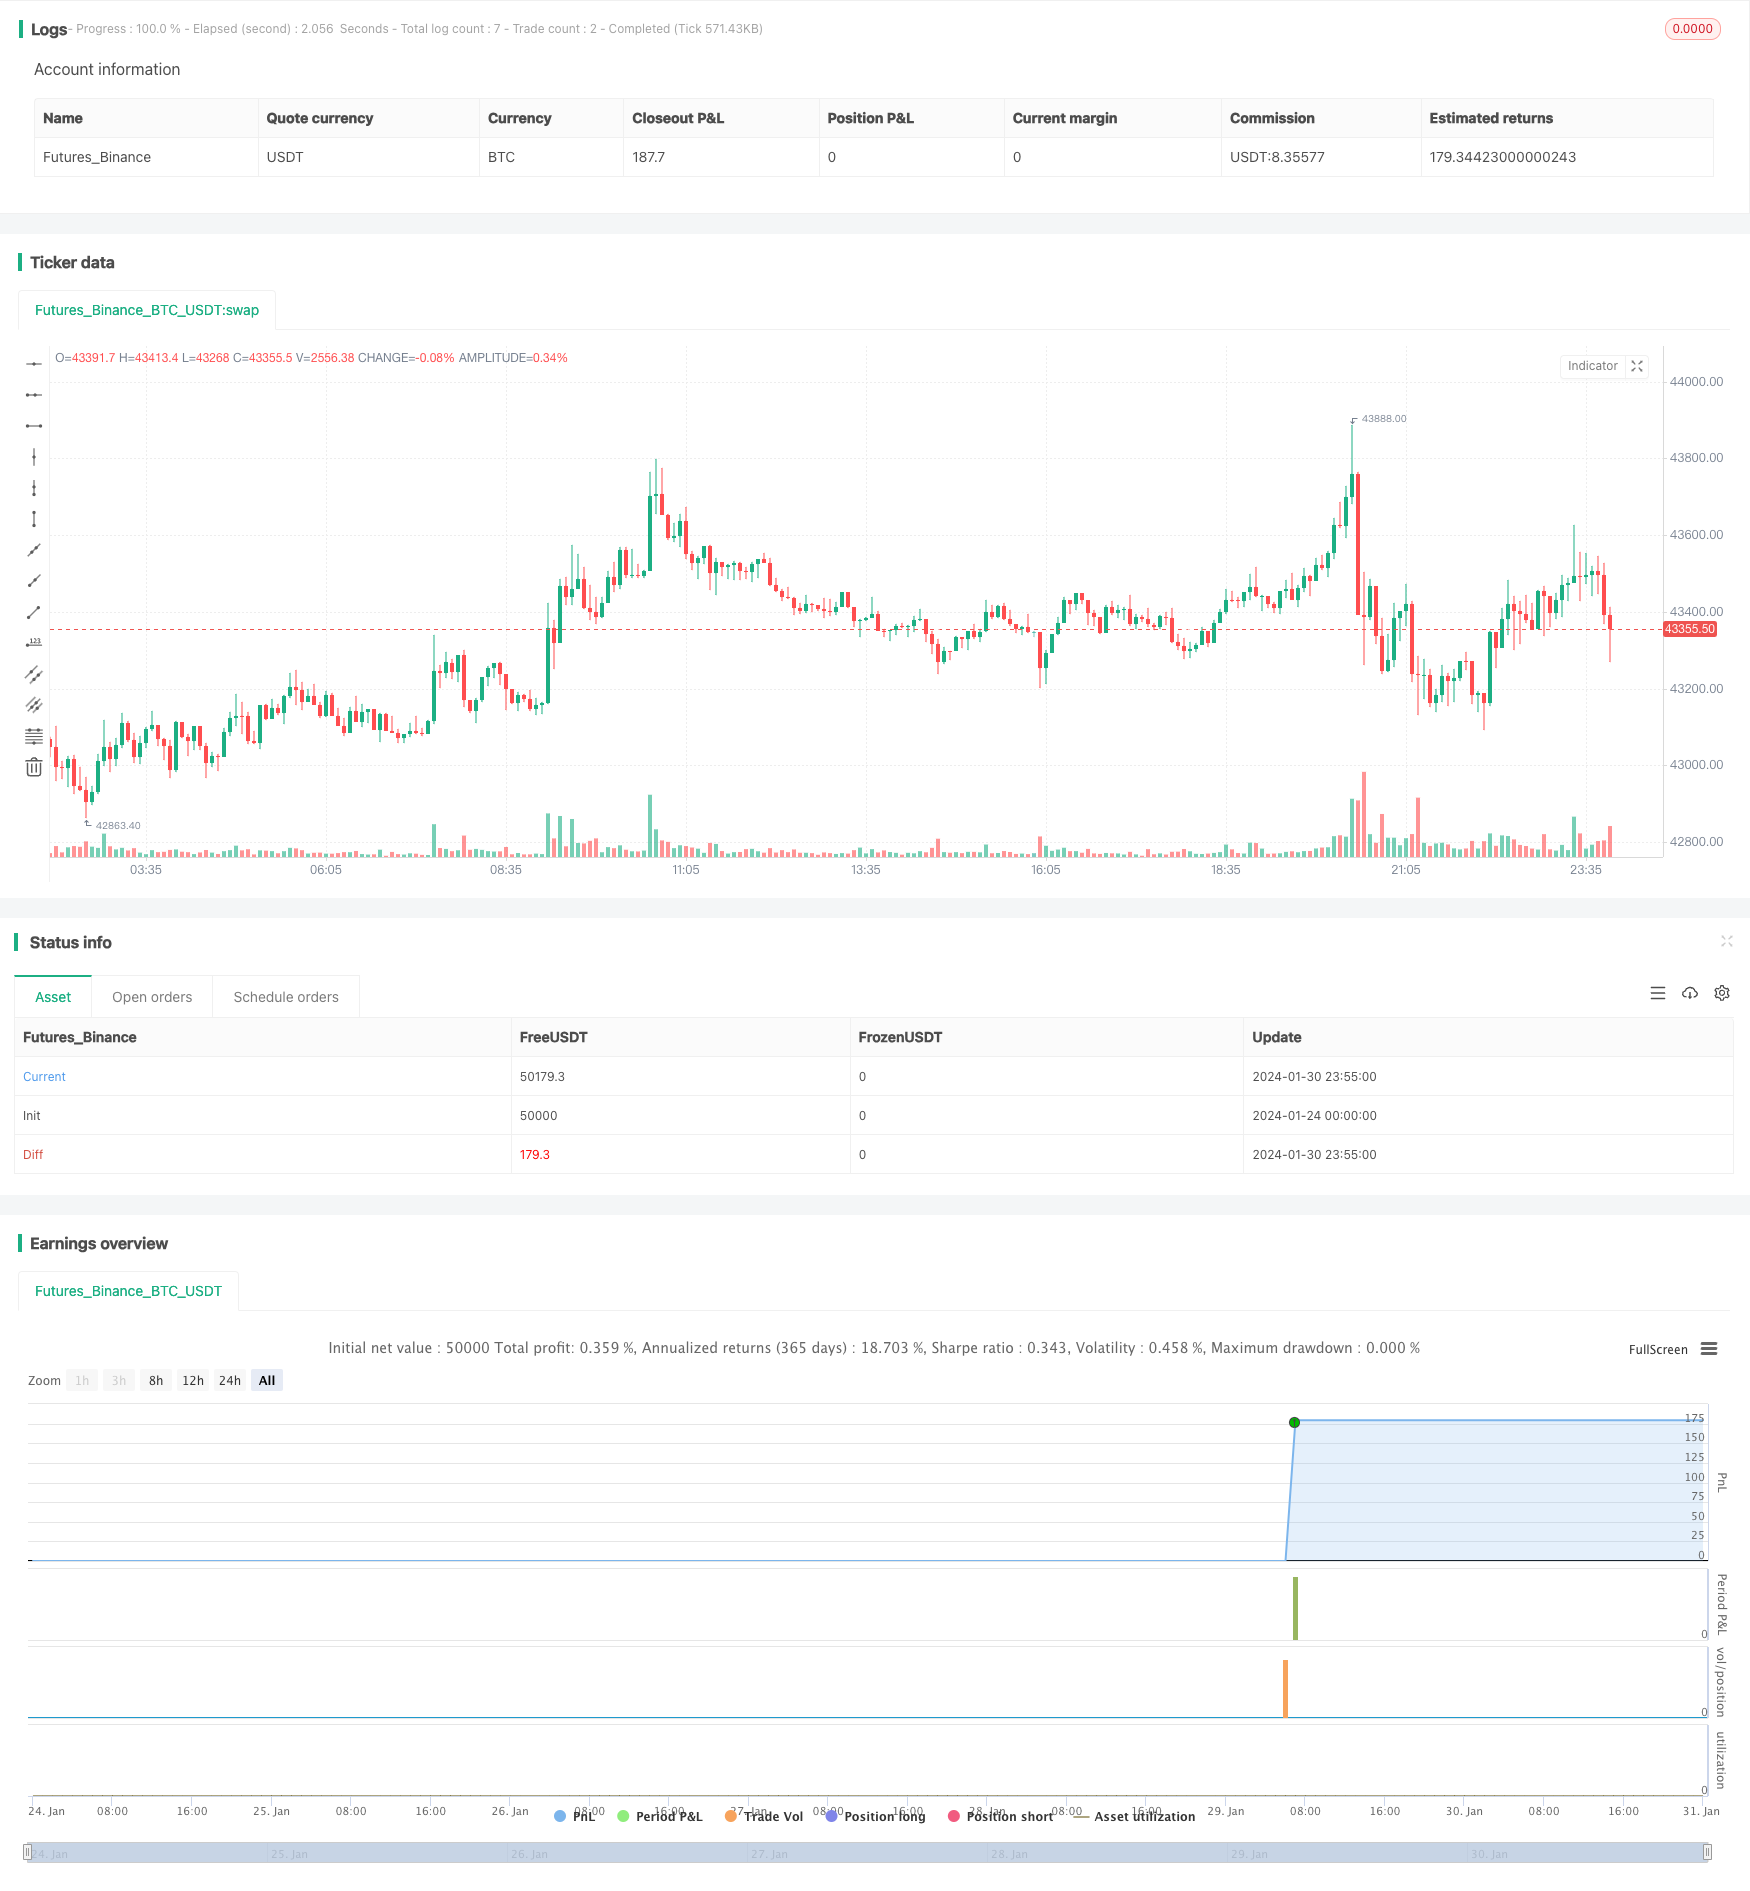
/*backtest
start: 2024-01-24 00:00:00
end: 2024-01-31 00:00:00
period: 5m
basePeriod: 1m
exchanges: [{"eid":"Futures_Binance","currency":"BTC_USDT"}]
*/

//@version=5
strategy(title="SPY 1 Minute Day Trader", overlay=true)

//This script has been created to take into account how the following variables impact trend for SPY 1 Minute
//The SPY stop losses/take profit have been set at 30 cents which equates to 15 cents on SPY 1 DTE ATM contracts
//5 ema vs 13 ema : A cross establishes start of trend
//MACD (Line, Signal & Slope) : If you have momentum
//ADX : if you are trending
//RSI : If the trend has strength
//The above has been optimized to determine pivot points in the trend using key values for these 6 indicators
//bounce up = ema5 > ema13 and macdLine < .5 and adx > 20 and macdSlope > 0 and signalLine > -.1 and rsiSignal > 40
//bounce down = ema5 < ema13 and macdLine > -.5 and adx > 20 and signalLine < 0 and macdSlope < 0 and rsiSignal < 60
//White L's indicate that 5 of 6 conditions are met due to impending uptrend w/ missing one in green below it
//Yellow L's indicate that 6 of 6 conditions still are met
//White S's indicate that 5 of 6 conditions are met due to impending downtrend w/ missing condition in red above it
//Yellow S's indicate that 6 of 6 conditions still are met
//After a downtrend or uptrend is established, once it closes it can't repeat for 10 minutes
//Won't open any trades on last two minutes of any hours to avoid volatility
//Will close any open trades going into last minute of hour

// Initialize variables
var float long_entry_price = na
var float short_entry_price = na
var float stop_loss = na
var float take_profit = na
var float short_stop_loss = na
var float short_take_profit = na
var float option_SL = 0.3 //approx 15 cents on SPY 1 DTE
var float option_TP = 0.3 //approx 15 cents on SPY 1 DTE
var long_entry_time = 0
var short_entry_time = 0
var allow_long_entry = true
var allow_short_entry = true
var allow_trades = true
var hourlyclose = 0
var notify = 0
var shortnotify = 0

// Calculate the EMAs & SMAs
ema5 = ta.ema(close, 5)
ema13 = ta.ema(close, 13)
sma20 = ta.sma(close, 20)

// Input parameters
fastLength = input.int(12, minval=1, title="Fast Length")
slowLength = input.int(26, minval=1, title="Slow Length")
signalLength = input.int(9, minval=1, title="Signal Smoothing")

// Inputs
length = input.int(14, "Length")
smoothK = input.int(3, "SmoothK")
src = input(close, "Source")
overbought = input.float(80, "Overbought")
oversold = input.float(20, "Oversold")

//Stochastic Calculation
highestHigh = ta.highest(src, length)
lowestLow = ta.lowest(src, length)
k = 100 * ((src - lowestLow) / (highestHigh - lowestLow))
d = ta.sma(k, smoothK)

// Calculate MACD
[macdLines, signalLines, _] = ta.macd(close, fastLength, slowLength, signalLength)

// Calculate slope of MACD line
macdSlope = (macdLines - macdLines[1]) / (bar_index - bar_index[1])

// Calculate the RSI
rsiValue = ta.rsi(close, 5)

// Calculate the signal line as the SMA of the RSI for 5 minute over 9 periods
rsiSignal = ta.sma(rsiValue, 9)

// Calculate MACD
[macdLine, signalLine, _] = ta.macd(close, 12, 26, 9)

// Length of the ATR
atr_length = input.int(14, title="ATR Length", minval=1)

// Calculate the True Range
tr = ta.tr(true)

// Calculate the ATR
atr = ta.atr(atr_length)

// Length of the ADX
len = input.int(14, minval=1)

// Set minimum number of bars between trades
min_bars_between_trades = 10

// Calculate the Directional Movement
up = ta.change(high)
down = -ta.change(low)
plusDM = na(up) ? na : (up > down and up > 0 ? up : 0)
minusDM = na(down) ? na : (down > up and down > 0 ? down : 0)

// Calculate the Smoothed Directional Movement
plusDI = 100 * ta.ema(plusDM, len) / ta.ema(tr, len)
minusDI = 100 * ta.ema(minusDM, len) / ta.ema(tr, len)

// Calculate the Directional Index (DX)
DX = 100 * math.abs(plusDI - minusDI) / (plusDI + minusDI)

// Calculate the ADX
adx = ta.ema(DX, len)

// Get high, low, and close prices
highPrice = high
lowPrice = low
closePrice = close

// Determine buy and sell signals - Tried to optimize as much as possible - changing these do impact results
buy_signal = ema5 > ema13 and macdLine < .5 and adx > 20 and macdSlope > 0 and signalLine > -.1 and rsiSignal > 40
short_buy_signal = ema5 < ema13 and macdLine > -.5 and adx > 20 and signalLine < 0 and macdSlope < 0 and rsiSignal < 60

// Define long entry conditions
C1 = ema5 > ema13 ? 1 : 0 //E below bar when only one missing
C2 = d < 70 ? 1 : 0 //no longer part of signal - but was Smoothed Stoicastic
C3 = macdLine < .5 ? 1 : 0 //M below bar when only one missing
C4 = adx > 20 ? 1 : 0 //A below bar when only one missing
C5 = macdSlope > 0 ? 1 : 0 //% below bar when only one missing
C6 = signalLine > -.01 ? 1 : 0 //S (MACD Signal) below bar when only one missing
C7 = rsiSignal > 50 ? 1 : 0 //R below bar when only one missing

// Define short entry conditions
C8 = ema5 < ema13 ? 1 : 0 //E above bar when only one missing
C9 = d > 40 ? 1 : 0 //no longer part of signal - but was Smoothed Stoicastic
C10 = macdLine > -0.5 ? 1 : 0 //M above bar when only one missing
C11 = adx > 20 ? 1 : 0 //A above bar when only one missing
C12 = macdSlope < 0 ? 1 : 0 //% above bar when only one missing
C13 = signalLine < 0 ? 1 : 0 //S (MACD Signal) above bar when only one missing
C14 = rsiSignal < 50 ? 1 : 0 //R above bar when only one missing

// Long or Short Incoming denoted by white color and gold means all conditions met
plotchar((C1 + C3 + C4 + C5 + C6 + C7) == 5 ? 1 : na, title="Pivot Up White", char="L", location=location.belowbar, color=color.white, size = size.tiny)
plotchar((C8 + C10 + C11 + C12 + C13 + C14) == 5 ? 1 : na, title="Pivot Down White", char="S", location=location.abovebar, color=color.white, size = size.tiny)
plotchar((C1 + C3 + C4 + C5 + C6 + C7) > 5 ? 1 : na, title="Pivot Up Gold", char="L", location=location.belowbar, color=color.yellow, size = size.tiny)
plotchar((C8 + C10 + C11 + C12 + C13 + C14) > 5 ? 1 : na, title="Pivot Down Gold", char="S", location=location.abovebar, color=color.yellow, size = size.tiny)
plotchar((C1 + C3 + C4 + C5 + C6 + C7) >= 5 and (C1) != 1 ? 1 : na, title="Missing", char = "", text="E", location=location.belowbar, color=color.green, size = size.small)
plotchar((C1 + C3 + C4 + C5 + C6 + C7) >= 5 and (C3) != 1 ? 1 : na, title="Missing", char = "", text="M", location=location.belowbar, color=color.green, size = size.small)
plotchar((C1 + C3 + C4 + C5 + C6 + C7) >= 5 and (C4) != 1 ? 1 : na, title="Missing", char = "", text="A", location=location.belowbar, color=color.green, size = size.small)
plotchar((C1 + C3 + C4 + C5 + C6 + C7) >= 5 and (C5) != 1 ? 1 : na, title="Missing", char = "", text="%", location=location.belowbar, color=color.green, size = size.small)
plotchar((C1 + C3 + C4 + C5 + C6 + C7) >= 5 and (C6) != 1 ? 1 : na, title="Missing", char = "", text="S", location=location.belowbar, color=color.green, size = size.small)
plotchar((C1 + C3 + C4 + C5 + C6 + C7) >= 5 and (C7) != 1 ? 1 : na, title="Missing", char = "", text="R", location=location.belowbar, color=color.green, size = size.small)
plotchar((C8 + C10 + C11 + C12 + C13 + C14) >= 5 and (C8) != 1 ? 1 : na, title="Missing", char = "", text="E", location=location.abovebar, color=color.red, size = size.small)
plotchar((C8 + C10 + C11 + C12 + C13 + C14) >= 5 and (C10) != 1 ? 1 : na, title="Missing", char = "", text="M", location=location.abovebar, color=color.red, size = size.small)
plotchar((C8 + C10 + C11 + C12 + C13 + C14) >= 5 and (C11) != 1 ? 1 : na, title="Missing", char = "", text="A", location=location.abovebar, color=color.red, size = size.small)
plotchar((C8 + C10 + C11 + C12 + C13 + C14) >= 5 and (C12) != 1 ? 1 : na, title="Missing", char = "", text="%", location=location.abovebar, color=color.red, size = size.small)
plotchar((C8 + C10 + C11 + C12 + C13 + C14) >= 5 and (C13) != 1 ? 1 : na, title="Missing", char = "", text="S", location=location.abovebar, color=color.red, size = size.small)
plotchar((C8 + C10 + C11 + C12 + C13 + C14) >= 5 and (C14) != 1 ? 1 : na, title="Missing", char = "", text="R", location=location.abovebar, color=color.red, size = size.small)

// Execute buy and sell orders
if buy_signal and allow_trades and allow_long_entry  //Don't buy on last 2 minutes of hour
    long_entry_price := open
    strategy.entry("Pivot Up", strategy.long)
    stop_loss := long_entry_price - option_SL
    take_profit := long_entry_price + option_TP
    long_entry_time := time
    allow_long_entry := false
    allow_trades := false
    notify := 1
plotshape(notify == 1 ? 1 : na, "Pivot Up", style=shape.triangleup, offset = 1, location=location.belowbar, size=size.normal, textcolor = color.orange, color=color.orange)
if notify == 1
    notify := notify - 1

if short_buy_signal and allow_trades and allow_short_entry  //Don't buy on last 2 minutes of hour
    short_entry_price := open
    strategy.entry("Pivot Down", strategy.short)
    short_stop_loss := short_entry_price + option_SL
    short_take_profit := short_entry_price - option_TP
    short_entry_time := time
    allow_short_entry := false
    allow_trades := false
    shortnotify := 1
plotshape(shortnotify == 1 ? 1 : na, "Pivot Down", style=shape.triangledown, offset = 1, location=location.abovebar, size=size.normal, textcolor = color.orange, color=color.orange)
if shortnotify == 1
    shortnotify := shortnotify - 1

// Take scalp when in a position and 5 or more parameters are met!
if strategy.position_size != 0 and (C1 + C3 + C4 + C5 + C6 + C7) >5
    strategy.exit("Exit Longs", "Pivot Up", stop=stop_loss, limit = take_profit)
else if strategy.position_size != 0 and (C8 + C10 + C11 + C12 + C13 + C14) >5
    strategy.exit("Exit Shorts", "Pivot Down", stop=short_stop_loss, limit = short_take_profit)

// Reset allow_trades after cool-down period of min_bars_between_trades bars set above
if time > long_entry_time + (time - time[1]) * min_bars_between_trades
    allow_long_entry := true
    allow_trades := true

if time > short_entry_time + (time - time[1]) * min_bars_between_trades
    allow_short_entry := true
    allow_trades := true

// Close all positions at the end of the trading day and when volatile hours approach!
if  strategy.position_size != 0
    strategy.close("Pivot Up")
    strategy.close("Pivot Down")
    hourlyclose := 1
plotshape(hourlyclose == 1 ? 1 : na, "Suggested Volatile Hour Close", text="Suggested Volatile Hour Close", offset = 1, style=shape.triangledown, location=location.abovebar, size=size.tiny, textcolor = color.orange, color=color.orange)
if hourlyclose == 1
    hourlyclose := hourlyclose - 1