개요
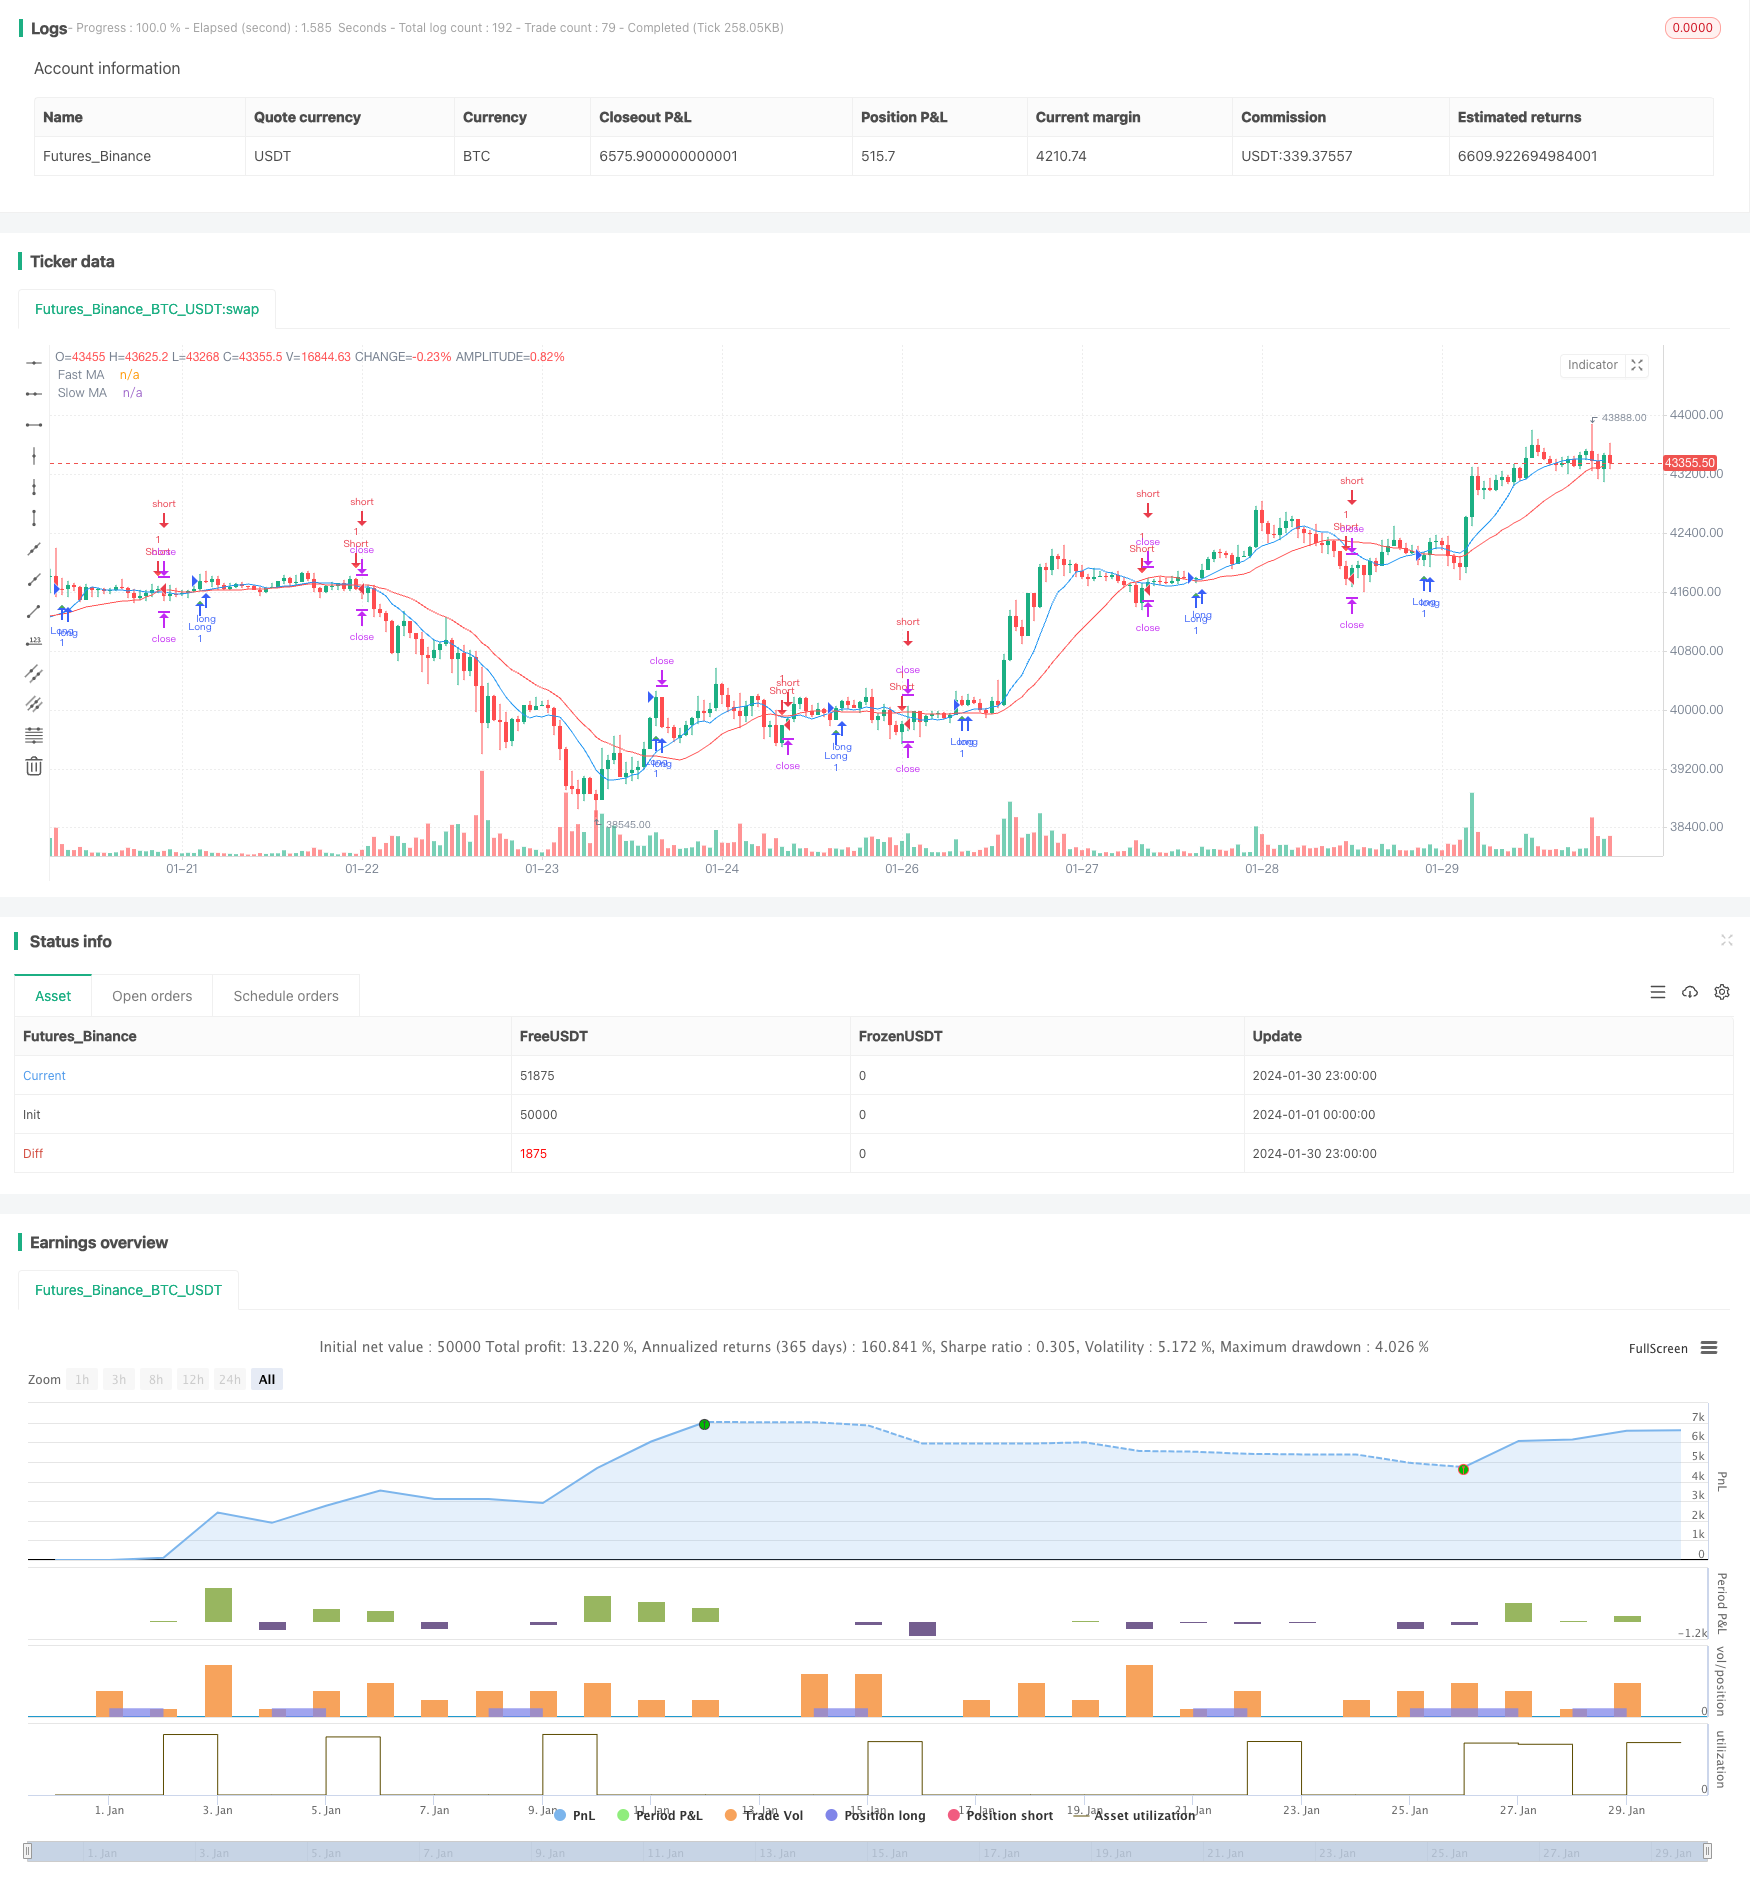
동적 이동 평균 크로스 오버 전략 (Dynamic Moving Average Crossover Strategy) 은 전형적인 트렌드 추적 전략이다. 이 전략은 빠른 이동 평균 (Fast MA) 과 느린 이동 평균 (Slow MA) 을 계산하여, 그리고 그들이 교차할 때 구매 및 판매 신호를 생성하여 시장 트렌드의 전환점을 포착한다.
전략 원칙
이 전략의 핵심 논리는 빠른 이동 평균이 아래에서 느린 이동 평균을 통과하면 구매 신호가 발생하고 빠른 이동 평균이 위에서 아래에서 느린 이동 평균을 통과하면 판매 신호가 발생한다는 것입니다.
이동 평균은 시장의 잡음을 효과적으로 차단하고 가격 추세를 포착할 수 있다. 빠른 이동 평균은 더 민감하며, 트렌드의 변화를 적시에 포착할 수 있다. 느린 이동 평균은 더 안정적이며, 단기 변동의 영향을 효과적으로 제거한다.
이 전략은 평행선이 교차할 때 즉시 거래 신호를 발산하고, 트렌드 추적 전략을 취하여 시장 추세를 따라 더 큰 수익을 얻습니다. 동시에, 전략은 중지 손실 및 중지 위치를 설정하고, 위험을 엄격히 제어합니다.
우위 분석
- 전략적 재검토가 잘 수행되고, 트렌드를 추적하여 큰 트렌드를 포착합니다.
- 평선 교차는 명확한 신호를 생성하고, 실행하기 쉽습니다.
- 손해 차단장치를 설정하고, 위험을 철저히 통제합니다.
위험 분석
- 심각한 손실을 초래할 수 있는 신호 오류 거래
- 거래 빈도, 지분 보유 기간이 짧다
- 합리적으로 설정된 변수
매개 변수를 최적화하거나, 평균주기 길이를 조정하거나, 필터 조건을 추가하는 등의 방법으로 개선할 수 있다.
최적화 방향
- 평균선 변수를 조정하여 최적의 변수 조합을 찾습니다.
- 양에너지 지표와 같은 필터링 조건을 추가하여 잘못된 신호를 줄인다.
- 정지 손해 차단 설정 최적화
- 다른 지표들과 함께 추세를 판단하는 방법
요약하다
동적 평선 교차 전략은 전반적인 효과가 좋으며, 변수 최적화를 조정하여 전략의 성능을 더욱 향상시킬 수 있다. 이 전략은 쉽게 구현할 수 있으며 초보자 실무 연습에 적합하다. 그러나 잘못된 신호를 발생시킬 위험도 주의해야 하며, 다른 지표의 보조를 통해 효과를 판단하는 것이 더 좋다.
/*backtest
start: 2024-01-01 00:00:00
end: 2024-01-31 00:00:00
period: 1h
basePeriod: 15m
exchanges: [{"eid":"Futures_Binance","currency":"BTC_USDT"}]
*/

//@version=5
strategy("Simple Moving Average Crossover", shorttitle="SMAC", overlay=true)

// Define input parameters
fast_length = input.int(9, title="Fast MA Length")
slow_length = input.int(21, title="Slow MA Length")
stop_loss = input.float(1, title="Stop Loss (%)", minval=0, maxval=100)
take_profit = input.float(2, title="Take Profit (%)", minval=0, maxval=100)

// Calculate moving averages
fast_ma = ta.sma(close, fast_length)
slow_ma = ta.sma(close, slow_length)

// Define conditions for long and short signals
long_condition = ta.crossover(fast_ma, slow_ma)
short_condition = ta.crossunder(fast_ma, slow_ma)

// Plot moving averages on the chart
plot(fast_ma, title="Fast MA", color=color.blue)
plot(slow_ma, title="Slow MA", color=color.red)

// Execute long and short trades
if (long_condition)
    strategy.entry("Long", strategy.long)
if (short_condition)
    strategy.entry("Short", strategy.short)

// Set stop loss and take profit levels
stop_loss_price = close * (1 - stop_loss / 100)
take_profit_price = close * (1 + take_profit / 100)
strategy.exit("Take Profit/Stop Loss", stop=stop_loss_price, limit=take_profit_price)

// Plot signals on the chart
plotshape(series=long_condition, title="Buy Signal", location=location.belowbar, color=color.green, style=shape.triangleup, size=size.small)
plotshape(series=short_condition, title="Sell Signal", location=location.abovebar, color=color.red, style=shape.triangledown, size=size.small)