이 전략은 쌍용 이동 평균과 RSI 지표를 종합적으로 사용하여 다공간 교차 거래 전략을 구축합니다. 이 전략은 중장선 추세를 포착 할 수 있으며, 단선 지표를 사용하여 불필요한 흔들림을 피할 수 있습니다.
전략 원칙
이 전략은 두 가지 이동 평균을 사용한다. 즉, 빠른 이동 평균 ((EMA 59 및 EMA 82) 및 느린 이동 평균 ((EMA 96 및 EMA 95)). 가격이 아래에서 위로 빠른 이동 평균을 넘어서면 더 많은 것을 하고, 가격이 위에서 아래로 빠른 이동 평균을 넘어서면 더 많은 것을 하지 않는다. 동시에 RSI 지표의 오버 바이 오버 소지 지역은 거래 신호와 스톱을 확인하기 위해 사용된다.
구체적으로, 빠른 EMA가 천천히 EMA를 상향으로 돌파할 때 다단 신호를 생성한다. 이 때 RSI가 30보다 낮으면 (오버셀 지역) 다단 입장이 수행된다. 빠른 EMA가 느린 EMA를 상향으로 돌파할 때 공백 신호를 생성한다. 이 때 RSI가 70보다 높으면 (오버빌 지역) 공백 입장이 수행된다.
이중 이동 평균을 사용하는 것의 장점은 중장선 트렌드의 변화를 더 잘 식별할 수 있다는 것입니다. RSI 지표는 일부 가짜 돌파구로 인한 잡음 거래를 필터링 할 수 있습니다.
전략적 이점
- 이중 이동 평균을 사용하여 중장선 트렌드를 캡처합니다.
- RSI 지표 필터링 잡음 거래
- 트렌드 따라와 반전 거래
- 거래 논리는 간단하고 명확합니다.
위험 분석
- 이동 평균이 생성된 거래 신호는 큰 파동 시장에서 속일 수 있습니다.
- RSI 지표는 특정 시장 상황에서도 효과가 없습니다.
- 스톱포인트 설정은 신중해야 하며 너무 느슨하거나 긴박하지 않도록 해야 합니다.
전략 최적화 방향
- 더 긴 주기를 테스트하는 이동 평균 조합
- 다른 변수 조정을 시도합니다. 예를 들어 RSI가 하향/ 하향으로 변하는 것
- 거래량 지표와 같은 추가 필터링 조건을 추가합니다.
- ATR과 같은 지표의 동적 상쇄와 결합된 최적화된 상쇄 전략
요약하다
이 전략은 쌍 EMA가 거래 신호의 유효성 및 손실을 확인하기 위해 사용되는 RSI를 추적하는 중간에 긴 트렌드 방향을 추적합니다. 이것은 간단하고 실용적인 다중 포지션 교차 전략이며, 매개 변수를 조정하고 최적화하여 다른 시장 환경에 적응 할 수 있습니다.
전략 소스 코드
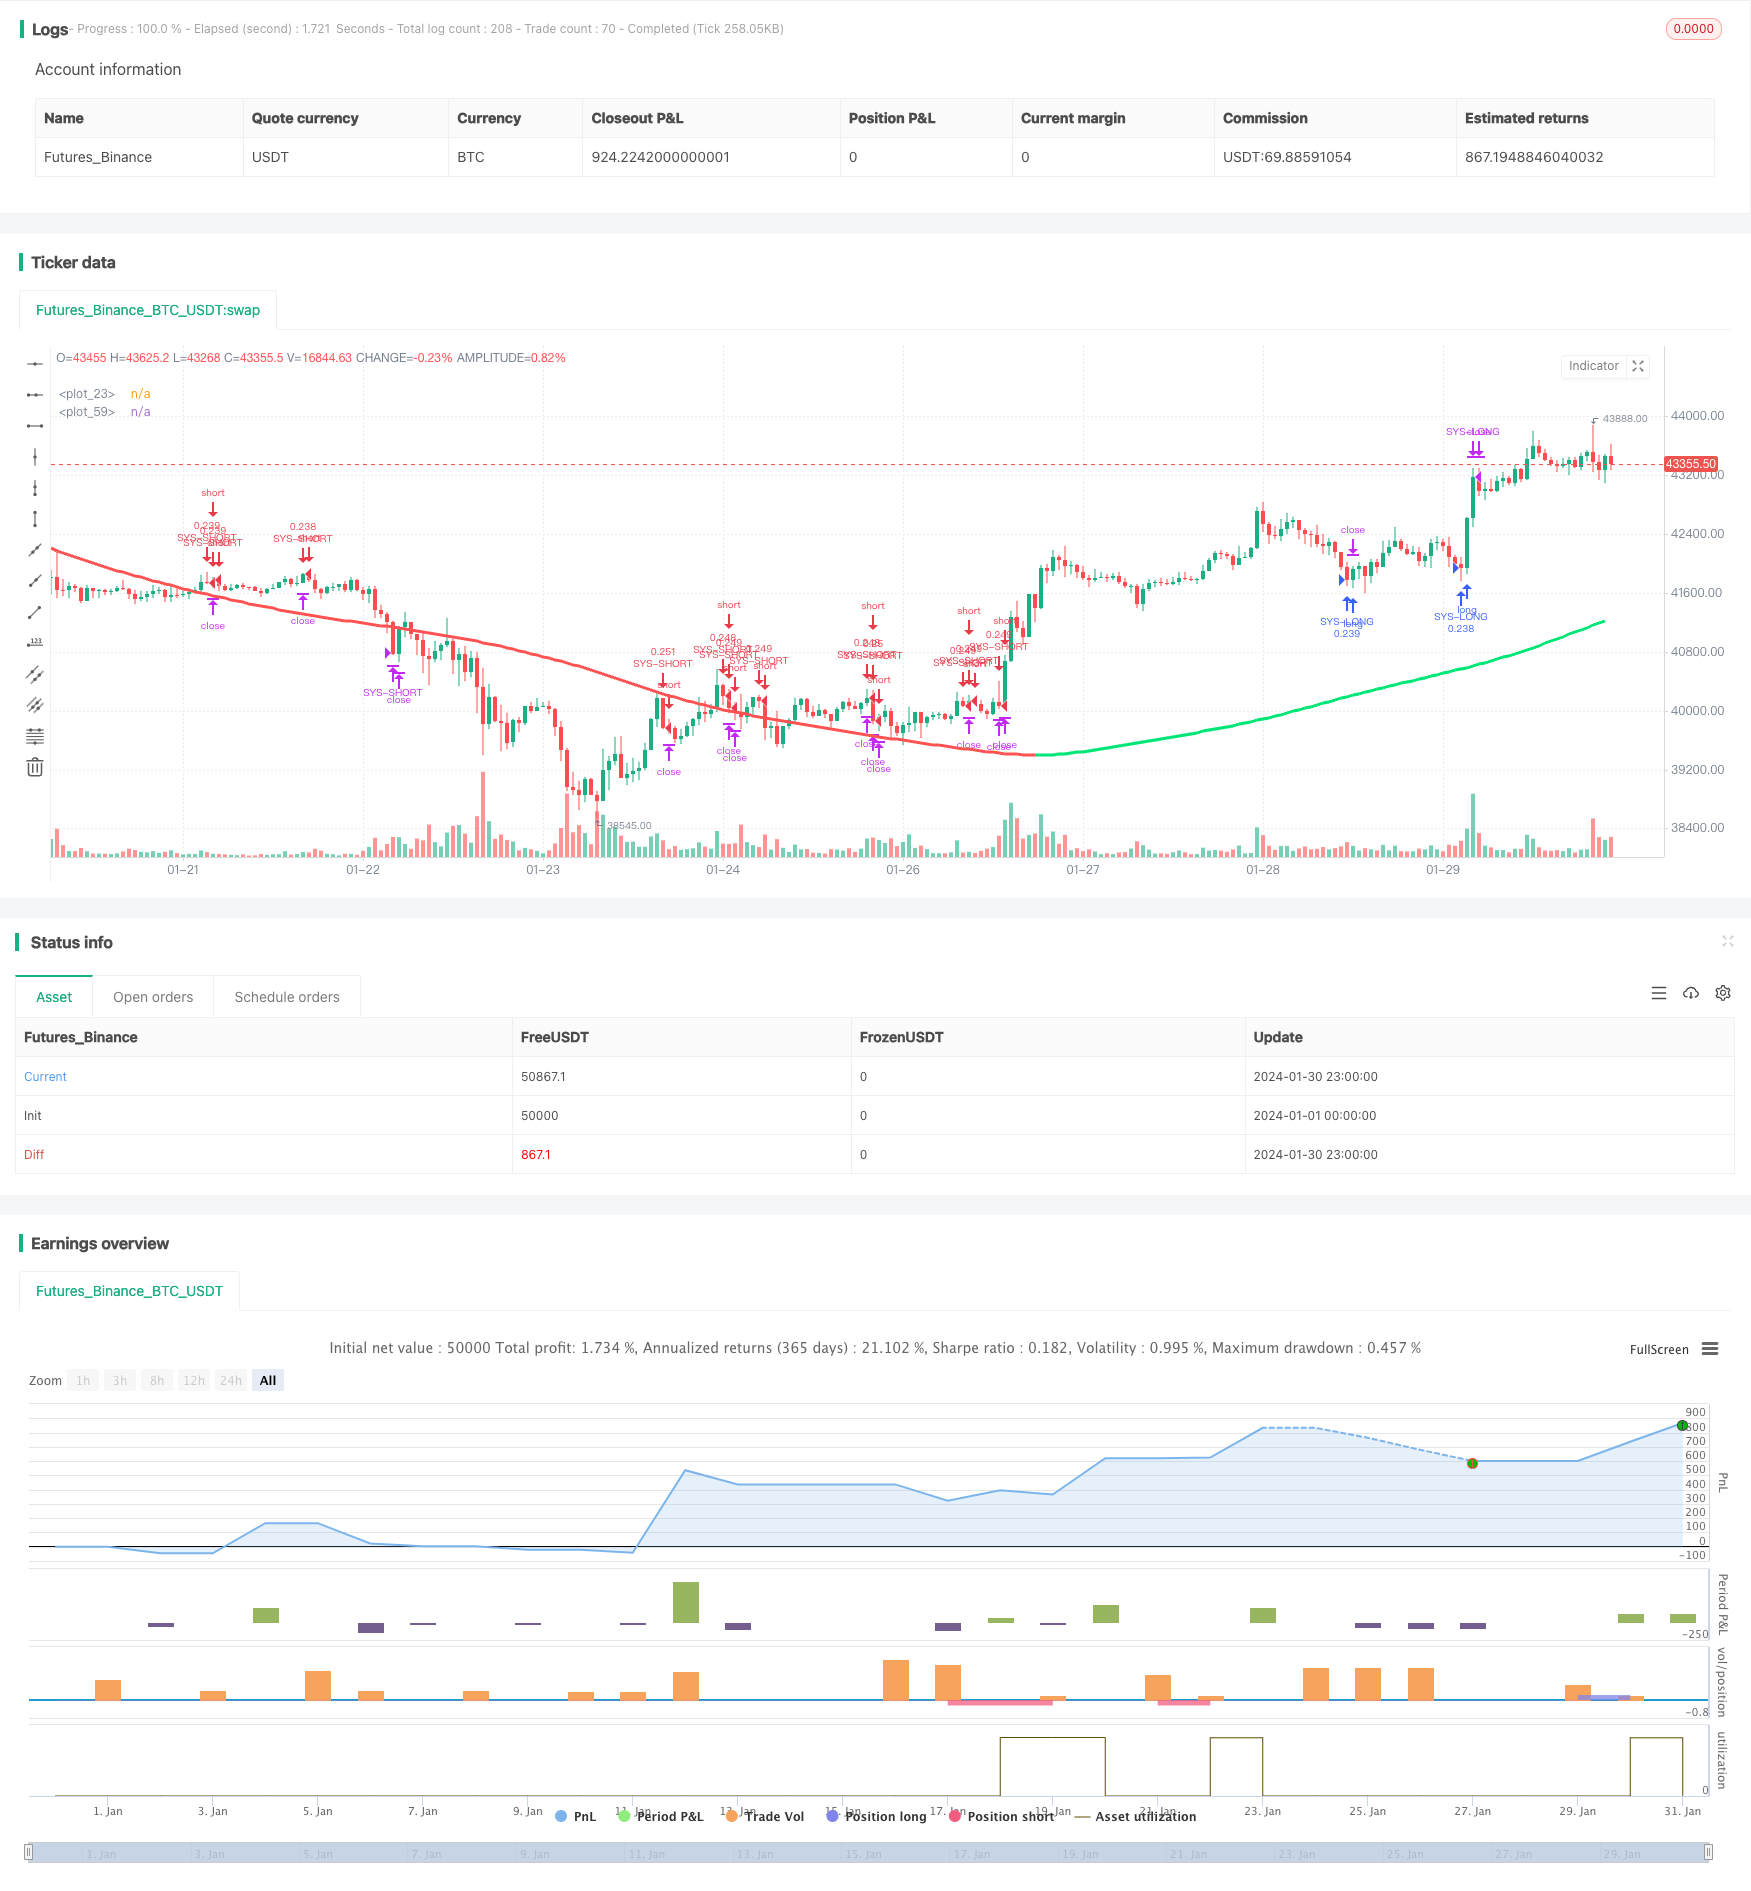
/*backtest
start: 2024-01-01 00:00:00
end: 2024-01-31 00:00:00
period: 1h
basePeriod: 15m
exchanges: [{"eid":"Futures_Binance","currency":"BTC_USDT"}]
*/

//@version=2
strategy("Swing Hull/rsi/EMA Strategy", overlay=true,default_qty_type=strategy.cash,default_qty_value=10000,scale=true,initial_capital=10000,currency=currency.USD)

//A Swing trading strategy that use a combination of indicators, rsi for target, hull for overall direction enad ema for entering the martket.
// hull ma copied from syrowof HullMA who copied from mohamed982 :) thanks both
// Performance

n=input(title="period",defval=500)

n2ma=2*wma(close,round(n/2))
nma=wma(close,n)
diff=n2ma-nma
sqn=round(sqrt(n))

n2ma1=2*wma(close[1],round(n/2))
nma1=wma(close[1],n)
diff1=n2ma1-nma1
sqn1=round(sqrt(n))

n1=wma(diff,sqn)
n2=wma(diff1,sqn)
c=n1>n2?green:red
ma=plot(n1,color=c)


// RSi and Moving averages

length = input( 14 )
overSold = input( 70)
overBought = input( 30)
point = 0.0001
dev= 2

fastLength = input(59)
fastLengthL = input(82)
slowLength = input(96)
slowLengthL = input(95)
price = close

mafast = ema(price, fastLength)
mafastL= ema(price, fastLengthL)
maslow = ema(price, slowLength)
maslowL = ema(price, slowLengthL)
vrsi = rsi(price, length)
cShort =  (crossunder(vrsi, overBought))

condDown = n2 >= n1
condUp = condDown != true
closeLong =  (crossover(vrsi, overSold))
closeShort = cShort


// Strategy Logic
longCondition = n1> n2
shortCondition = longCondition != true

col =condUp ? lime : condDown ? red : yellow
plot(n1,color=col,linewidth=3)


if (not na(vrsi))
    if shortCondition
        if (price[0] < maslow[0] and price[1] > mafast[1]) //cross entry
            strategy.entry("SYS-SHORT", strategy.short, comment="short")
strategy.close("SYS-SHORT", when=closeShort) //output logic

if (not na(vrsi))
    if longCondition // swing condition
        if (price[0] < mafast[0] and price[1] > mafast[1]) //cross entry
            strategy.entry("SYS-LONG", strategy.long, comment="long")
strategy.close("SYS-LONG", when=closeLong) //output logic


// Stop Loss


sl = input(75)
Stop = sl * 10
Q = 100


strategy.exit("Out Long", "SYS-LONG", qty_percent=Q, loss=Stop)
strategy.exit("Out Short", "SYS-SHORT", qty_percent=Q, loss=Stop)


//plot(strategy.equity, title="equity", color=red, linewidth=2, style=areabr)