개요
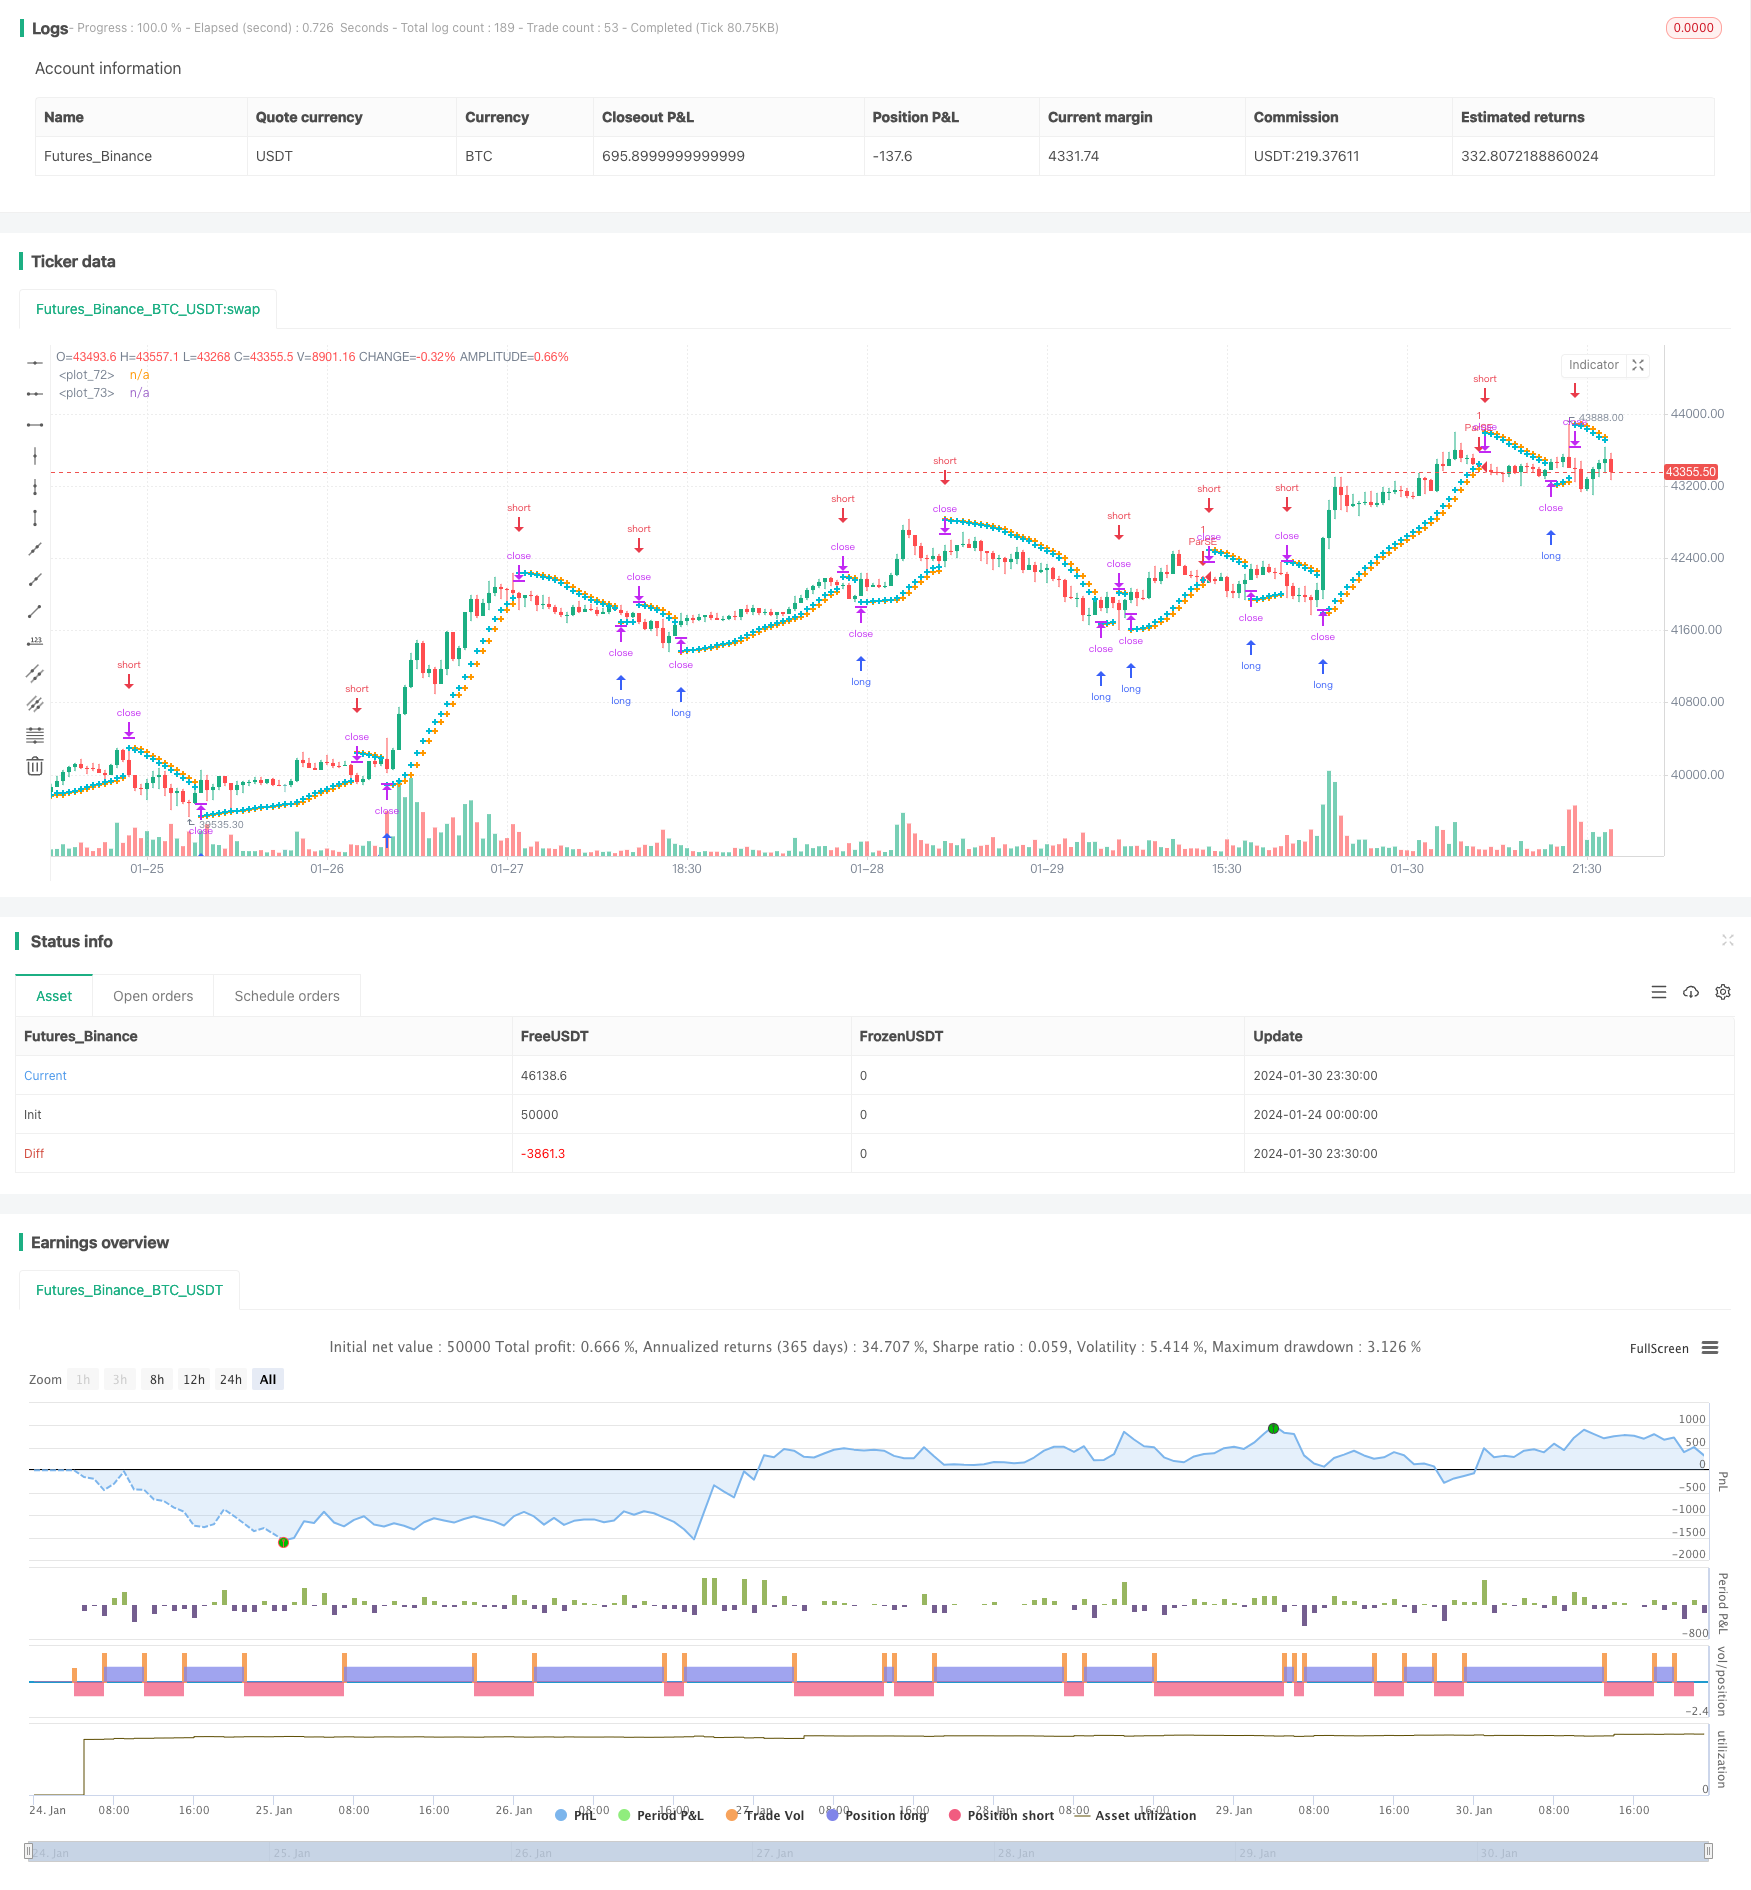
트렌드 추적 스톱 로드 반전 전략은 Parabolic SAR 지표를 사용하여 트렌드를 식별하고 트렌드가 반전되면 반전 입장에 들어가는 전략이다. 이 전략은 동시에 스톱 로드 및 스톱 스톱 메커니즘을 결합하여 위험을 제어한다.
전략 원칙
이 전략은 Parabolic SAR 지표를 사용하여 현재 시장의 추세를 판단한다. Parabolic SAR full name is Parabolic Stop and Reverse, 즉 파러볼릭 라인 중지 손실 반전이다. 그것의 지표선은 가격 그래프에서 파러볼릭 라인 시리즈와 같으며, 파러볼릭 라인 지점은 가능한 반전 지점을 나타냅니다.
SAR점이 떨어지고 가격보다 낮으면 부진을 나타냅니다. SAR점이 올라고 가격보다 높으면 하향을 나타냅니다. 이 전략은 SAR점의 위치에 따라 현재 트렌드 방향을 판단하는 것입니다.
구체적으로, SAR점이 상승 추세에 있고 가격보다 높을 때, 전략은 포지션을 채운다. SAR점이 하향 추세에 있고 가격보다 낮을 때, 전략은 포지션을 채운다. 즉, SAR점이 트렌드 반전을 표시할 때 반전 포지션에 들어간다.
또한, 이 전략은 중지 손실 및 중지 메커니즘을 설정한다. 너무 많이 할 때, 손실을 제한하기 위해 중지 손실 가격을 설정할 수 있다. 또한, 목표 수익을 달성 한 후에 청산 할 수 있도록 중지 가격을 설정할 수 있다.
우위 분석
이 전략은 트렌드 지표와 중지/정지 메커니즘을 결합하여 다음과 같은 주요 장점을 가지고 있습니다.
- 트렌드 반전의 기회를 잡을 수 있고, 역전작업을 실현할 수 있다.
- 스톱로즈와 스톱을 설정하면 위험과 수익을 능동적으로 제어할 수 있다.
- Parabolic SAR는 상당히 많이 사용되는 트렌드 반전 지표이며, 효과가 더 좋다.
- 전략 규칙은 간단하고 명확하며 이해하기 쉽고 실행이 가능합니다.
위험 분석
이 전략에는 몇 가지 위험도 있습니다.
- 파라볼릭 SAR 지표는 완벽하지 않아서 가끔 잘못된 신호를 낸다.
- 스톱 또는 스톱 가격을 설정하는 것은 합리적이어야 합니다. 그렇지 않으면 너무 일찍 스톱 또는 스톱을 설정할 수 있습니다.
- 거래 수수료는 최종 수익에도 영향을 미칩니다.
- 그러나, 이러한 변화의 흐름은 짧은 기간 동안 지속될 수 있습니다.
이러한 위험에는 파라미터를 조정하여 최적화하거나 다른 지표 필터링과 협력하여 해결할 수 있습니다.
최적화 방향
이 전략은 다음과 같은 방향으로 최적화될 수 있습니다.
- Parabolic SAR의 파라미터를 최적화하여 최적의 파라미터 조합을 찾습니다.
- 다른 전략들을 시도해 보세요.
- 반전 거래 신호를 필터링하기 위해 지표 또는 조건을 추가하십시오.
- 포지션 컨트롤을 추가하여 시장 상황에 따라 포지션을 확장하거나 축소합니다.
- 다른 거래 품종에 대한 조정 매개 변수
요약하다
이 트렌드 추적 스톱 손실 반전 전략은 전체적으로 더 고전적인 거래 전략이다. 트렌드 반전을 식별하는 기능을 수행하고, 동시에 스톱 손실 및 스톱 수단으로 위험을 제어한다. 최적화하면 실적 가치가있는 전략이 될 수 있다.
/*backtest
start: 2024-01-24 00:00:00
end: 2024-01-31 00:00:00
period: 30m
basePeriod: 15m
exchanges: [{"eid":"Futures_Binance","currency":"BTC_USDT"}]
*/

//@version=4
strategy("Parabolic SAR Strategy", overlay=true)
start = input(0.02)
increment = input(0.02)
maximum = input(0.2)
var bool uptrend = na
var float EP = na
var float SAR = na
var float AF = start
var float nextBarSAR = na
if bar_index > 0
	firstTrendBar = false
	SAR := nextBarSAR
	if bar_index == 1
		float prevSAR = na
		float prevEP = na
		lowPrev = low[1]
		highPrev = high[1]
		closeCur = close
		closePrev = close[1]
		if closeCur > closePrev
			uptrend := true
			EP := high
			prevSAR := lowPrev
			prevEP := high
		else
			uptrend := false
			EP := low
			prevSAR := highPrev
			prevEP := low
		firstTrendBar := true
		SAR := prevSAR + start * (prevEP - prevSAR)
	if uptrend
		if SAR > low
			firstTrendBar := true
			uptrend := false
			SAR := max(EP, high)
			EP := low
			AF := start
	else
		if SAR < high
			firstTrendBar := true
			uptrend := true
			SAR := min(EP, low)
			EP := high
			AF := start
	if not firstTrendBar
		if uptrend
			if high > EP
				EP := high
				AF := min(AF + increment, maximum)
		else
			if low < EP
				EP := low
				AF := min(AF + increment, maximum)
	if uptrend
		SAR := min(SAR, low[1])
		if bar_index > 1
			SAR := min(SAR, low[2])
	else
		SAR := max(SAR, high[1])
		if bar_index > 1
			SAR := max(SAR, high[2])
	nextBarSAR := SAR + AF * (EP - SAR)
	if barstate.isconfirmed
		if uptrend
			strategy.entry("ParSE", strategy.short, stop=nextBarSAR, comment="ParSE")
			strategy.cancel("ParLE")
		else
			strategy.entry("ParLE", strategy.long, stop=nextBarSAR, comment="ParLE")
			strategy.cancel("ParSE")
plot(SAR, style=plot.style_cross, linewidth=3, color=color.orange)
plot(nextBarSAR, style=plot.style_cross, linewidth=3, color=color.aqua)
//Stop Loss Inputs
use_short_stop_loss = input(false, title="Short Stop Loss", group="Stop Loss and Take Profit", inline="Short_SL")
short_stop_loss = input(title="(%)", type=input.float, minval=0.0, step=0.1,
     defval=5, group="Stop Loss and Take Profit", inline="Short_SL") * 0.01
use_long_stop_loss = input(false, title="Long Stop Loss", group="Stop Loss and Take Profit", inline="Long_SL")
long_stop_loss = input(title="(%)", type=input.float, minval=0.0, step=0.1,
     defval=5, group="Stop Loss and Take Profit", inline="Long_SL") * 0.01

//Take Profit Inputs
use_short_take_profit = input(false, title="Short Take Profit", group="Stop Loss and Take Profit", inline="Short_TP")
short_take_profit = input(title="(%)", type=input.float, minval=0.0, step=0.1,
     defval = 20, group="Stop Loss and Take Profit", inline="Short_TP") * .01
use_long_take_profit = input(false, title="Long Take Profit", group="Stop Loss and Take Profit", inline="Long_TP")
long_take_profit = input(title="(%)", type=input.float, minval=0.0, step=0.1,
     defval = 20, group="Stop Loss and Take Profit", inline="Long_TP") * .01


longStopPrice  = strategy.position_avg_price * (1 - long_stop_loss)
shortStopPrice = strategy.position_avg_price * (1 + short_stop_loss)
longLimitPrice = strategy.position_avg_price * (1 + long_take_profit)
shortLimitPrice = strategy.position_avg_price * (1 - short_take_profit)


if (strategy.position_size > 0.0)
    if (use_long_stop_loss and not use_long_take_profit)
        strategy.exit("Long", stop = longStopPrice)
    if (use_long_take_profit and not use_long_stop_loss)
        strategy.exit("Long", limit = longLimitPrice)
    if (use_long_take_profit and use_long_stop_loss)
        strategy.exit("Long", stop = longStopPrice, limit=longLimitPrice)
if (strategy.position_size < 0.0)
    if (use_short_stop_loss and not use_short_take_profit)
        strategy.exit("Short", stop = shortStopPrice)
    if (use_short_take_profit and not use_short_stop_loss)
        strategy.exit("Short", limit = shortLimitPrice)
    if (use_short_take_profit and use_short_stop_loss)
        strategy.exit("Short", stop = shortStopPrice, limit = shortLimitPrice)

//plot(strategy.equity, title="equity", color=color.red, linewidth=2, style=plot.style_areabr)