VRSI 대 MARSI 전략


생성 날짜: 2024-02-02 17:21:09 마지막으로 수정됨: 2024-02-02 17:21:09
복사: 0 클릭수: 970
avatar of ChaoZhang ChaoZhang
1
집중하다
1617
수행원

VRSI 대 MARSI 전략

개요

VRSI와 MARSI 전략은 이동 평균을 사용하여 RSI 지표를 평형화하여 이중 지표 전략을 구현합니다. 이 전략은 가격의 RSI 지표와 거래량의 RSI 지표를 동시에 사용하여 이동 평균과 결합하여 거래 신호를 생성합니다. 가격의 RSI 지표가 상승하면 더하고 가격의 RSI 지표가 떨어지면 공백합니다. 동시에 거래량의 RSI 지표의 변화를 관찰하여 시장의 힘과 가능한 추세 변화를 판단합니다.

전략 원칙

이 전략은 우선 가격의 9주기 RSI 지표 ((RSI) 와 거래량의 9주기 RSI 지표 ((VRSI) 를 계산한다. 그리고 이 두 RSI 지표의 5주기 간단한 이동 평균 ((MARSI와 MAVRSI) 을 계산한다.

거래 신호는 MARSI 지표에 기초하여 생성됩니다. MARSI가 상승할 때 더하고, MARSI가 떨어질 때 비어 있습니다. 또한, MAVRSI 지표는 시장의 힘과 가능한 경향 변화를 판단하는 데 사용됩니다.

예를 들어, 다목적 거래에서 가격이 계속 상승하지만 거래량이 감소하면 다목적 힘이 약화 될 수 있음을 나타냅니다. 반대로, 공수 거래에서 가격이 계속 떨어지지만 거래량이 증가하면 공수 힘이 강화된다는 것을 나타냅니다.

우위 분석

이 전략은 쌍 RSI 지표의 이동 평균을 결합하여 트렌드를 효과적으로 포착할 수 있으며 거래량 변화를 사용하여 시장의 힘을 판단하여 포착되는 것을 피합니다. 단일 RSI 지표에 비해 이 전략은 시장의 리듬을 더 정확하게 파악할 수 있습니다.

이동 평균의 사용은 또한 잡음 일부를 필터링하여 신호를 더 신뢰할 수있게 만듭니다. 또한 RSI 주기와 이동 평균 주기와 같은 다른 매개 변수의 설정은 전략의 최적화를 가능하게합니다.

위험 분석

이 전략의 가장 주요한 위험은 이중 지표 사이에 오차가 발생할 수 있다는 것입니다. 가격과 거래량 사이에 오차가 발생하면 거래 신호도 덜 신뢰할 수 있습니다. 이 때 지표 사이의 관계를 인위적으로 판단해야합니다.

또 다른 위험은 수직으로 정리할 때 RSI 지표가 위아래로 조정될 때 RSI 지표가 위아래로 조정될 때 RSI 지표가 위아래로 조정될 때 RSI 지표가 위아래로 조정될 때 RSI 지표가 위아래로 조정될 때 RSI 지표가 위아래로 조정될 때 RSI 지표가 위아래로 조정될 때

최적화 방향

이 전략은 다음과 같은 부분에서 최적화될 수 있습니다.

  1. RSI와 이동 평균의 변수를 조정하여 최적의 조합을 찾습니다.

  2. 거래 신호를 생성할 때 다른 조건 판단을 추가합니다. 예를 들어, RSI 지표가 오버 바이 오버 셀 영역에서 촉발되는 반전 신호의 신뢰성이 높습니다.

  3. 손해 중지 전략을 추가하고 이동 손해 중지 또는 지표 손해 중지 설정

  4. K선 형태, 변동률 지표 등과 같은 다른 지표와 결합하여 포착을 피합니다.

요약하다

VRSI와 MARSI 전략은 가격과 거래량의 RSI 지표를 성공적으로 결합하여 쌍 지표 간의 비교와 판단을 통해 신호의 정확성과 수익률을 향상시킬 수 있습니다. 최적화된 매개 변수 설정과 스톱 손실 전략은 또한 안정적인 운영을 가능하게합니다.
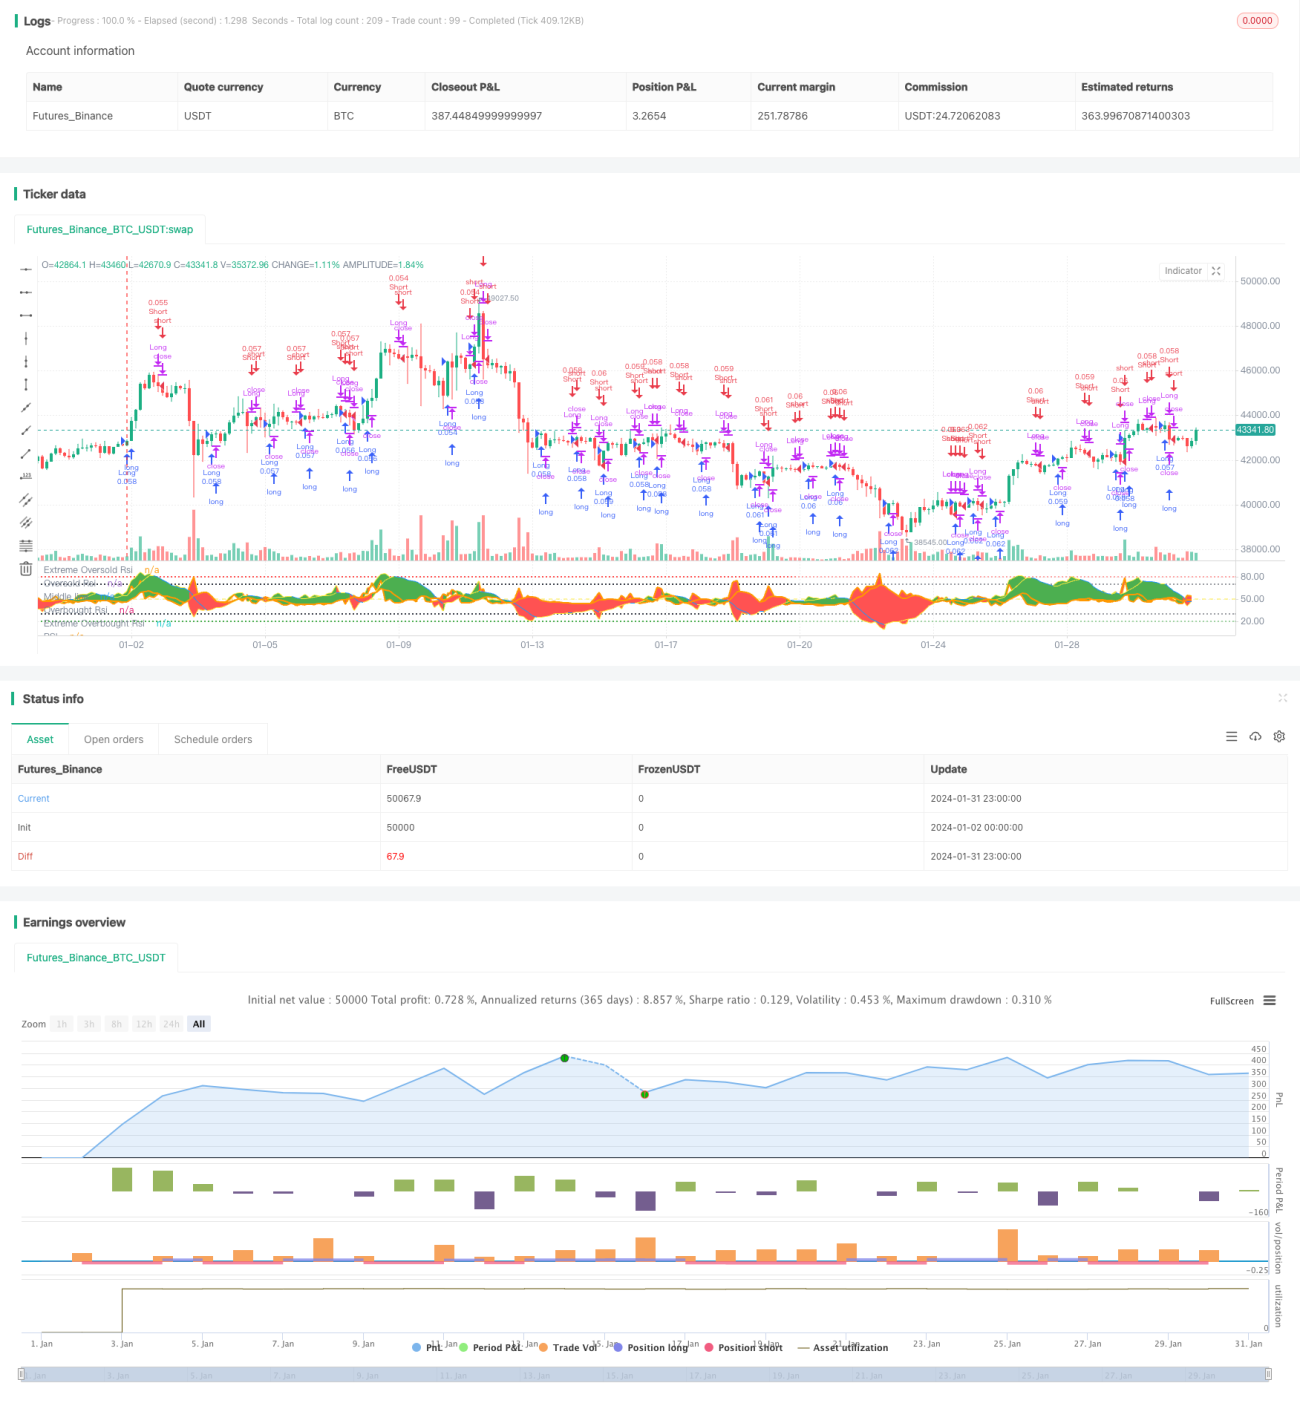
전략 소스 코드
/*backtest
start: 2024-01-02 00:00:00
end: 2024-02-01 00:00:00
period: 3h
basePeriod: 15m
exchanges: [{"eid":"Futures_Binance","currency":"BTC_USDT"}]
*/

//@version=4
strategy("VRSI-MARSI Strategy", shorttitle="(V/MA)RSI Str.", overlay=false, default_qty_type=strategy.percent_of_equity, calc_on_order_fills=true, calc_on_every_tick=true, pyramiding=0, default_qty_value=5, initial_capital=100)

// RSI(close, ="RSI") and RSI(Volume, ="VRSI")
src = close, len = input(9, minval=1, title="Length RSI")
src2 = volume, len2 = input(9, minval=1, title="Length VRSI)")
up = rma(max(change(src), 0), len)
down = rma(-min(change(src), 0), len)
up2 = rma(max(change(src2), 0), len2)
down2 = rma(-min(change(src2), 0), len2)
rsi = down == 0 ? 100 : up == 0 ? 0 : 100 - (100 / (1 + up / down))
rsi2 = down2 == 0 ? 100 : up2 == 0 ? 0 : 100 - (100 / (1 + up2 / down2))

// MA(=Moving Average) of RSI(close, ="MARSI") and RSI(Volume, ="MAVRSI")
len3 = input(5, minval=1, title="Length MARSI")
marsi = sma(rsi, len3)
len4 = input(5, minval=1, title="Length MAVRSI")
marsi2 = sma(rsi2, len4)

// Plot: 
// Default plot of RSI and VRSI: not visible but can be made visible
// Default plot MARSI and MAVRSI: visible
p1 = plot(rsi, linewidth=2, transp=100, color=color.yellow, title="RSI")
p2 = plot(rsi2, linewidth=2, transp=100, color=color.orange, title="VRSI")
m1 = plot(marsi, color=(marsi>=0 ? (marsi[1] < marsi ? color.yellow : color.blue) : (marsi[1] < marsi ? color.yellow : color.blue) ), linewidth = 2, transp = 0, title="MARSI")
m2 = plot(marsi2, color=color.orange, linewidth = 2, transp = 0, title="MAVRSI")

// Color fill:
// Default color fill "RSI - VRSI": not visible but can be made visible
// Default color fill "MARSI - MAVRSI": visible
fill(p1,p2, color = rsi>rsi2 ? color.green : color.red, transp=100, title="BG RSI-VRSI")
fill(m1,m2, color = marsi>marsi2 ? color.green : color.red, transp=75, title="BG MARSI-MAVRSI")

// Lines:
h2=hline(20, color=color.green, linestyle=hline.style_dotted, title="Extreme Oversold Rsi")
h3=hline(30, color=color.black, linestyle=hline.style_dotted, title="Oversold Rsi")
h5=hline(50, color=color.yellow, linestyle=hline.style_dashed, title="Middle line")
h7=hline(70, color=color.black, linestyle=hline.style_dotted, title="Overbought Rsi")
h8=hline(80, color=color.red, linestyle=hline.style_dotted, title="Extreme Overbought Rsi")

// Color fill between Lines "20-30" and "70-80" represents the crossing of "MARSI" and "MAVRSI":
fill(h2, h3, color=(marsi2 > marsi ? color.red : color.green), transp=80, title="20-30 BG color X MARSI/MAVRSI")
fill(h7, h8, color=(marsi2 > marsi ? color.red : color.green), transp=80, title="70-80 BG color X MARSI/MAVRSI")

///Long Entry///
longCondition = marsi > marsi[1] 
if (longCondition)
    strategy.entry("Long", strategy.long)

///Long exit///
Xlong =input(true)
closeConditionLong = marsi < marsi[1] and Xlong
if (closeConditionLong)
    strategy.close("Long")

///Short Entry///
shortCondition = marsi < marsi[1] 
if (shortCondition)
    strategy.entry("Short", strategy.short)
    
///Short exit///
Xshort =input(true)
closeConditionShort = marsi > marsi[1] and Xshort
if (closeConditionShort)
    strategy.close("Short")