개요
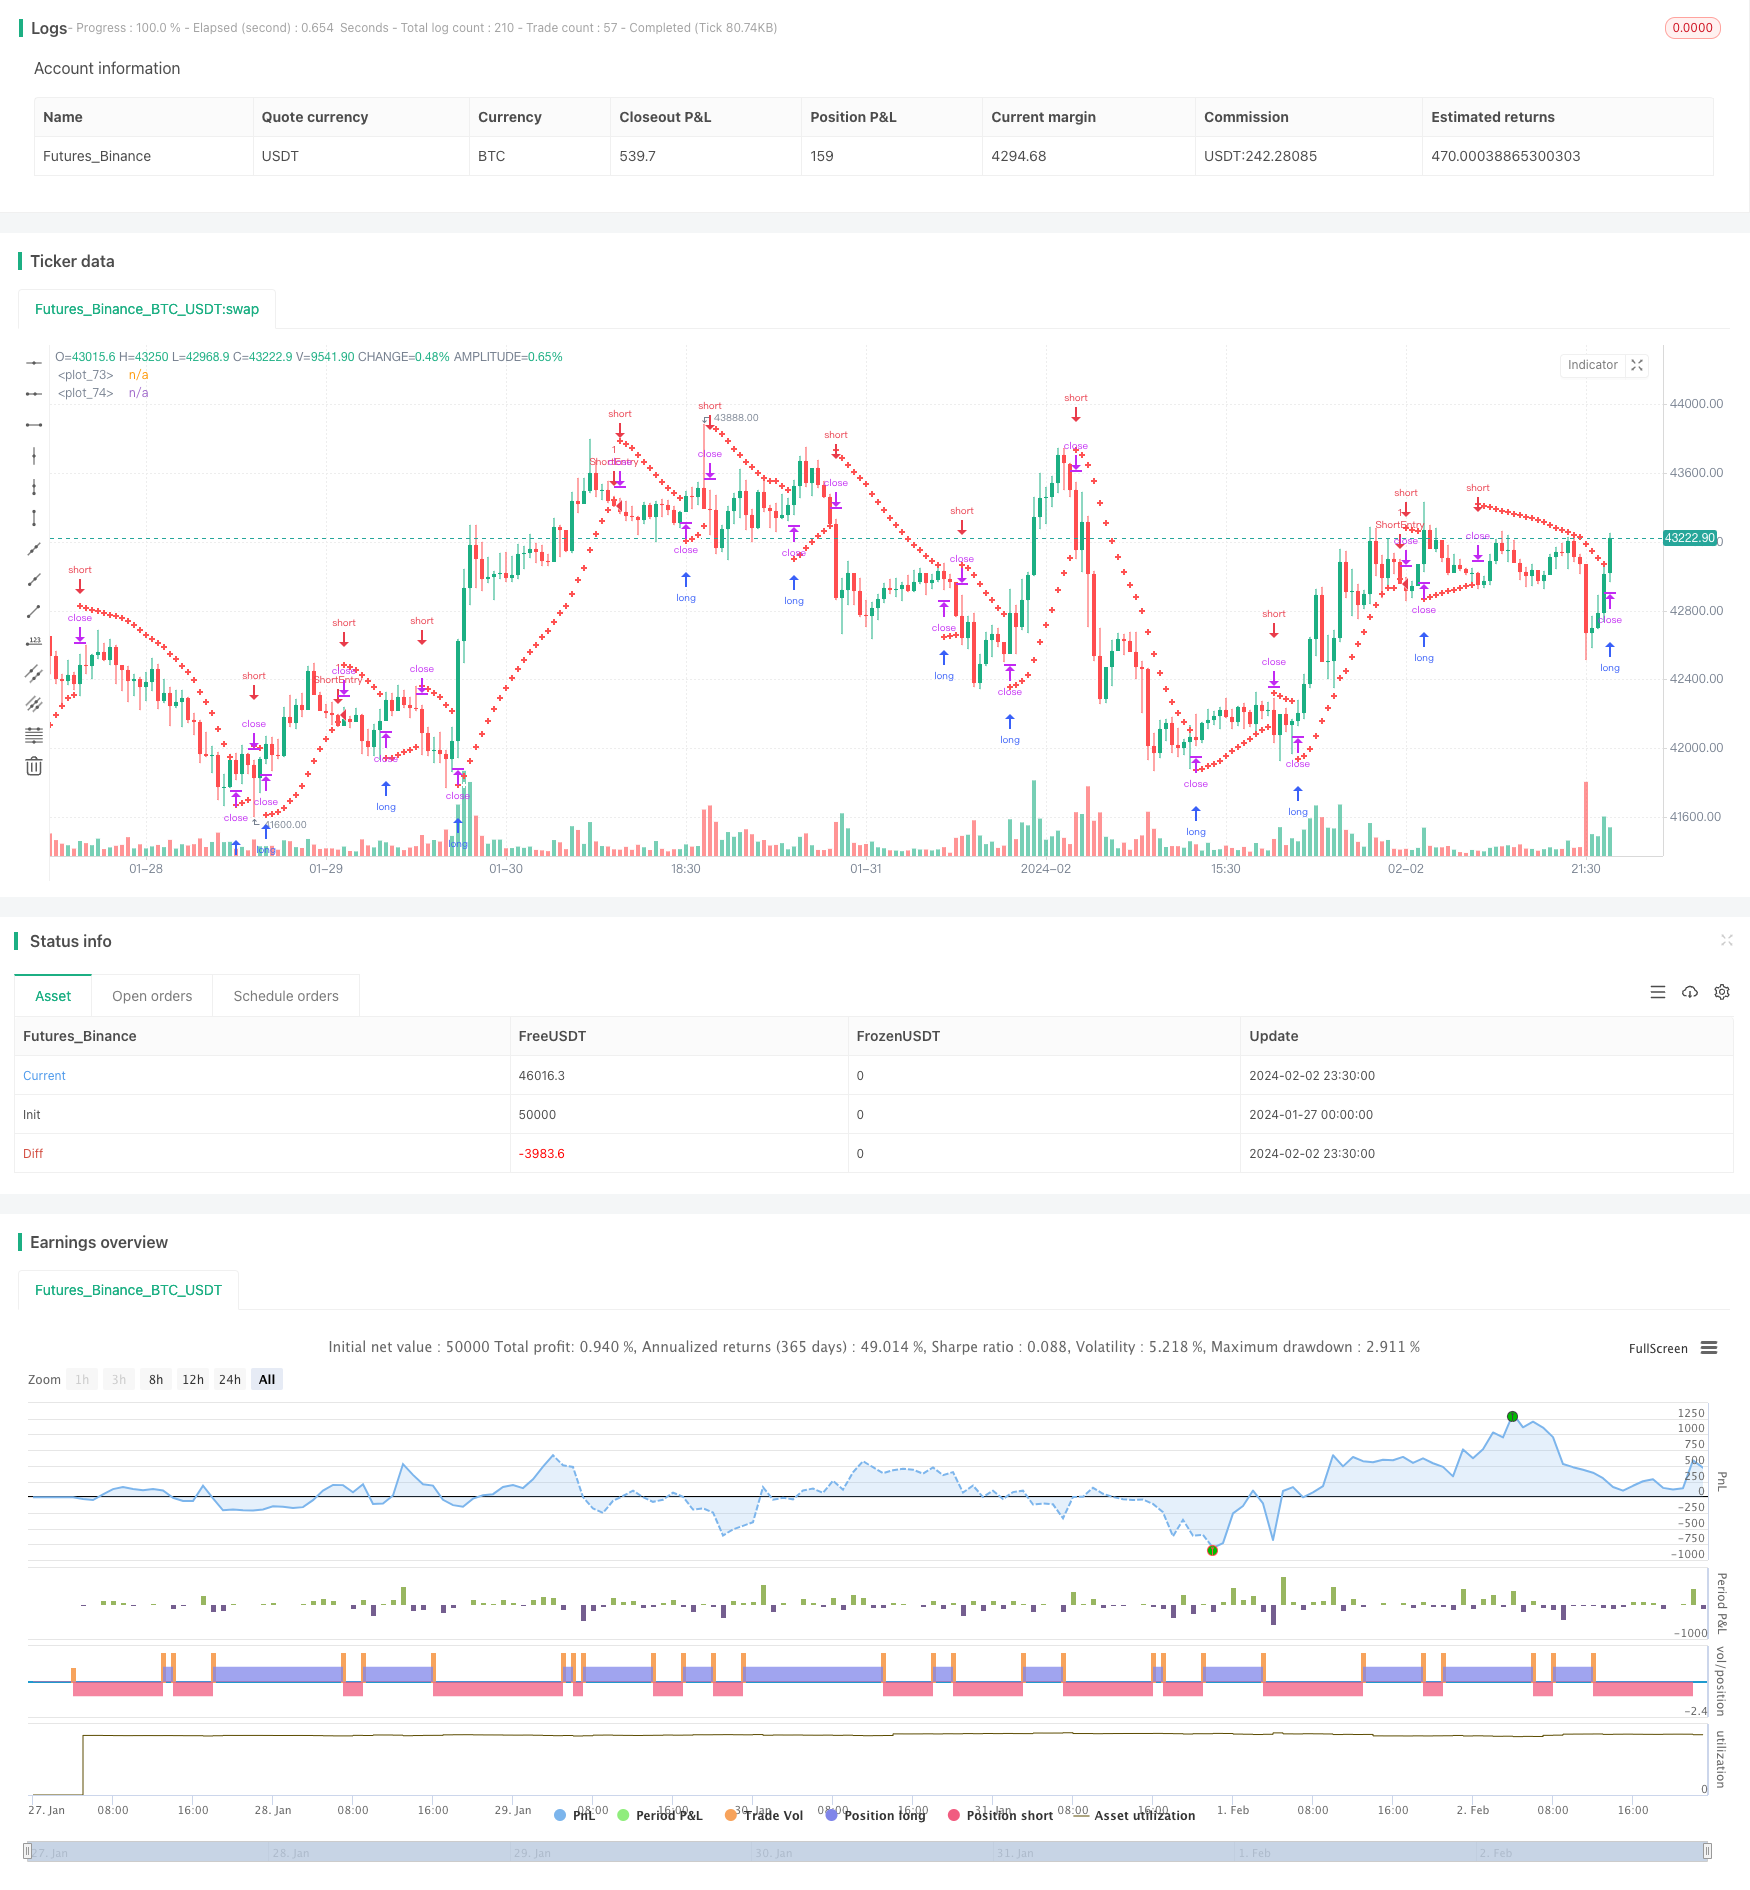
이 글은 패러볼릭 SAR 지표에 기반한 동력 역전 추적 전략에 대해 소개한다. 이 전략은 Nifty 선물 시장의 잠재적인 트렌드 역전을 식별하고 자동화된 트렌드 추적 거래를 구현하기 위해 Parabolic SAR 지표를 사용합니다.
이 전략은 주로 체계화된 거래 방법을 선호하는 거래자에게 적용되며, 명확한 상장 및 상장 신호를 제공합니다. 시장의 추세를 포착함으로써 이 전략은 거래자의 재정 목표를 달성하는 데 도움이 됩니다.
전략 원칙
이 전략은 가격 트렌드 방향을 판단하기 위해 Parabolic SAR 지표를 사용합니다. 부진 트렌드에서 SAR 값은 가격 돌파구 아래에 있으며, 새로운 최고점이 나타나면서 점차적으로 상승합니다. 부진 트렌드에서 SAR 값은 가격 돌파구 위에 있으며, 새로운 최저점이 나타나면서 점차적으로 감소합니다.
SAR 값이 상위 또는 하위 가격에 부착되면 잠재적인 트렌드 반전이 나타납니다. 이 전략은 새로운 트렌드 방향을 잡기 위해 상하 또는 초하를 수행합니다.
구체적으로, 현재 SAR 값과 가속 인자를 처음 계산한 후, 전략은 지속적으로 가격의 새로운 높은 또는 새로운 낮은 것을 추적하고, 그에 따라 SAR 값을 조정한다. 확인된 K 라인에서, 낙점 추세라면 SAR 값 아래로 적자를 하고, 낙점 추세라면 SAR 값 위에 더 많이 한다.
전략적 강점 분석
- 고전적인 지표인 Parabolic SAR를 사용하여 시장의 역전을 포착합니다.
- 명확하고 체계적인 상장 및 상장 신호를 제공합니다.
- 트렌드를 추적하여 추가적인 가격 이동을 얻을 수 있습니다.
- 자동화된 거래 시스템, 인간의 결정 없이
위험 분석
- SAR 지표는 100% 신뢰성이 떨어지고 잘못된 신호가 발생할 수 있습니다.
- 회전 실패로 인해 손실이 발생할 수 있습니다.
- 계약의 유효기간이 전략에 미치는 영향을 고려해야 합니다.
- 전략적 수익성에 대한 거래 비용의 영향을 고려해야 합니다.
전략 최적화 방향
- 최적화 SAR 지표 파라미터 (단계 길, 초기 값, 최대 값 등)
- 다른 반전 신호 지표 (RSI, MACD 등) 와 함께 반전을 판단합니다.
- 추가 조건 논리 ((거래량 등) 필터링 오류 신호
- 고정 스톱을 추적 스톱으로 조정하는 것을 고려하십시오.
- 포지션 크기를 자동으로 조정하는 것을 고려하십시오.
요약하다
이 전략은 Parabolic SAR 지표의 자동화를 활용하여 시장 추세 반전을 포착하는 거래 시스템을 제공합니다. 그것은 거래 의사 결정에 명확한 상장 및 상장 신호를 제공하여 추세를 추적하는 데 도움이됩니다. 그러나 동시에 지표의 잘못된 신호, 손실 위험과 같은 문제를 고려해야합니다. 지속적인 최적화를 통해이 전략은 신뢰할 수있는 추세 추적 방법이 될 것입니다.
/*backtest
start: 2024-01-27 00:00:00
end: 2024-02-03 00:00:00
period: 30m
basePeriod: 15m
exchanges: [{"eid":"Futures_Binance","currency":"BTC_USDT"}]
*/

//@version=5
strategy("Positional Parabolic SAR Strategy", overlay=true)
initial = input(0.02)
step = input(0.02)
cap = input(0.2)
var bool isUptrend = na
var float Extremum = na
var float SARValue = na
var float Accelerator = initial
var float futureSAR = na

if bar_index > 0
    isNewTrendBar = false
    SARValue := futureSAR
    if bar_index == 1
        float pastSAR = na
        float pastExtremum = na
        previousLow = low[1]
        previousHigh = high[1]
        currentClose = close
        pastClose = close[1]
        if currentClose > pastClose
            isUptrend := true
            Extremum := high
            pastSAR := previousLow
            pastExtremum := high
        else
            isUptrend := false
            Extremum := low
            pastSAR := previousHigh
            pastExtremum := low
        isNewTrendBar := true
        SARValue := pastSAR + initial * (pastExtremum - pastSAR)
    if isUptrend
        if SARValue > low
            isNewTrendBar := true
            isUptrend := false
            SARValue := math.max(Extremum, high)
            Extremum := low
            Accelerator := initial
    else
        if SARValue < high
            isNewTrendBar := true
            isUptrend := true
            SARValue := math.min(Extremum, low)
            Extremum := high
            Accelerator := initial
    if not isNewTrendBar
        if isUptrend
            if high > Extremum
                Extremum := high
                Accelerator := math.min(Accelerator + step, cap)
        else
            if low < Extremum
                Extremum := low
                Accelerator := math.min(Accelerator + step, cap)
    if isUptrend
        SARValue := math.min(SARValue, low[1])
        if bar_index > 1
            SARValue := math.min(SARValue, low[2])
    else
        SARValue := math.max(SARValue, high[1])
        if bar_index > 1
            SARValue := math.max(SARValue, high[2])
    futureSAR := SARValue + Accelerator * (Extremum - SARValue)
    if barstate.isconfirmed
        if isUptrend
            strategy.entry("ShortEntry", strategy.short, stop=futureSAR, comment="ShortEntry")
            strategy.cancel("LongEntry")
        else
            strategy.entry("LongEntry", strategy.long, stop=futureSAR, comment="LongEntry")
            strategy.cancel("ShortEntry")
plot(SARValue, style=plot.style_cross, linewidth=3, color=color.white)
plot(futureSAR, style=plot.style_cross, linewidth=3, color=color.red)