개요
이 전략의 주요 아이디어는 미래의 가격의 방향을 판단하기 위해 미래의 가격의 확장선을 그리고, 현재의 가격과 그 라인의 관계를 결합하는 것입니다. 가격이 확장선보다 높거나 낮을 때, 그에 따라 더 많이 또는 더 많이 할 수 있습니다.
전략 원칙
미래 가격 연장선 (Future Lines of Demarcation, FLD) 은 미래의 특정 기간 동안의 중간 가격, 최고 가격 또는 최저 가격을 나타냅니다. 이 전략은 FLD를 사용하여 가격의 미래 움직임을 판단합니다.
- 주기 길이에 따라, FLD의 이동 주기 Period, 즉 Price의 미래 가격을 계산한다.
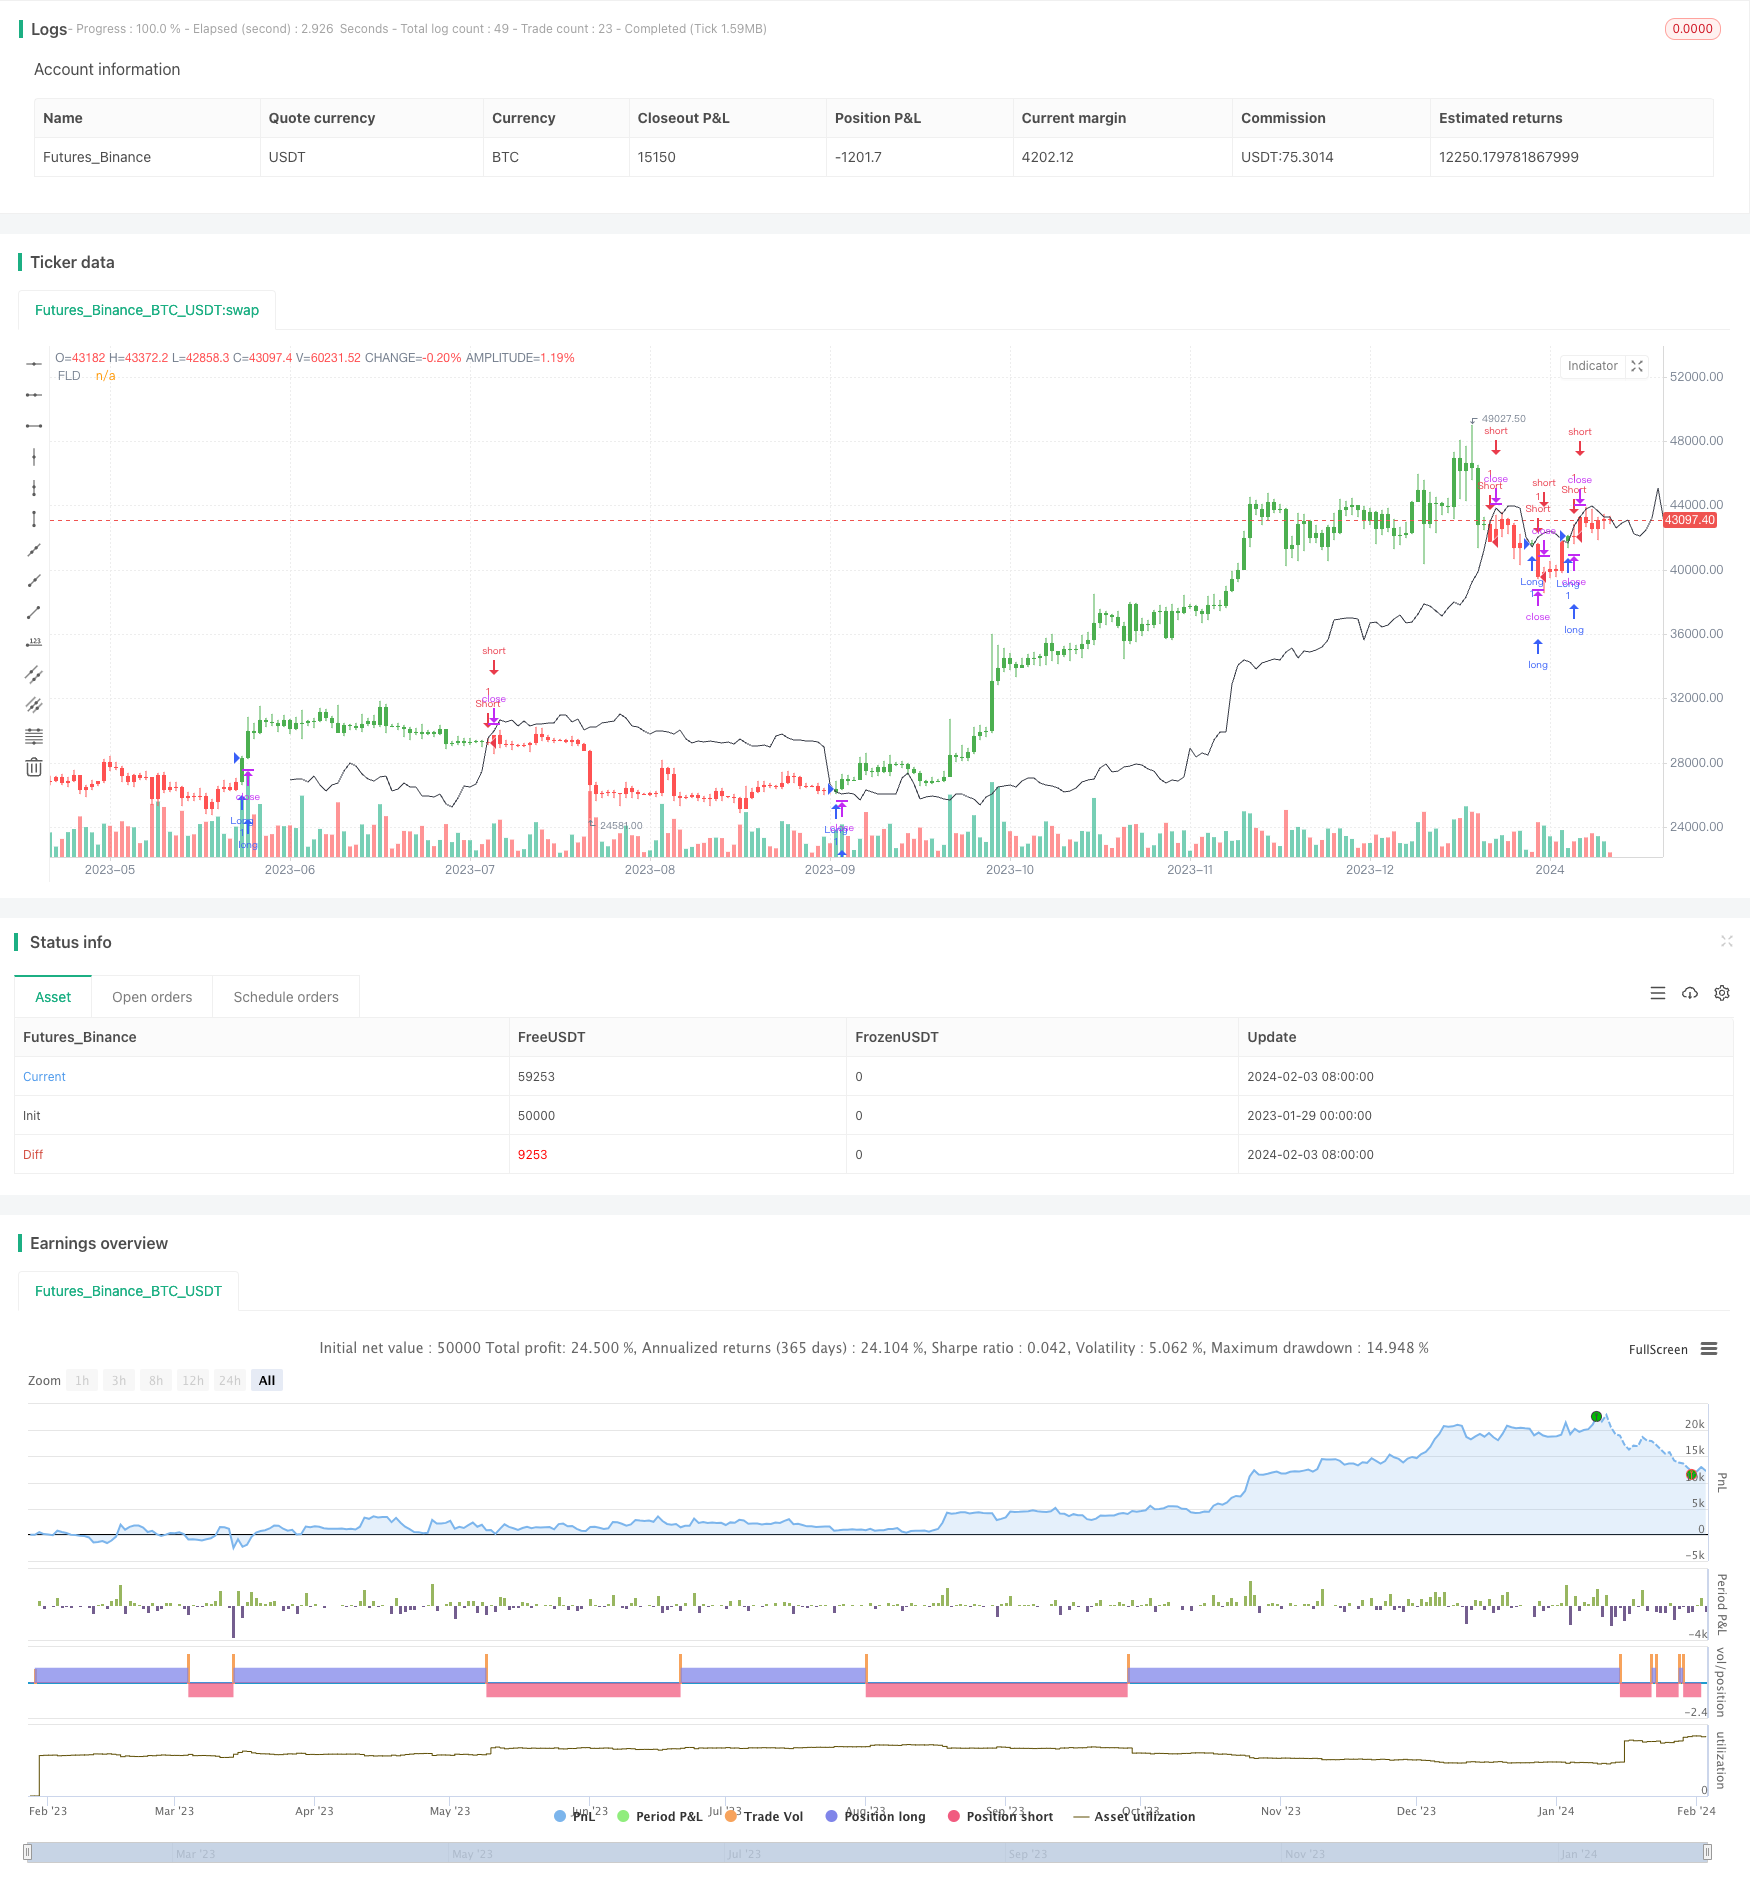
- 현재 클로즈 가격과 FLD 이동 기간 이후의 가격을 비교하십시오.
- 클로즈 가격이 FLD 미래 가격보다 낮을 때, 낙관적 신호로 판단한다.
- 클로즈 가격이 FLD 미래 가격보다 높을 때, 하향 신호로 판단한다.
- 보잉과 보잉의 신호에 따라, 그에 따른 더 많은 코카이도 작업을 수행한다.
우위 분석
이 전략의 주요 장점은 다음과 같습니다.
- FLD를 사용하여 미래의 가격 움직임을 결정하는 것은 정확도가 높습니다.
- 다양한 시장 환경에 맞는 사용자 정의 주기 파라미터
- 중간값, 최고값, 또는 최저값을 FLD 그리기 소스로 선택할 수 있으며, 적응력이 강하다.
위험 분석
이 전략의 주요 위험은 다음과 같습니다.
- FLD 자체는 오류가 발생할 수 있으며, 이는 놓친 기회 또는 잘못된 신호로 이어집니다. 다른 지표와 결합하여 판단할 수 있습니다.
- 주기 파라미터가 잘못 설정되어 너무 많은 잘못된 신호를 유발할 수 있다. 주기 길이를 최적화해야 한다.
- 갑작스러운 사건으로 인해 가격이 급격히 변동하여 FLD 예측이 실패한다. 위험을 제어하기 위해 스톱로스를 설정할 수 있다.
최적화 방향
이 전략은 다음과 같은 측면에서 최적화될 수 있습니다.
- 다른 지표의 필터링 신호와 결합하여 전략 정확도를 높인다. 예를 들어 MACD, KDJ 등이다.
- 사이클 변수를 최적화하여 최적의 변수 조합을 찾습니다.
- 단편적 손실과 수익을 통제하기 위한 손해 방지 제도를 강화한다.
- 재검토 결과에 따라, 공백 규칙을 더 많이 조정하여 잘못된 신호를 줄여줍니다.
요약하다
이 전략은 가격과 이동 후의 미래 가격 연장선을 비교하여 가격의 미래 움직임 방향을 판단하는 전형적인 트렌드 추적 전략에 속한다. 전체적으로 논리가 명확하고 이해하기 쉽고, 실행 위험은 낮다. 매개 변수 최적화 및 지표 조합을 통해 더 나은 전략 효과를 얻을 수 있다.
전략 소스 코드
/*backtest
start: 2023-01-29 00:00:00
end: 2024-02-04 00:00:00
period: 1d
basePeriod: 1h
exchanges: [{"eid":"Futures_Binance","currency":"BTC_USDT"}]
*/

//@version=2
////////////////////////////////////////////////////////////////////
//  Copyright by HPotter v1.0 15/02/2017
//  An FLD is a line that is plotted on the same scale as the price and is in fact the
//  price itself displaced to the right (into the future) by (approximately) half the
//  wavelength of the cycle for which the FLD is plotted. There are three FLD's that can be
//  plotted for each cycle:
//    An FLD based on the median price.
//    An FLD based on the high price.
//    An FLD based on the low price.
///////////////////////////////////////////////////////////////////
strategy(title="FLD's - Future Lines of Demarcation", overlay=true)
Period = input(title="Period", defval=40)
src = input(title="Source", defval=hl2)
reverse = input(false, title="Trade reverse")
FLD = src
pos = iff(FLD[Period] < close , 1,
       iff(FLD[Period] > close, -1, nz(pos[1], 0)))
possig = iff(reverse and pos == 1, -1,
         iff(reverse and pos == -1, 1, pos))
if (possig == 1)
    strategy.entry("Long", strategy.long)
if (possig == -1)
    strategy.entry("Short", strategy.short)
barcolor(possig == -1 ? red: possig == 1 ? green : blue)
plot(FLD, title="FLD", style=line, linewidth=1, color=black, offset = Period)