개요
이 전략은 LazyBear의 압축 동력 지표에 기반을 두고, 동력 필터를 추가하고, 데이터 소스를 변경하고, 리스크 관리 시스템을 추가하여, 변동성 압축 후의 가격 폭발을 포착하기 위한 사용자 정의 재측정 시간대를 추가했다.
전략 원칙
이 전략은 브린 밴드 지표와 켈트너 채널 지표를 사용하여 가격 채널을 계산하며, 가격이 채널을 뚫을 때, 변동성이 증가하는 신호로 간주한다. 그것은 라지베어의 압축 운동량 지표와 결합되어, 선형 회귀 방법을 사용하여 가격 운동량 방향을 판단한다.
전략은 동력 필터를 추가하여 동력 절대값이 마이너스를 초과할 때만 거래 신호를 냅니다. 동력 필터가 통과되면 전략은 트렌드 방향을 판단하고, 더하거나, 공백을 만듭니다. 동시에 위험을 제어하기 위해 중지 손실, 중지 중지, 추적 중지 손실을 설정합니다.
우위 분석
이 전략은 여러 지표 판단을 통합하고, 비교적 포괄적입니다. 위험 관리 장치가 추가되어 단편 손실을 제한할 수 있습니다. 변동성 압축 후 가격 추세 방향을 신속하게 판단 할 수 있습니다. 매개 변수는 사용자 정의 가능하며, 적응성이 강합니다.
위험 분석
위험은 주로 다음과 같습니다: 허위 돌파구가 잘못된 판단으로 이어집니다. 매개 변수 설정이 잘못되어 적시에 반전되지 않습니다. 돌파구로 인해 손실이 확대됩니다. 매개 변수를 최적화하고, 위험 관리 매개 변수를 조정하고, 적절한 품종과 거래 시기를 선택하여 이러한 위험을 줄일 수 있습니다.
최적화 방향
거래량 지표와 같은 다른 지표의 필터링 신호와 결합하여 고려할 수 있습니다. 동적량 절댓값을 더 정확하게 조정하십시오. 위험을 더 제어하기 위해 손실을 철회하십시오. 더 많은 품종의 데이터 효과를 테스트하십시오. 이러한 최적화는 전략을 더 안정적이고 일반화 할 수 있습니다.
요약하다
이 전략은 가격의 추세와 변동성을 더 포괄적으로 판단하고, 통합도가 높으며, 위험 제어 조치가 더 완벽하며, 최적화 방향에 따라 더 개선할 수 있으며, 변동성 압축 후 가격 폭발에 대한 강한 적응력이 있습니다.
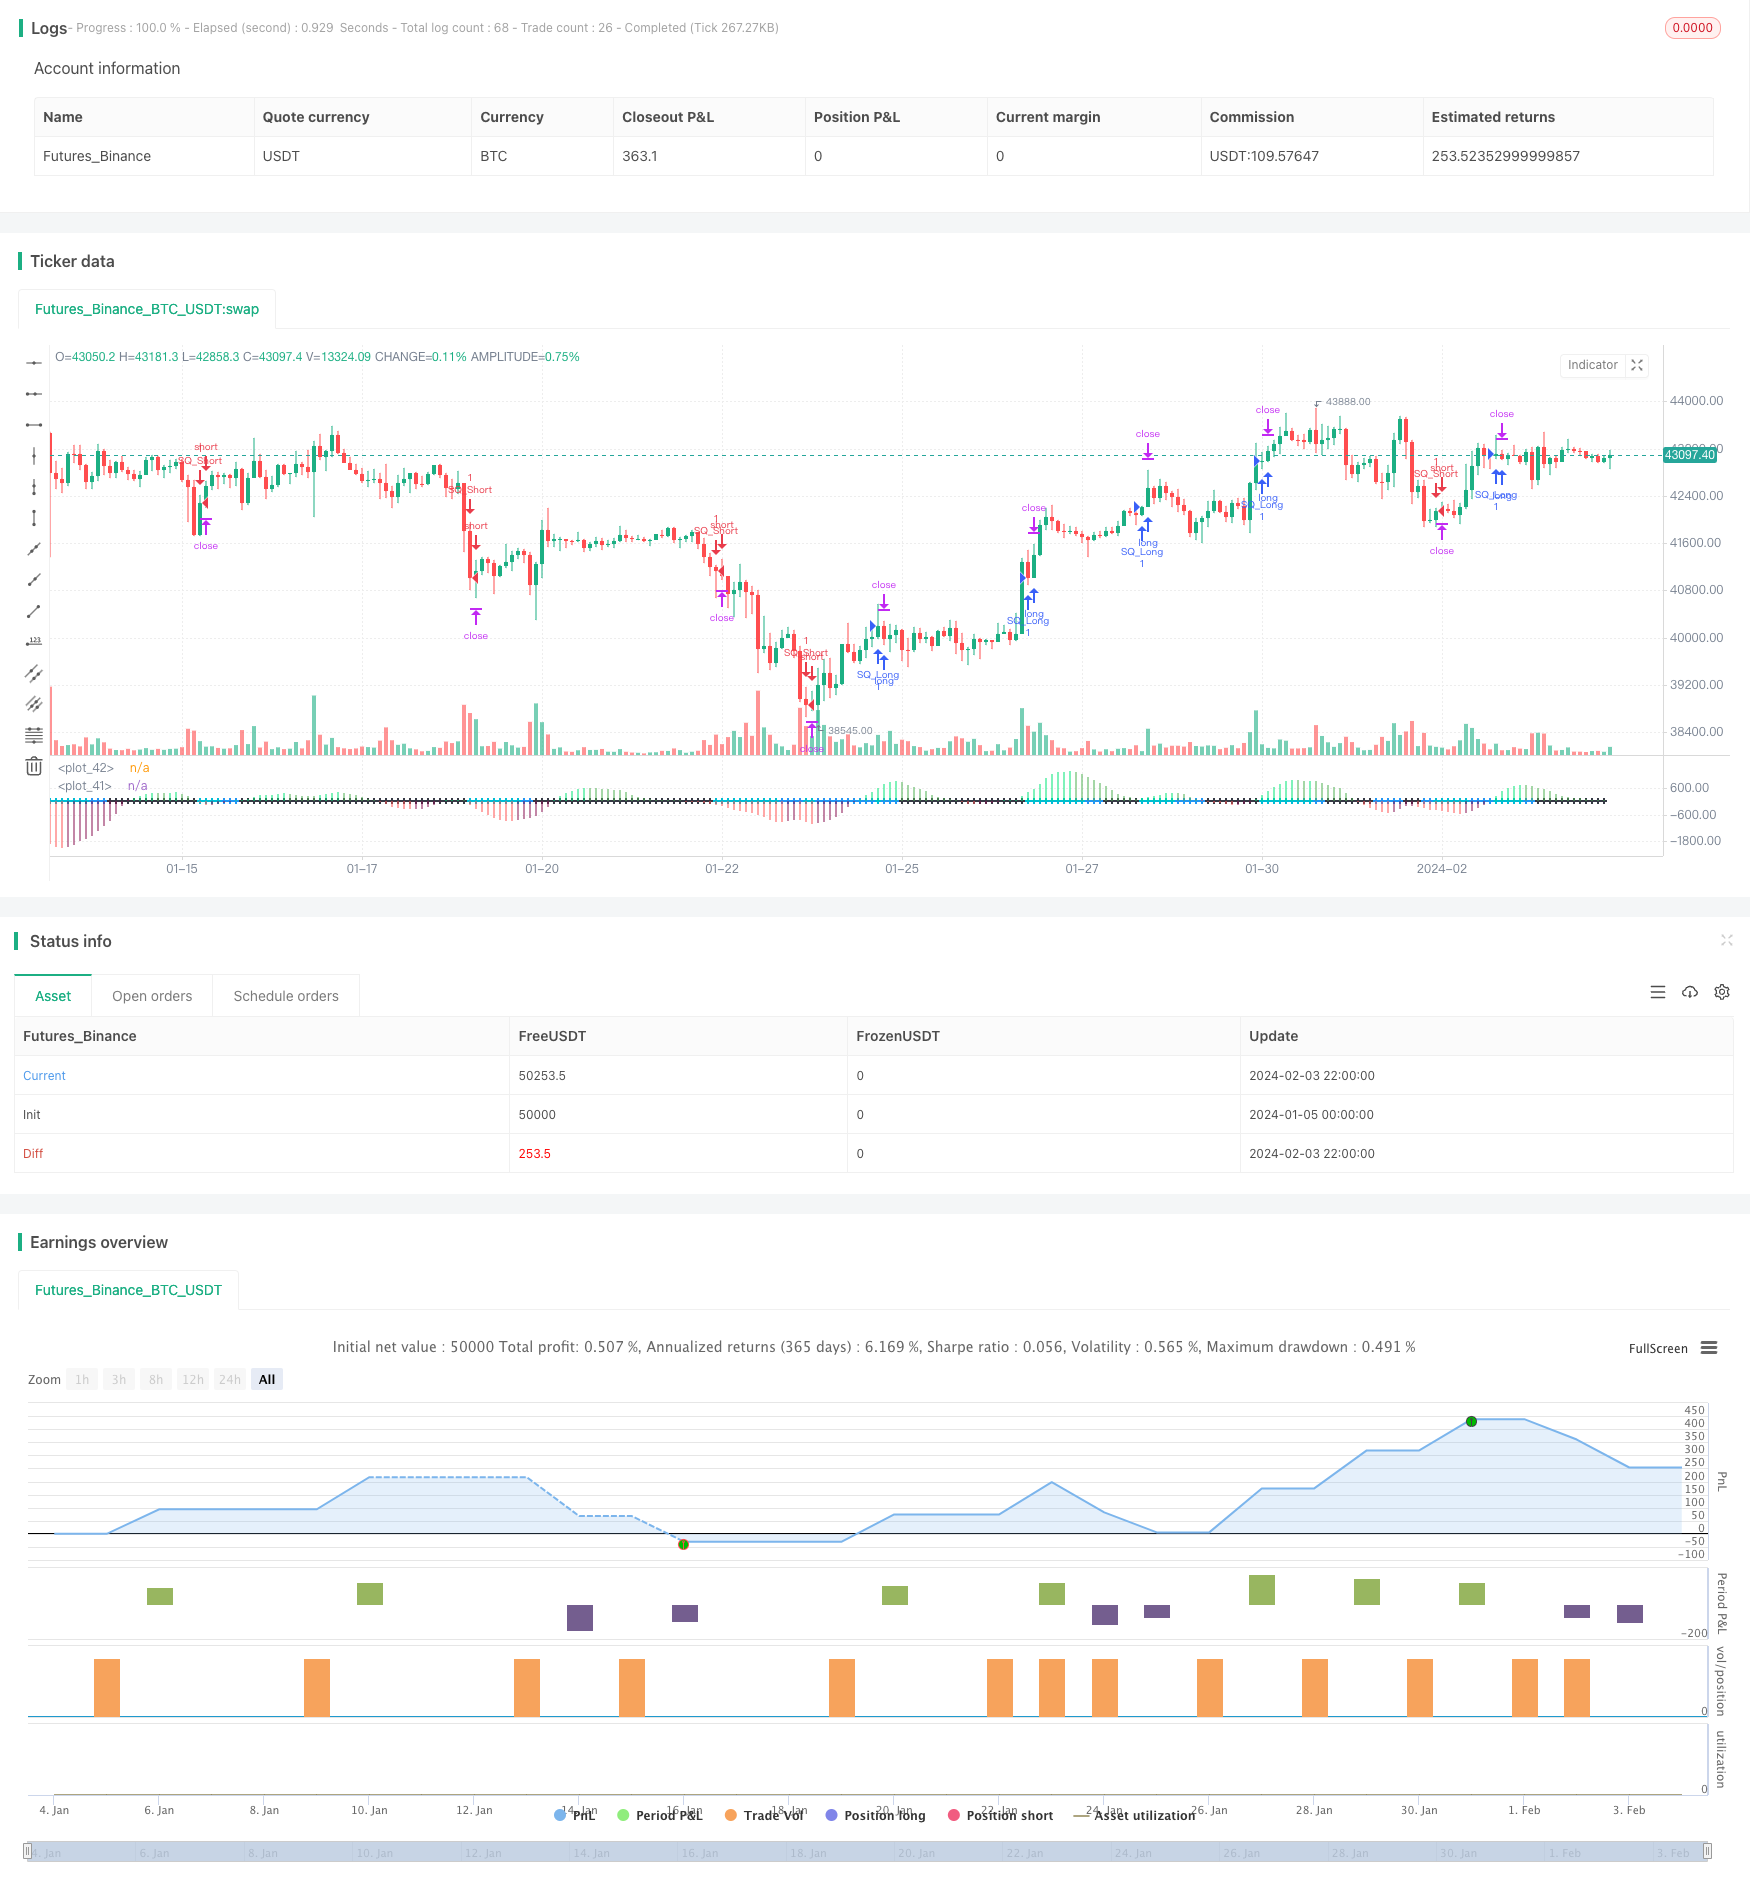
/*backtest
start: 2024-01-05 00:00:00
end: 2024-02-04 00:00:00
period: 2h
basePeriod: 15m
exchanges: [{"eid":"Futures_Binance","currency":"BTC_USDT"}]
*/

// @version=4
// Strategy based on LazyBear Squeeze Momentum Indicator
// © Bitduke
// All scripts: https://www.tradingview.com/u/Bitduke/#published-scripts

strategy(shorttitle="SMS", title="Squeeze Momentum Strategy", overlay=false )

length = input(12, title="BB Length")
mult = input(2.0, title="BB MultFactor")
lengthKC = input(16, title="KC Length")
mult_kc = input(1.5, title="KC MultFactor")


//FILTERS
useMomAverage = input(false, title="Filter for Momenutum value", type=input.bool)
MomentumMin = input(20, title="Min for momentum")

// Calculate BB
src = ohlc4

ma_1 = sma(src, length)
ma_2 = sma(src, lengthKC)
range_ma = sma(high - low, lengthKC)

dev = mult * stdev(src, length)

upper_bb = ma_1 + dev
lower_bb = ma_1 - dev

upper_kc = ma_2 + range_ma * mult_kc
lower_kc = ma_2 - range_ma * mult_kc

sqz_on = lower_bb > lower_kc and upper_bb < upper_kc
sqz_off = lower_bb < lower_kc and upper_bb > upper_kc
no_sqz = sqz_on == false and sqz_off == false

val = linreg(src - avg(avg(highest(hl2, lengthKC), lowest(low, lengthKC)), sma(hl2, lengthKC)), lengthKC, 0)

bcolor = iff(val > 0, iff(val > nz(val[1]), color.lime, color.green), iff(val < nz(val[1]), color.red, color.maroon))
scolor = no_sqz ? color.blue : sqz_on ? color.black : color.aqua
plot(val, color=bcolor, style=plot.style_histogram, linewidth=4)
plot(0, color=scolor, style=plot.style_cross, linewidth=2)

//LOGIC
//momentum filter
filterMom = useMomAverage ? abs(val) > MomentumMin / 100000 ? true : false : true

//standard condition
longCondition = scolor[1] != color.aqua and scolor == color.aqua and bcolor == color.lime and filterMom
exitLongCondition = bcolor == color.green
shortCondition = scolor[1] != color.aqua and scolor == color.aqua and bcolor == color.red and filterMom
exitShortCondition = bcolor == color.maroon

// Risk Management Sysyem
stop_loss = input(defval = 600, title="Stop Loss", minval = 0)
take_profit = input(defval = 1000, title="Take Profit", minval = 0)
trailing_stop = input(defval = 20, title="Trailing Stop", minval = 0)
// If the zero value is set for stop loss, take profit or trailing stop, then the function is disabled
s_loss = stop_loss >= 1 ? stop_loss : na
tk_profit = take_profit >= 1 ? take_profit : na
tr_stop = trailing_stop >= 1 ? trailing_stop : na


//STRATEGY
strategy.entry("SQ_Long", strategy.long, when=longCondition)
strategy.exit("Exit Long", from_entry = "SQ_Long", profit = take_profit, trail_points = trailing_stop, loss = s_loss)
strategy.close("SQ_Long", exitLongCondition)

strategy.entry("SQ_Short", strategy.short, when=shortCondition)
strategy.exit("Exit Short", from_entry = "SQ_Short", profit = take_profit, trail_points = trailing_stop, loss = s_loss )
strategy.close("SQ_Short", when=exitShortCondition)