추세 추종 손절매 전략


생성 날짜: 2024-02-05 16:00:35 마지막으로 수정됨: 2024-02-05 16:00:35
복사: 0 클릭수: 726
avatar of ChaoZhang ChaoZhang
1
집중하다
1617
수행원

추세 추종 손절매 전략

개요

트렌드 추적 중지 전략은 트렌드 지표 트렌드 알레르트를 기반으로 추적 중지 거래 전략이다. 트렌드 알레르트를 통해 트렌드 방향을 판단하고 트렌드 추적 입장을 구현한다. 동시에 ATR 지표를 사용하여 중지 위치를 설정하고 위험을 제어한다.

전략 원칙

이 전략은 다음과 같은 주요 부분들로 구성됩니다.

  1. TrendAlert 지표는 트렌드 방향을 판단한다. TrendAlert이 0보다 크면 호불호 신호이며, 0보다 작으면 하향 신호이다.

  2. ATR 지표는 최근 가격 변동의 범위를 계산한다. ATR은 ATR의 정지배수atrStopMultiplier을 고정된 정지점으로 곱한다.

  3. 최저 가격 (lowestLow) 과 최고 가격 (highestHigh) 은 ATR 중지 손실을 구축하여 추적 중지 손실을 만듭니다. 구조 파라미터를 사용하여 제어가 활성화되어 있는지 여부.

  4. 트렌드 신호의 방향에 따라 더 많은 또는 더 적은 위치에 들어갑니다. 입문 후 Take Profit 및 Stop Loss을 설정합니다.

  5. 가격이 스톱로스 또는 스톱 스을 쏘아올렸을 때 평점 포지션.

이 전략은 트렌드를 통해 가짜 신호를 필터링하고, 스톱로스 제어 위험을 추적하고, 수익을 보장하는 수익을 목표로 삼고, 거래 시스템의 안정성을 전반적으로 향상시킵니다.

우위 분석

이 전략은 다음과 같은 장점을 가지고 있습니다.

  1. 트렌드 필터링과 트래킹 스톱 손실 이중 보장은 시장 소음을 쫓는 것을 피하고 거래 위험을 통제 할 수 있도록합니다.

  2. ATR은 과도한 최적화를 방지하기 위한 적응형 상쇄 설정으로, 다양한 시장 환경에 적용된다.

  3. 목표지연은 수익을 보장하고, 수익을 먹는 것을 피하는 것입니다.

  4. 전략 논리는 명확하고 간결하며, 수정된 내용을 쉽게 이해할 수 있으며, 양자 거래자의 2차 개발에 적합하다.

  5. Pine 스크립트 언어가 작성되어 TradingView 플랫폼에서 직접 사용할 수 있으며 프로그래밍 기반이 필요하지 않습니다.

위험 분석

이 전략에는 몇 가지 위험도 있습니다.

  1. 트렌드 판단의 오류는 불필요한 진입과 정지가 유발될 수 있다. 정지를 적절히 완화하거나 진입 신호를 필터링할 수 있다.

  2. 상황이 급격하게 변동할 때, ATR은 실제 파장을 과소 평가할 수 있다. 이 경우 ATR의 스톱 손실 배수를 증가시킬 수 있다.

  3. 목표 정지는 전략이 수익을 얻을 수 있는 공간을 제한할 수 있다. 시장에 따라 조정할 수 있다.

  4. 코드가 존재하는 논리는 가격에만 기반하고, 실제로는 시간 관리와 결합되어야 한다.

최적화 방향

이 전략은 다음과 같은 측면에서 최적화될 수 있습니다.

  1. 최적화 변수 ATR 길이atrLength 및 중지 배수atrStopMultiplier, 중지 알고리즘의 민감도를 조정한다.

  2. 다양한 트렌드 지표를 시도하고, 더 나은 진입 시점을 찾아보세요.

  3. 특정 거래 품종 특성에 따라 목표 정지 매개 변수를 선택하거나 조정하십시오.

  4. 시간 단절을 늘리고, 혼자 밤을 지내는 위험을 피하십시오.

  5. 거래량 지표의 필터링과 함께 가짜 돌파구를 통해 전략의 안정성을 높인다.

요약하다

이 전략은 전반적으로 매우 실용적인 트렌드 추적 스톱 손실 전략이다. 그것은 지표 판단 트렌드 방향을 사용하여 트렌드 추적을 구현하고, 위험 통제를 보장하기 위해 스톱 손실을 조정합니다. 이 전략은 논리적으로 명확하고, 사용하기 쉽고, 초보자 학습에 적합합니다. 또한 고급 전략 개발에 좋은 거래 전략 프레임 워크를 제공하며, 정량 거래자가 깊이 연구하고 최적화 할 가치가 있습니다.
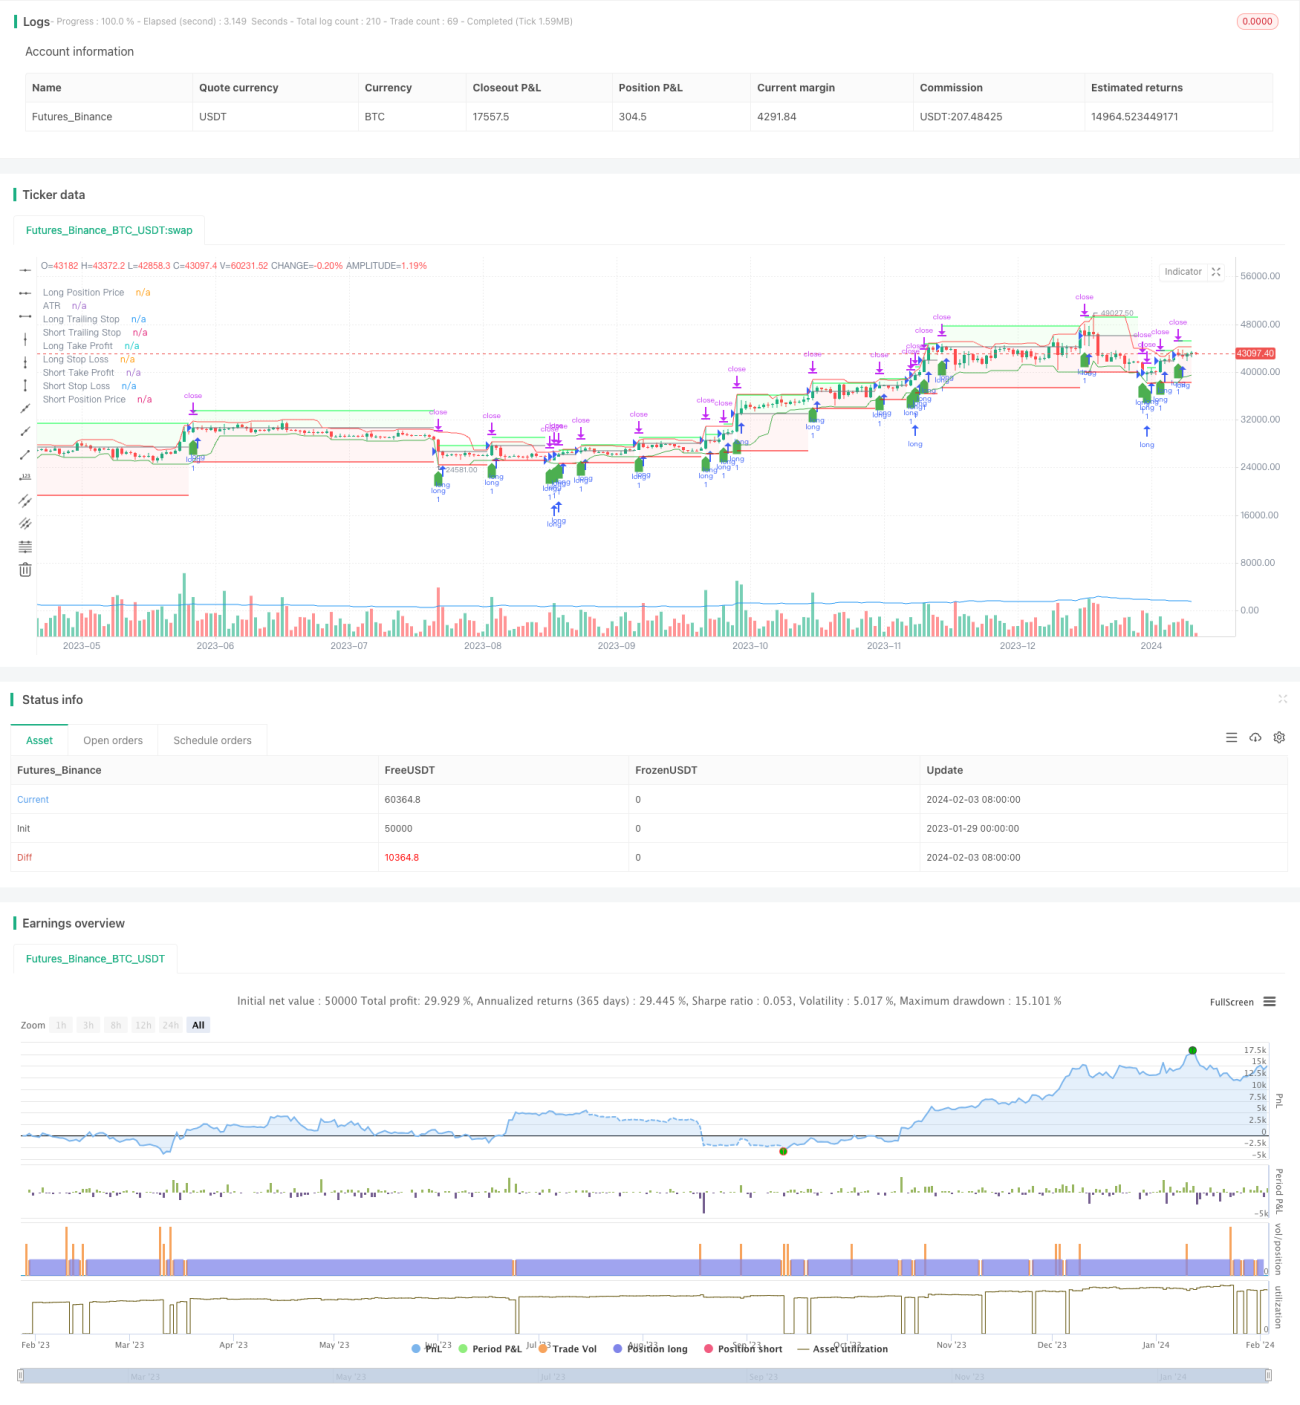
전략 소스 코드
/*backtest
start: 2023-01-29 00:00:00
end: 2024-02-04 00:00:00
period: 1d
basePeriod: 1h
exchanges: [{"eid":"Futures_Binance","currency":"BTC_USDT"}]
*/

// This Pine Script™ code is subject to the terms of the Mozilla Public License 2.0 at https://mozilla.org/MPL/2.0/
// © jaque_verdatre

//@version=5
strategy("TrendAlert Based", overlay = true)

// Get inputs
TrendAlert = input.source(close, "TrendAlert")
atrLength = input.int(title="ATR Length", defval=15, minval=1)
useStructure = input.bool(title="Use Structure?", defval=true)
lookback = input.int(title="How Far To Look Back For High/Lows", defval=8, minval=1)
atrStopMultiplier = input.float(title="ATR Multiplier", defval=0.2, minval=0.1)
LimitMultiplier = input.float(title = "Limit Multiplier", defval = 0.5, minval = 0.1)
PineConnectorID = input.int(title = "Pine Connector ID",defval = 0)
CurrencyToSend = input.string(title = "personilized currency", defval = "ETHUSD")
Risk = input.int(title = "risk in % to send", defval = 10, minval = 1)

// Calculate data
atr = ta.atr(atrLength)
lowestLow = ta.lowest(low, lookback)
highestHigh = ta.highest(high, lookback)
longStop = (useStructure ? lowestLow : close) - atr * atrStopMultiplier
shortStop = (useStructure ? highestHigh : close) + atr * atrStopMultiplier

// Draw data to chart
plot(atr, color=color.rgb(33, 149, 243), title="ATR", display = display.none)
plot(longStop, color=color.green, title="Long Trailing Stop")
plot(shortStop, color=color.red, title="Short Trailing Stop")

var float LimitL = na
var float LimitS = na
var float LPosPrice = na
var float SPosPrice = na
var float LPosLongStop = na
var float SPosShortStop = na

KnowLimit (PosPrice, PosStop) =>
    (PosPrice-PosStop)*LimitMultiplier+PosPrice


NotInTrade = strategy.position_size == 0
InLongTrade = strategy.position_size > 0
InShortTrade = strategy.position_size < 0

longCondition = TrendAlert > 0 and NotInTrade
if (longCondition)
    LPosPrice := close
    LPosLongStop := longStop
    LimitL := KnowLimit(LPosPrice, LPosLongStop)
    strategy.entry("long", strategy.long)
    LTPPip = LimitL-LPosPrice
    LSLPip = LPosPrice-longStop
    alert(str.tostring(PineConnectorID)+',buy,'+str.tostring(CurrencyToSend)+',risk='+str.tostring(Risk)+',sl='+str.tostring(LSLPip)+'tp='+str.tostring(LTPPip), alert.freq_once_per_bar_close)
    strategy.exit("exit", "long", stop = longStop, limit = LimitL)

shortCondition = TrendAlert < 0 and NotInTrade
if (shortCondition)
    SPosPrice := close
    SPosShortStop := shortStop
    LimitS := KnowLimit(SPosPrice, SPosShortStop)
    strategy.entry("short", strategy.short)
    STPPip = SPosPrice-LimitS
    SSLPip = shortStop - SPosPrice
    alert(str.tostring(PineConnectorID)+',sell,ETHUSD,risk=10,sl='+str.tostring(SSLPip)+'tp='+str.tostring(STPPip), alert.freq_once_per_bar_close)
    strategy.exit("exit", "short", stop = shortStop, limit = LimitS)

plotshape(longCondition, color = color.green, style = shape.labelup, location = location.belowbar, size = size.normal, title = "Long Condition")
plotshape(shortCondition, color = color.red, style = shape.labeldown, location = location.abovebar, size = size.normal, title = "Short Condition")

if (InShortTrade)
    LimitL := close
    LPosLongStop := close
    LPosPrice := close

PlotLongTakeProfit = plot(LimitL, color = InLongTrade ? color.rgb(0, 255, 64) : color.rgb(120, 123, 134, 100), title = "Long Take Profit")
PlotLongStopLoss = plot(LPosLongStop, color = InLongTrade ? color.rgb(255, 0, 0) : color.rgb(120, 123, 134, 100), title = "Long Stop Loss")
PlotLongPosPrice = plot(LPosPrice, color = InLongTrade ? color.gray : color.rgb(120, 123, 134, 100), title = "Long Position Price")

if (InLongTrade)
    LimitS := close
    SPosShortStop := close
    SPosPrice := close

PlotShortTakeProfit = plot(LimitS, color = InShortTrade ? color.rgb(0, 255, 64) : color.rgb(120, 123, 134, 100), title = "Short Take Profit")
PlotShortStopLoss = plot(SPosShortStop, color = InShortTrade ? color.rgb(255, 0, 0) : color.rgb(120, 123, 134, 100), title = "Short Stop Loss")
PlotShortPosPrice = plot(SPosPrice, color = InShortTrade ? color.gray : color.rgb(120, 123, 134, 100), title = "Short Position Price")

fill(PlotLongPosPrice, PlotLongTakeProfit, color = InLongTrade ? color.rgb(0, 255, 0, 95) : color.rgb(0, 255, 0, 100))
fill(PlotShortPosPrice, PlotShortTakeProfit, color = InShortTrade ? color.rgb(0, 255, 0, 95) : color.rgb(0, 255, 0, 100))

fill(PlotLongPosPrice, PlotLongStopLoss, color = InLongTrade ? color.rgb(255, 0, 0, 95) : color.rgb(255, 0, 0, 100))
fill(PlotShortPosPrice, PlotShortStopLoss, color = InShortTrade ? color.rgb(255, 0, 0, 95) : color.rgb(255, 0, 0, 100))