가격 채널과 이동 평균을 기반으로 한 추세 추종 전략

1
Follow
1782
Followers
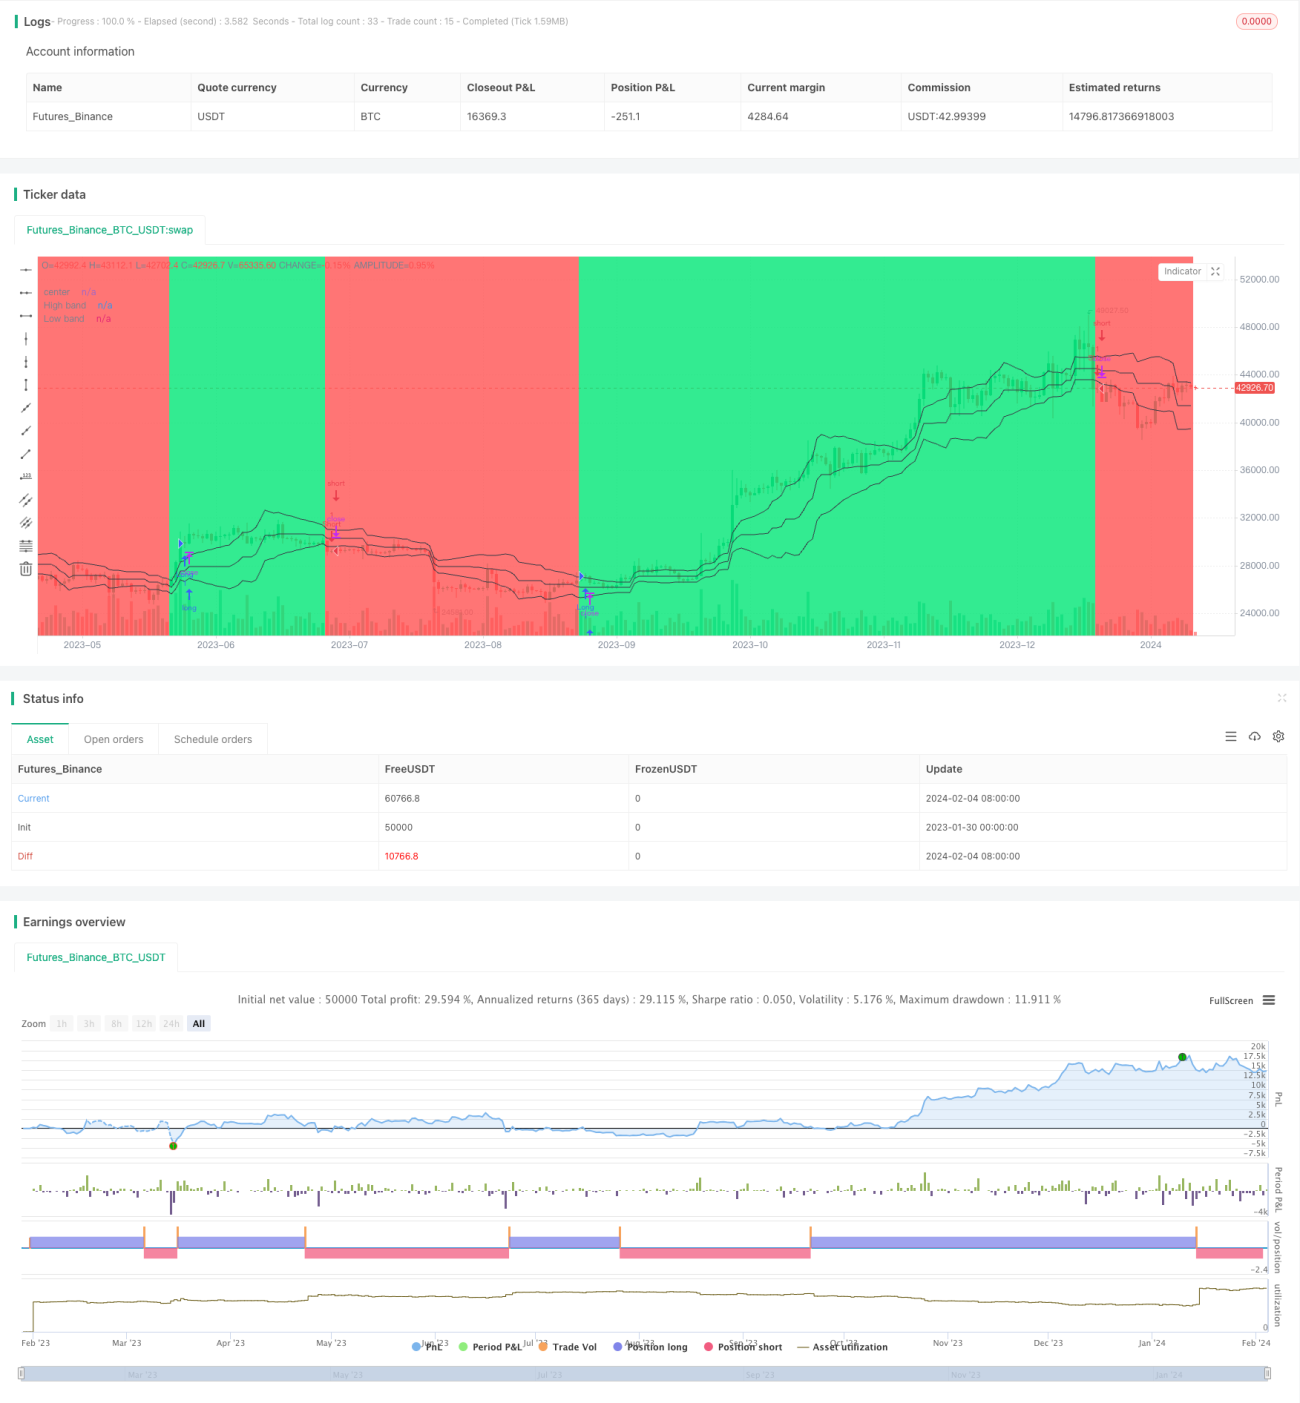
개요
이 전략은 가격 채널을 구성하여 가격의 중심선에서 벗어난 거리를 계산하고, 그 다음 평선 필터링 신호를 결합하여 트렌드를 식별하고 추적합니다. 가격이 채널을 뚫을 때 거래 신호를 생성합니다. 이 전략은 트렌드 추적과 뚫림 두 가지 특징을 동시에 가지고 있습니다.
전략 원칙
- 가격 채널 구축
- 최근 len 주기의 최고 가격과 최저 가격을 계산합니다.
- 중앙선은 최고 가격과 최저 가격의 평균값입니다.
- 값과 중심선 사이의 절대 오차
- 평평한 거리는 선로 상단과 선로 하단
- 트렌드를 판단하는 방법
- 하향 추세라고 정의되는 하향 추세보다 낮은 가격
- 가격이 상반기보다 높을 때, 상승 추세로 정의됩니다.
- 거래 신호를 생성합니다.
- <unk> 트렌드 하에서, 가격이 오픈 가격보다 낮거나 하락하면 더 많은 돈을 벌 수 있습니다.
- 하향 추세에서, 가격은 오픈 가격보다 높거나 상하로 갈 때 공백
우위 분석
- 중·장기적 추세를 포착할 수 있는
- 파격 신호와 함께, 지진 지역에서의 무효 거래를 피하십시오.
- 다양한 품종에 맞는 사용자 정의 파라미터
위험 분석
- 지진 추세에 따른 손실이 더 적을 수 있습니다.
- 변수를 잘못 설정하면 트렌드 리버스를 놓칠 수 있습니다.
- 거래 빈도에 주의를 기울여 과도한 거래를 방지하라
최적화 방향
- 다른 지표와 결합하여 필터링 신호
- 가격 채널 변수를 동적으로 조정
- 손해배상 제도에 가입하여 자금 관리를 최적화
요약하다
이 전략은 전체적으로 안정적이며, 중장선 트렌드를 효과적으로 추적할 수 있으며, 트렌드 돌파구와 결합하여 거래 신호를 생성한다. 매개 변수 최적화 및 신호 필터링을 통해 전략을 더 개선하여 더 많은 품종과 시장 환경에 적합하게 만들 수 있다.
Source
Pine
Strategy parameters
Related strategies
Comment
All comments (0)
No data
- 1