개요
이 전략은 슈퍼 트렌드 지표에 기반한 비트코인 자동 양화 거래 전략이다. 이 전략은 슈퍼 트렌드 지표를 사용하여 시장 흐름을 판단하고, ATR 상쇄 원칙의 위험 제어와 결합하여, 장기간 양방향 거래를 구현한다. 이 전략의 가장 큰 장점은 위험과 수익의 비율이 좋으며, 상쇄 전략은 신뢰할 수 있으며, 중장기 보유에 적합하다. 이 전략은 Coinbase Pro와 같은 주류 거래소에서 4 시간 수준에서 작동할 수 있다.
전략 원칙
이 전략은 슈퍼 트렌드 지표를 사용하여 시장 트렌드 방향을 판단한다. 슈퍼 트렌드 지표가 하향 트렌드에서 상승 트렌드로 전환 할 때, 상향 입문한다. 슈퍼 트렌드 지표가 상향 트렌드에서 하향 트렌드로 전환 할 때, 하향 입문한다.
구체적으로, 이 전략은 먼저 ATR 지표의 길이를 14 사이클로 계산하고, 하나의 ATR 중지 손실 배수 (예: 1.5배) 에 곱하여 각각의 중지 손실 거리를 결정한다. 이후 슈퍼 트렌드 지표를 계산하고, 지표 파라미터는 기본값을 사용한다. (ATR 사이클 9, 슈퍼 트렌드 계수 2.5). 슈퍼 트렌드 지표가 방향을 전환할 때 거래 신호를 발산한다.
입문 후, 중지 손실은 ATR 중지 상위 또는 아래로 고정된다. 첫 번째 중단은 리스크 수익률에 따라 계산되며, 0.75을 암시합니다. 즉, 중지 거리는 중지 거리의 0.75배입니다. 가격이 첫 번째 중지 지점에 도달하면, 50%의 지위를 청산하고, 중지 손실을 오픈 포지션 가격으로 이동합니다.
따라서 이 전략은 중장기 보유 투자 전략에 적합하며, 손실을 막는 위험을 통제 할 수 있다는 전제 하에서 부분적인 막을 통해 수익을 보장 할 수 있습니다.
우위 분석
이 전략의 가장 큰 장점은 위험과 수익의 비율이 좋으며, 중·장기간에 보유할 수 있다는 것이다. 구체적인 장점은 다음과 같다:
슈퍼 트렌드를 사용하여 시장 추세를 판단하고, 시장 소음을 필터링하여 주요 추세를 놓치지 않도록하십시오.
ATR 동적 추적 중지 손실, 신뢰할 수 있는 제어 단독 손실.
부분적인 금고 방식은 수익을 잠금하고, 위험과 이익의 비율이 높습니다.
가격이 스톱 1에 도달하면 스톱 손실을 개시 가격으로 조정하여 수익을 보장하고 전략의 안정성을 강화합니다.
슈퍼 간단한 거래 논리, 이해하기 쉬운 구현, 변수 조정 공간
주요 거래소의 일일 또는 고주파 데이터에 적용할 수 있으며, 유연성이 강하다.
위험 분석
이 전략은 다음과 같은 몇 가지 측면에 초점을 맞춘 위험도 가지고 있습니다.
시장의 갑작스러운 사건으로 인해 스 (gaps) 또는 하락 (jump) 이 발생하고, 손해가 발생하지 않아 큰 손실을 입을 수 있다. ATR의 손해배상 배수를 합리적으로 조정함으로써 위험을 줄일 수 있다.
슈퍼 트렌드 지표 판단이 실패하여 거래 신호 오류가 발생한다. ATR 및 슈퍼 트렌드 파라미터 조합을 적절히 조정하여 최적화 할 수 있다.
일부 매매 비율이 너무 높아서 충분한 트렌드 수익을 얻을 수 없습니다. 시장에 따라 일부 매매 비율을 조정해야합니다.
거래 빈도는 너무 높거나 너무 낮을 수 있습니다. 슈퍼 트렌드 파라미터를 조정하여 최적의 균형을 찾을 수 있습니다.
최적화 방향
이 전략은 크게 다음과 같은 부분들에 집중하여 최적화할 수 있습니다.
표준 ATR, 동력 중지, 브린 밴드 중지 등 다양한 ATR 중지 방법을 시도하여 손실을 줄이는 전략을 최적화하십시오.
다양한 매개 변수의 슈퍼 트렌드 지표를 테스트하여 최적의 매개 변수 조합을 찾습니다. 단계적 최적화 또는 유전 알고리즘을 사용하여 다차원 매개 변수 최적화를 수행 할 수 있습니다.
제2층의 제지 지표 (Donchian channel) 를 제지 상위에 쌓아두어 제지를 더 안정적으로 만들 수 있습니다.
다양한 부분 매매 비율을 테스트하여 최적의 수익성과 위험의 균형을 찾습니다. 부분 매매 비율도 동적으로 조정할 수 있습니다.
기계 학습 기반의 동적 정지, 동적 위치 조정 등의 전략을 탐구한다.
요약하다
이 전략은 슈퍼 트렌드 판단 트렌드, ATR 동적 중지 손실, 부분 중지 수익을 기반으로 한 양적 전략입니다. 그것은 위험 수익 균형이 잘되어 자동화 거래에 적합합니다. 이 전략은 초과, 중지 손실 방식, 수익 방식 등을 크게 최적화 할 수 있습니다. 장기적으로 조정하고 사용하는 가치가있는 양적 전략입니다.
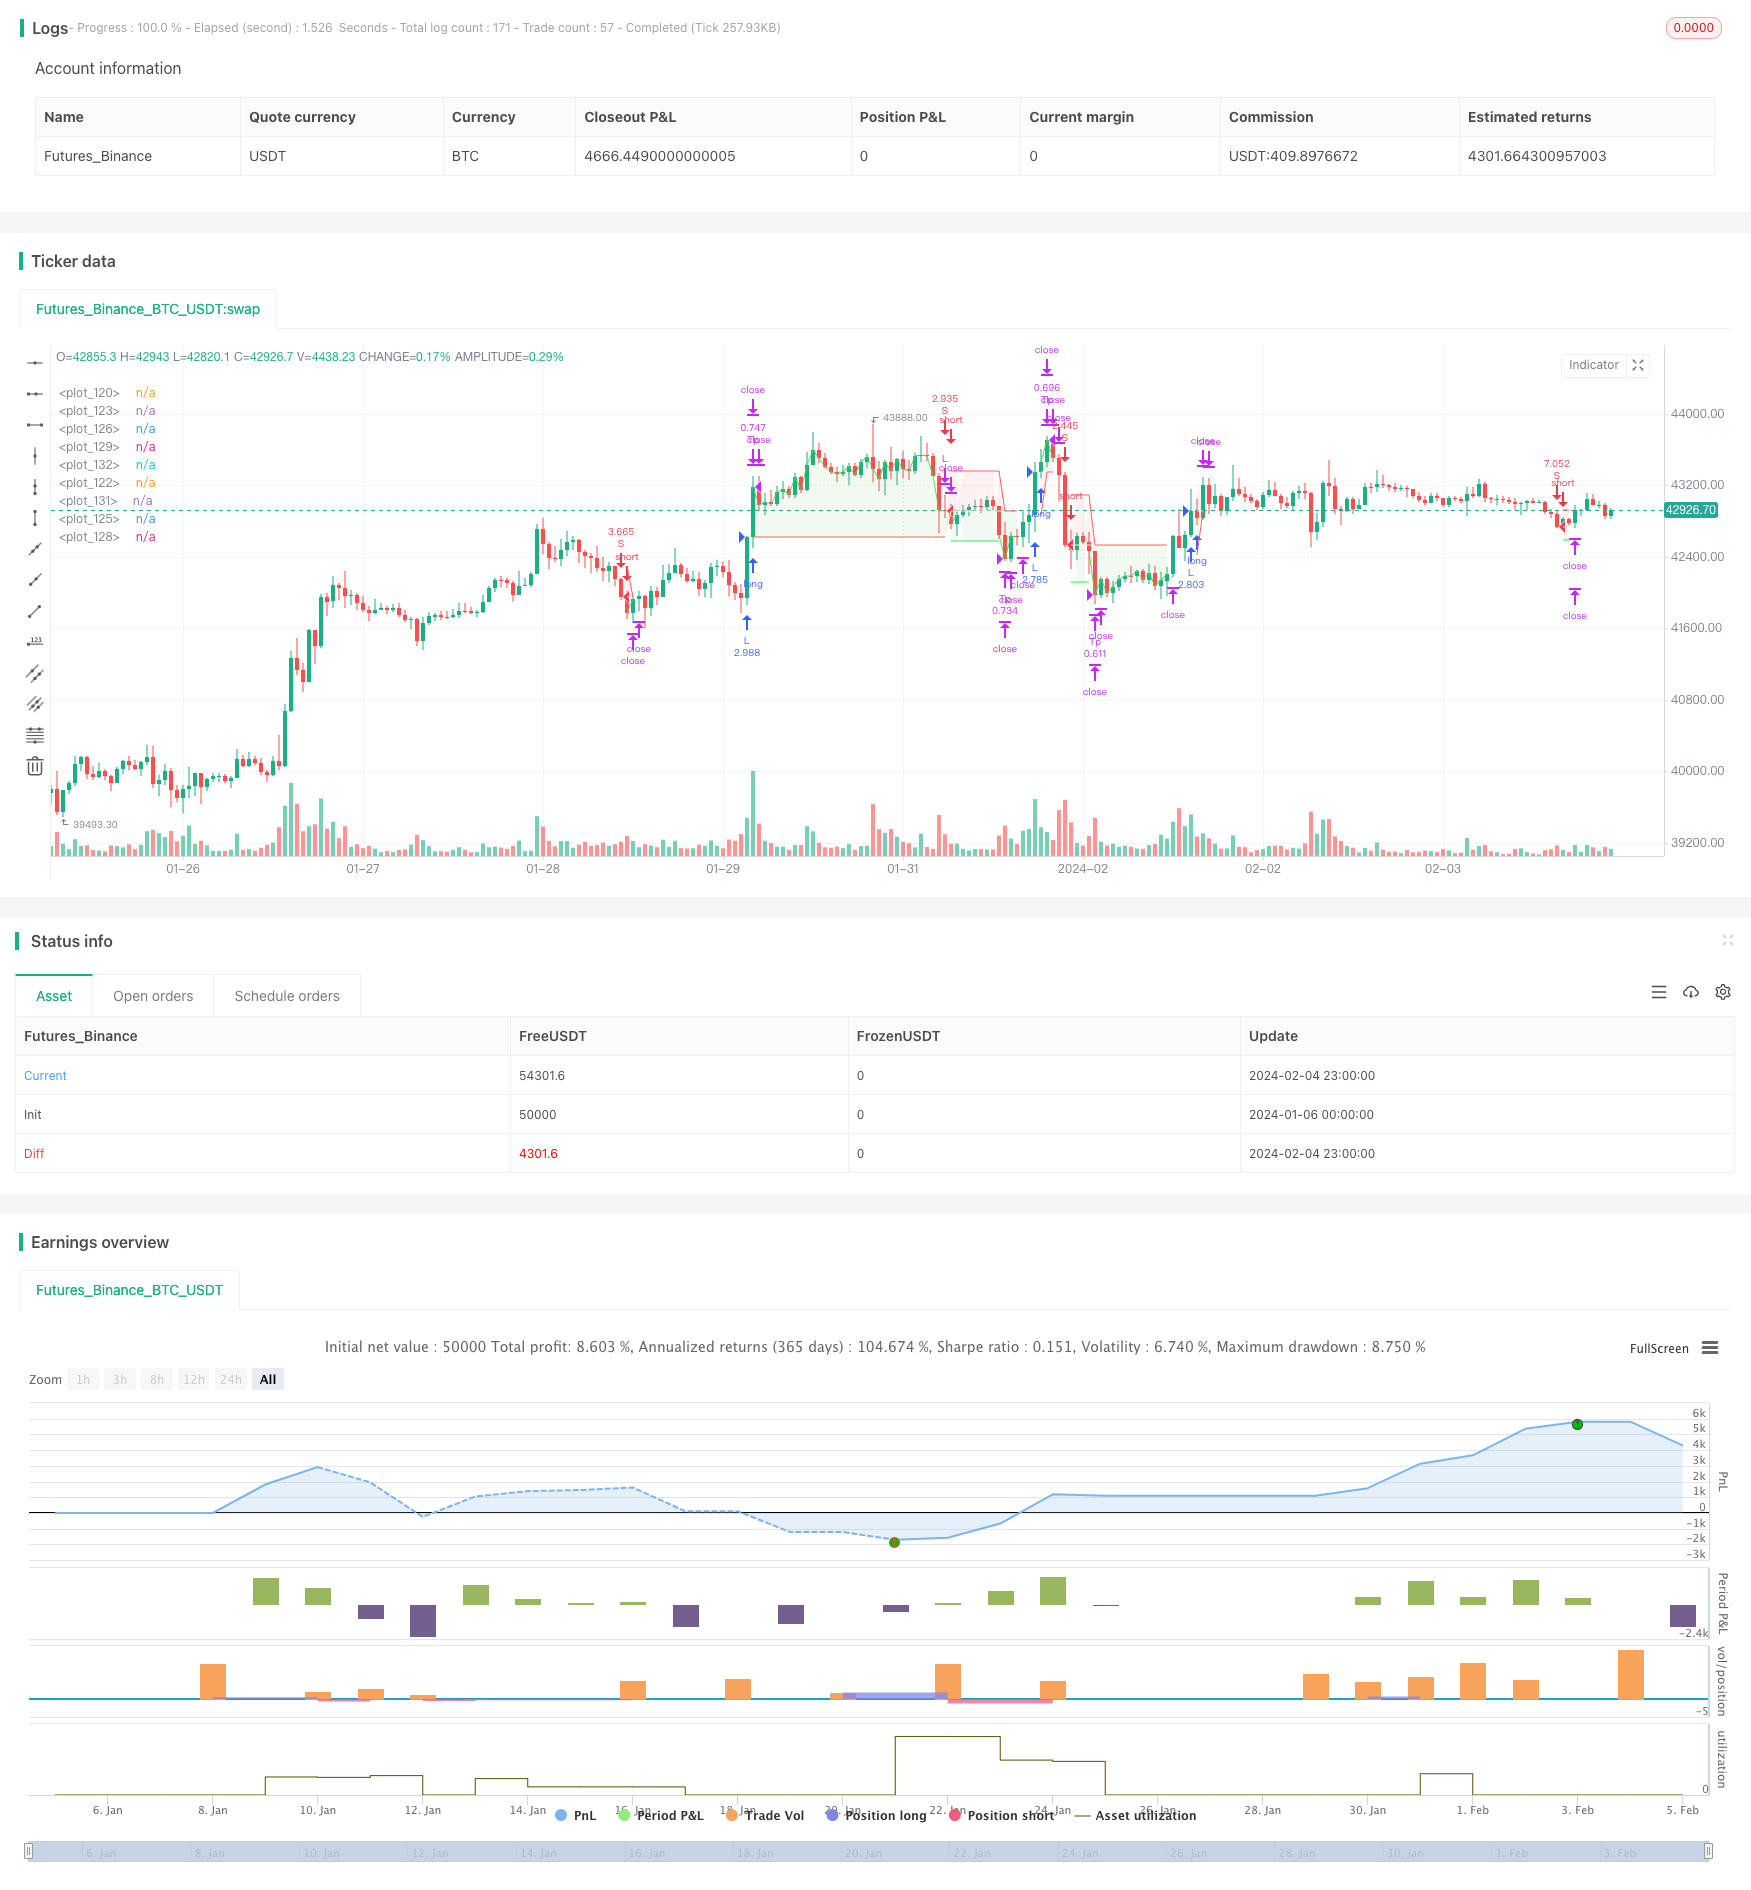
/*backtest
start: 2024-01-06 00:00:00
end: 2024-02-05 00:00:00
period: 1h
basePeriod: 15m
exchanges: [{"eid":"Futures_Binance","currency":"BTC_USDT"}]
*/

// This source code is subject to the terms of the Mozilla Public License 2.0 at https://mozilla.org/MPL/2.0/
// Developed by © StrategiesForEveryone
//@version=5

strategy("SuperTrend Strategy for BTCUSD 4H", overlay=true, process_orders_on_close = true, initial_capital = 100, default_qty_type = strategy.cash, precision = 2, slippage = 50, commission_value = 0.03, backtest_fill_limits_assumption = 50)

// ------ Date filter (obtained from ZenAndTheArtOfTrading) ---------

initial_date = input(title="Initial date", defval=timestamp("10 Feb 2014 13:30 +0000"), group="Time filter", tooltip="Enter the start date and time of the strategy")
final_date   = input(title="Final date", defval=timestamp("01 Jan 2030 19:30 +0000"), group="Time filter", tooltip="Enter the end date and time of the strategy")
dateFilter(int st, int et) => time >= st and time <= et
colorDate = input.bool(defval=false, title="Date background", tooltip = "Add color to the period of time of the strategy tester")
bgcolor(colorDate and dateFilter(initial_date, final_date) ? color.new(color.blue, transp=90) : na)

// ------------ Super Trend ----------

atrPeriod = input(9, "ATR Length SuperTrend")
factor = input.float(2.5, "Factor SuperTrend", step = 0.05)
[supertrend, direction] = ta.supertrend(factor, atrPeriod)
show_supertrend = input.bool(defval = false, title="Show supertrend ?", group = "Appearance")
bodyMiddle = plot(show_supertrend ? ((open + close) / 2) : na, display=display.none)
upTrend = plot(show_supertrend and direction < 0 ? supertrend : na, "Up Trend", color = color.green, style=plot.style_linebr)
downTrend = plot(show_supertrend and direction > 0 ? supertrend : na, "Down Trend", color = color.red, style=plot.style_linebr)
fill(bodyMiddle, upTrend, color.new(color.green, 90), fillgaps=false)
fill(bodyMiddle, downTrend, color.new(color.red, 90), fillgaps=false)

// ---------- Atr stop loss (obtained from garethyeo)

source_atr = input(close, title='Source', group = "Atr stop loss", inline = "A")
length_atr = input.int(14, minval=1, title='Period', group = "Atr stop loss" , inline = "A")
multiplier = input.float(1.5, minval=0.1, step=0.1, title='Atr multiplier', group = "Atr stop loss", inline = "A", tooltip = "Defines the stop loss distance based on the Atr stop loss indicator")
shortStopLoss = source_atr + ta.atr(length_atr) * multiplier
longStopLoss = source_atr - ta.atr(length_atr) * multiplier
show_atr_stoploss = input.bool(defval=false, title="Show Atr stop loss ?", group = "Appearance")
plot(show_atr_stoploss ? longStopLoss : na, color=color.white, style = plot.style_circles)
plot(show_atr_stoploss ? shortStopLoss : na, color=color.white, style = plot.style_circles)

// ------------- Money management --------------

strategy_contracts = strategy.equity / close
distance_sl_atr_long = -1 * (longStopLoss - close) / close
distance_sl_atr_short = (shortStopLoss - close) / close
risk = input.float(2.5, '% Account risk per trade', step=1, group = "Risk management for trades", tooltip = "Percentage of total account to risk per trade")
long_amount = strategy_contracts * (risk / 100) / distance_sl_atr_long
short_amount = strategy_contracts * (risk / 100) / distance_sl_atr_short

// ---------- Risk management ---------------

risk_reward_breakeven_long= input.float(title="Risk/reward for breakeven long", defval=0.75, step=0.05, group = "Risk management for trades")
risk_reward_take_profit_long= input.float(title="Risk/reward for take profit long", defval=0.75, step=0.05, group = "Risk management for trades")
risk_reward_breakeven_short= input.float(title="Risk/reward for break even short", defval=0.75, step=0.05, group = "Risk management for trades")
risk_reward_take_profit_short= input.float(title="Risk/reward for take profit short", defval=0.75, step=0.05, group = "Risk management for trades")
tp_percent=input.float(title="% of trade for first take profit", defval=50, step=5, group = "Risk management for trades", tooltip = "Closing percentage of the current position when the first take profit is reached.")

// ------------ Trade conditions ---------------

bought = strategy.position_size > 0
sold = strategy.position_size < 0
long_supertrend=ta.crossover(close, supertrend)
short_supertrend=ta.crossunder(close, supertrend)
var float sl_long = na
var float sl_short = na
var float be_long = na
var float be_short = na
var float tp_long = na
var float tp_short = na
if not bought
    sl_long:=na
if not sold
    sl_short:=na

// ---------- Strategy -----------

// Long position

if not bought and long_supertrend
    sl_long:=longStopLoss
    long_stoploss_distance = close - longStopLoss
    be_long := close + long_stoploss_distance * risk_reward_breakeven_long
    tp_long:=close+(long_stoploss_distance*risk_reward_take_profit_long)
    strategy.entry('L', strategy.long, long_amount, alert_message = "Long")
    strategy.exit("Tp", "L", stop=sl_long, limit=tp_long, qty_percent=tp_percent)
    strategy.exit('Exit', 'L', stop=sl_long)
if high > be_long
    sl_long := strategy.position_avg_price
    strategy.exit("Tp", "L", stop=sl_long, limit=tp_long, qty_percent=tp_percent)
    strategy.exit('Exit', 'L', stop=sl_long)
if bought and short_supertrend
    strategy.close("L", comment="CL")

// Short position

if not sold and short_supertrend
    sl_short:=shortStopLoss
    short_stoploss_distance=shortStopLoss - close
    be_short:=((short_stoploss_distance*risk_reward_breakeven_short)-close)*-1
    tp_short:=((short_stoploss_distance*risk_reward_take_profit_short)-close)*-1
    strategy.entry("S", strategy.short, short_amount, alert_message = "Short")
    strategy.exit("Tp", "S", stop=sl_short, limit=tp_short, qty_percent=tp_percent)
    strategy.exit("Exit", "S", stop=sl_short)
if low < be_short
    sl_short:=strategy.position_avg_price
    strategy.exit("Tp", "S", stop=sl_short, limit=tp_short, qty_percent=tp_percent)
    strategy.exit("Exit", "S", stop=sl_short)
if sold and long_supertrend
    strategy.close("S", comment="CS")

// ---------- Draw position on chart -------------

if high>tp_long
    tp_long:=na
if low<tp_short
    tp_short:=na
if high>be_long
    be_long:=na
if low<be_short
    be_short:=na

show_position_on_chart = input.bool(defval=true, title="Draw position on chart ?", group = "Appearance", tooltip = "Activate to graphically display profit, stop loss and break even")
position_price = plot(show_position_on_chart? strategy.position_avg_price : na, style=plot.style_linebr, color = color.new(#ffffff, 10), linewidth = 1)

sl_long_price = plot(show_position_on_chart and bought ? sl_long : na, style = plot.style_linebr, color = color.new(color.red, 10), linewidth = 1)
sl_short_price = plot(show_position_on_chart and sold ? sl_short : na, style = plot.style_linebr, color = color.new(color.red, 10), linewidth = 1)

tp_long_price = plot(strategy.position_size>0 and show_position_on_chart? tp_long : na, style = plot.style_linebr, color = color.new(#11eb47, 10), linewidth = 1)
tp_short_price = plot(strategy.position_size<0 and show_position_on_chart? tp_short : na, style = plot.style_linebr, color = color.new(#11eb47, 10), linewidth = 1)

breakeven_long = plot(strategy.position_size>0 and high<be_long and show_position_on_chart ? be_long : na , style = plot.style_linebr, color = color.new(#00ff40, 60), linewidth = 1)
breakeven_short = plot(strategy.position_size<0 and low>be_short and show_position_on_chart ? be_short : na , style = plot.style_linebr, color = color.new(#00ff40, 60), linewidth = 1)

position_profit_long = plot(bought and show_position_on_chart and strategy.openprofit>0 ? close : na, style = plot.style_linebr, color = color.new(#4cd350, 10), linewidth = 1)
position_profit_short = plot(sold and show_position_on_chart and strategy.openprofit>0 ? close : na, style = plot.style_linebr, color = color.new(#4cd350, 10), linewidth = 1)

fill(plot1 = position_price, plot2 = position_profit_long, color = color.new(color.green,90))
fill(plot1 = position_price, plot2 = position_profit_short, color = color.new(color.green,90))

fill(plot1 = position_price, plot2 = sl_long_price, color = color.new(color.red,90))
fill(plot1 = position_price, plot2 = sl_short_price, color = color.new(color.red,90))

fill(plot1 = position_price, plot2 = tp_long_price, color = color.new(color.green,90))
fill(plot1 = position_price, plot2 = tp_short_price, color = color.new(color.green,90))