EMA 지표를 기반으로 한 추세 추종 거래 전략

1
Follow
1782
Followers
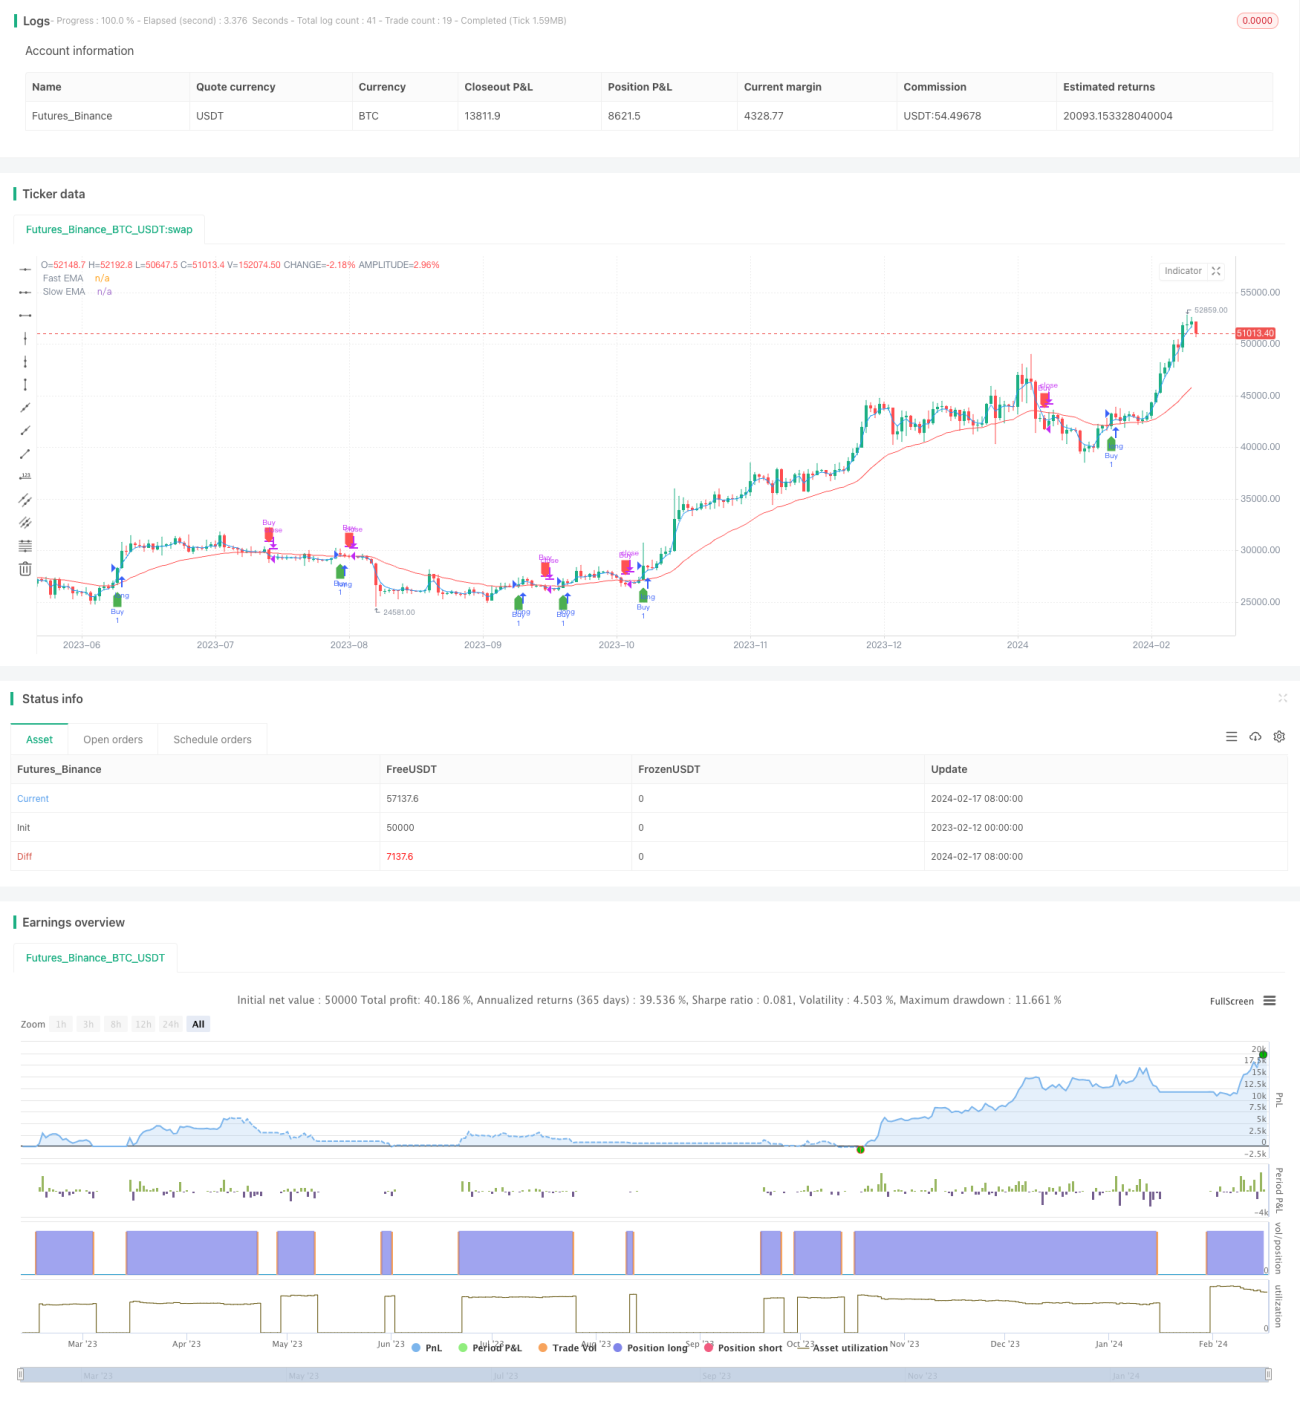
개요
이 전략은 EMA 빠른 선과 느린 선의 골드 포크와 데드 포크를 사용하여 트렌드를 판단하고, 미리 설정된 스톱 스코어 비율과 결합하여 트렌드 추적 거래를 구현한다. 이 전략은 임의의 시간 주기에서 적용되며, 지수와 개별 주식의 트렌드 캡처를 구현할 수 있다.
전략 원칙
이 전략은 3와 30의 길이의 EMA선을 거래 신호로 사용합니다. 3EMA 상위에서 30EMA를 넘으면 가격이 상승하기 시작한다는 것을 나타냅니다.
또한, 전략은 정지 조건을 설정한다. 가격 상승이 전략 진입 가격에 따라 설정된 정지 비율에 도달하면, EXIT한다. 이렇게하면 더 많은 이익을 잠금화하고, 트렌드 추적 거래를 가능하게 한다.
우위 분석
- EMA를 이용해서 트렌드 방향을 판단하는 것은 간단하고 쉽게 이해할 수 있습니다.
- 트렌드 지표와 스톱<unk>을 결합하여 위험을 효과적으로 통제하고 수익을 고정할 수 있습니다.
- 임의의 주기 및 임의의 품종에 적용할 수 있으며, 유연성이 강하다.
위험 분석
- EMA 라인 자체는 가격 변화에 대해 지연성이 있으며, 잘못된 판단이 발생할 수 있습니다.
- 제동 비율이 너무 커서 제동이 제대로 되지 않아 역전 기회를 놓치게 될 수 있습니다.
- 트렌드를 너무 빨리 추적하는 것을 멈추면, 모든 트렌드를 파악할 수 없을 수도 있습니다.
최적화 방향
- 다양한 변수 조합을 테스트할 수 있는 EMA, 최적의 변수를 찾는 것;
- 다른 지표와 결합하여 EMA 신호를 검증하여 정확도를 높일 수 있습니다.
- 동적으로 조정된 <unk> 비율, 황소 시장에서 적절한 완화, 곰 시장에서 적절한 강화.
요약하다
이 전략은 전반적으로 매우 실용적인 트렌드 추적 전략이다. 간단한 EMA 지표를 사용하여 트렌드 방향을 판단하고, 합리적인 중지 규칙을 설정하여 위험을 효과적으로 제어하고, 주식 및 지수의 중장선 이동을 추적하는 데 적합하다. 매개 변수 최적화 및 보조 지표 검증을 통해 전략의 안정성과 수익 요소를 더욱 향상시킬 수 있다.
Source
Pine
Strategy parameters
Related strategies
Comment
All comments (0)
No data
- 1