모멘텀 기반 트렌드 동기화 전략

개요
동력 트렌드 동기화 전략은 상대적 동력 지수 ((RMI) 와 사용자 정의된 presentTrend 지표를 결합한 거래 전략이다. 이 전략은 다층적 인 방법을 사용하여 동력 분석과 트렌드 판단을 결합하여 거래자에게 더 유연하고 민감한 거래 장치를 제공합니다.
전략 원칙
RMI 지표
RMI 지표는 상대적 강도 지표 (RSI) 의 변종으로, 가격 상승과 하락의 동력의 크기를 이전 기간에 대한 가격 변화와 비교하여 측정합니다. 계산 공식은 다음과 같습니다.
RMI = 100 - 100/(1 + 상승 평균/하락 평균)
- 평균 상승률은 지난 N주기의 평균 상승률입니다
- 하락의 평균은 지난 N주기의 하락의 평균입니다
RMI 지표의 값은 0에서 100 사이이며, 값이 클수록 상승 동력이 강하며, 값이 작을수록 하락 동력이 강하다.
현재 트렌드 지표
현재 트렌드 지표는 실제 변동 범위 ((ATR) 와 이동 평균을 결합하여 트렌드 방향과 동적 지원 또는 저항 지점을 판단합니다. 계산 공식은 다음과 같습니다.
-
상단: 이동 평균 + (ATR × F)
-
하단 트랙: 이동 평균 - (ATR × F)
-
이동 평균은 지난 M주기의 종결 가격의 평균입니다.
-
ATR은 지난 M주기의 평균 실제 변동 범위입니다.
-
F는 감수성을 조정하는 배수입니다.
가격이 PresentTrend의 상하 궤도를 돌파할 때, 트렌드가 변하는 것을 나타냅니다.
전략 논리
입장 조건:
- 더 많이: RMI가 60을 초과할 때, 이는 강력한 황소 시장의 동력을 나타내고, 가격이 현재 트렌드보다 높을 때, 상승 추세를 확인 할 때 더 많이 입금하십시오.
- 공백: RMI가 하위값 (예: 40) 보다 낮을 때, 이는 강한 곰 시장의 동력을 나타내고, 가격도 현재 트렌드의 하단 궤도보다 낮아지고, 추세가 하향으로 확인될 때, 공백으로 입점한다.
경기 종료 조건 ((동적 상쇄로):
- 더 많은 탈퇴: 가격이 PresentTrend의 하단 또는 RMI에서 중립 영역으로 돌아갔을 때 탈퇴합니다.
- 공백 퇴장: 가격이 PresentTrend 상반도를 뚫거나 RMI가 중립 영역으로 돌아갔을 때, 곰이 약해지는 것을 암시 할 때 퇴장한다.
동적 중지 손실의 계산 공식:
- 다중 입점: 입점 후 현재 트렌드 아래의 궤도를 출구 가격으로
- 공백 위치: 출입 후 현재 트렌드 (presentTrend) 를 출구 가격으로 사용함
이 전략의 장점은 RMI의 동적 판단과 presentTrend의 트렌드 및 동적 상쇄를 결합하여 트렌드를 추적하면서 위험을 효과적으로 제어할 수 있다는 것입니다.
우위 분석
이 전략은 다음과 같은 장점을 가지고 있습니다.
- 동력 지표와 트렌드 지표를 결합한 다단계 판단 메커니즘, 의사결정 효율성 향상
- 역동적인 스톱 메커니즘, 시장의 변화에 따라 스톱 위치를 조정할 수 있는, 위험을 효과적으로 제어
- 개인 취향에 따라 더 많은,空白 또는 양방향 거래를 선택할 수 있으며, 유연합니다.
- RMI 파라미터는 다른 주기 판단에 적응할 수 있다
- presentTrend Parameter는 조정할 수 있으며, 전략의 민감도를 제어할 수 있습니다.
위험 분석
이 전략에는 위험도 있습니다.
- 거래 신호가 많고, 과도한 거래가 발생하여 거래 비용과 지점 위험이 증가합니다.
- 이중 판단으로 거래 기회를 놓칠 수 있다.
- 자신의 트레이딩 스타일에 맞게 파라미터를 적절히 조정해야 합니다.
- 하지만 여전히 큰 트렌드 방향에 대한 인적 판단이 필요하며, 역동적인 거래를 피합니다.
적절한 입시 조건의 완화, 변수 조합의 최적화, 추세 판단과 결합하여 위와 같은 위험을 줄일 수 있다.
최적화 방향
이 전략은 다음과 같은 방향으로 최적화될 수 있습니다.
- 변동률 지표와 결합하여 높은 변동의 잘못된 입구를 방지합니다.
- 입학을 지원하는 충분한 인력을 확보하기 위한 역량 증대
- 역동적 상쇄 손실의 규모를 최적화하여 상쇄 손실을 보장하면서 더 많은 수익을 얻습니다.
- 재입학 조건이 추가되어 트렌드 기회를 최대한 활용할 수 있습니다.
- 매개 변수 최적화 및 회수, 수익률을 극대화하기 위해 최적의 매개 변수를 찾습니다.
요약하다
동력 트렌드 동기화 전략은 다단계 거래 전략으로 동력 지표와 트렌드 지표를 동시에 고려하여 판단 정확도, 위험 제어의 우수한 특성을 갖는다. 이 전략은 개인 선호도에 따라 유연하게 조정할 수 있으며, 깊이 최적화 된 후, 트렌드 캡처의 장점을 충분히 발휘할 수 있는 추천되는 거래 전략이다.
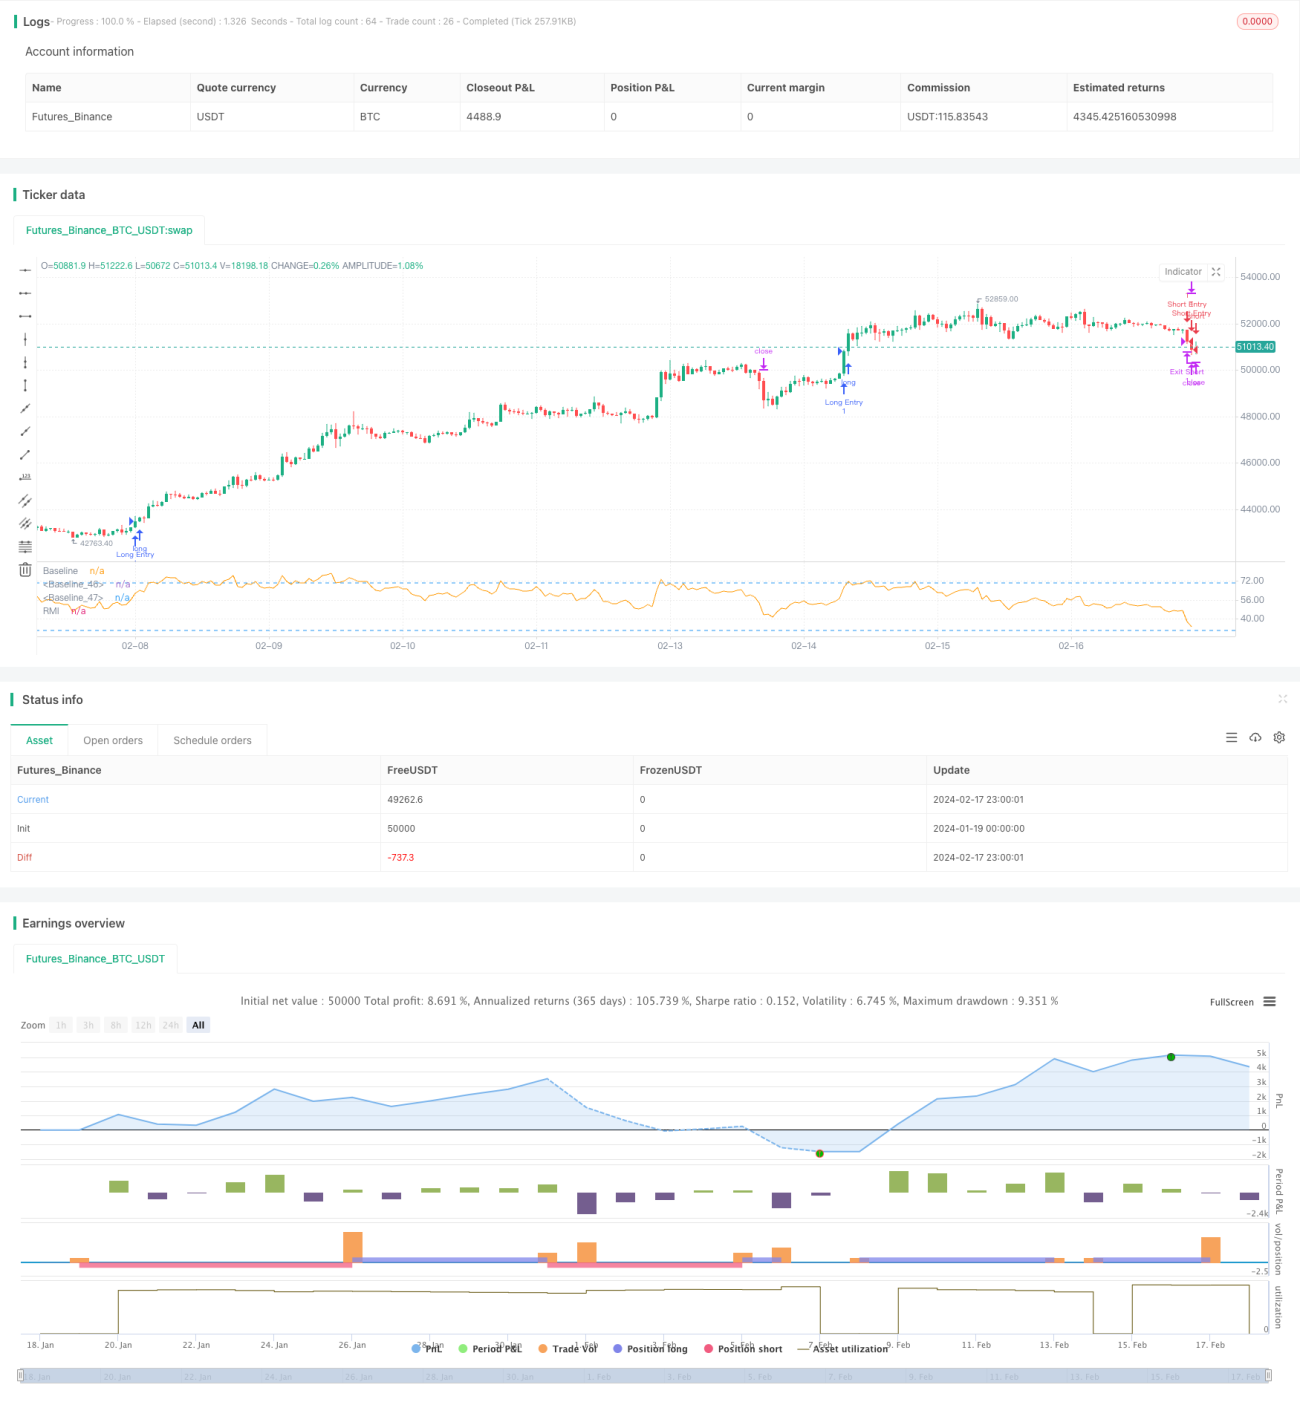
/*backtest
start: 2024-01-19 00:00:00
end: 2024-02-18 00:00:00
period: 1h
basePeriod: 15m
exchanges: [{"eid":"Futures_Binance","currency":"BTC_USDT"}]
*/

// This Pine Script™ code is subject to the terms of the Mozilla Public License 2.0 at https://mozilla.org/MPL/2.0/
// © PresentTrading

//@version=5- 1