
이 파인 스크립트는 TradingView에서 격자 거래 전략을 테스트하고 최적화하기 위한 강력한 프레임워크를 제공합니다. 그것은 strategy.orders () 기능을 사용하여 격자 거래를 자동화하고 피드백을 수행합니다.
이 전략의 핵심 원리는 동적 격자 (dynamic grid) 에 기반한다. 격자는 구매 및 판매 위치를 안내하기 위해 일련의 가격 레벨로 구성되어 있다. 가격이 각 레벨을 돌파하면 관련 거래 행위가 촉발된다.
구체적으로, 하락시에는 지지부서에서 더 많은 입찰을 하게 된다. 부진시에는 중요한 저항부서에서 평소하여 수익을 얻는다. 격자의 폭과 비율은 시장의 변동성과 거래 패턴에 따라 조정된다.
이 자동화된 격자 거래 메커니즘을 통해 시장의 양방향 변동의 기회를 효과적으로 활용하여 안정적인 긍정적 인 수익을 얻을 수 있습니다.
이 전략에는 다음과 같은 장점이 있습니다.
동적 격자: 격자 유형, 너비 파라미터 및 지점 해상도를 사용자 정의 할 수 있으며, 시장 역동성에 적합합니다.
스마트 구매 전략: 다양한 구매 방법을 제공하고, 구매 수를 조정하고, 구매 위치를 제어한다.
전략적 매각: 수를 설정하고, 판매 위치를 제어하고, 스톱 손실 조건을 설정하는 등의 방법으로 수익을 최적화한다.
전력 거래: 현금과 보증금 거래의 선택이 가능하며, 다양한 거래 선호도를 충족시킵니다.
사용자 정의도 높습니다.: 초기 자본, 수료율, 보증금 등 변수를 조정할 수 있다.
정보화 패널이 사이트는 트랜스포머를 통해 트랜스포머의 트랜스포머에 대한 정보를 제공하고 있습니다.
이 전략은 강력한 기능에도 불구하고, 실전에서의 사용에는 다음과 같은 위험 요소가 있습니다:
리포트 제한“지난 성과는 미래의 성과를 예측할 수 없고, 수익은 보장할 수 없다”.
시장의 변동“사용자”는 “사용자”를 “사용자”라고 부릅니다.
거래소 문제거래소 시스템 장애로 인해 주문이 실패하고 실행이 지연될 수 있습니다.
시스템 오류: 주문, 통신 및 수신 결과를 생성하는 시스템은 거래 프로세스를 중단하는 장애가 발생할 수 있습니다.
시간 지연실제 거래의 시간 지연은 비정상적인 결과를 초래할 수 있습니다.
이러한 위험을 충분히 인식하고 신중하게 행동하고 전략을 적절하게 조정하여 안전한 알고리즘 거래를 수행해야합니다.
이 전략은 다음과 같은 부분에서 계속 개선될 수 있습니다.
Stop Loss Logic을 추가하여 극한의 손실을 줄여줍니다.
기계 학습 알고리즘과 결합하여 격자 매개 변수의 동적 조정을 구현한다.
양적 지표를 도입하고, 동향과 핵심 가격대를 식별하고, 의사 결정의 질을 향상시킨다.
보증금 거래의 회수 위험을 방지하기 위한 리스크 컨트롤 모듈을 추가한다.
시간 주기 분석을 도입하여 거래 의사 결정의 시간 효율성을 향상시킵니다.
이러한 최적화는 전략이 재검토와 실전에서 더 뛰어난 성능을 발휘하도록 할 것입니다.
이 파인 스크립트는 테스트 및 그리드 전략을 최적화하는 강력한 프레임 워크를 제공합니다. 기능이 강하지만 실내 실행은 약간의 지연이 있습니다. 충분한 신중하고 위험을 잘 평가하면 이 전략은 자동화된 그리드 거래를 수행하는 효과적인 도구가 될 수 있으며 금융 시장에서 안정적인 수익을 얻을 수 있습니다.
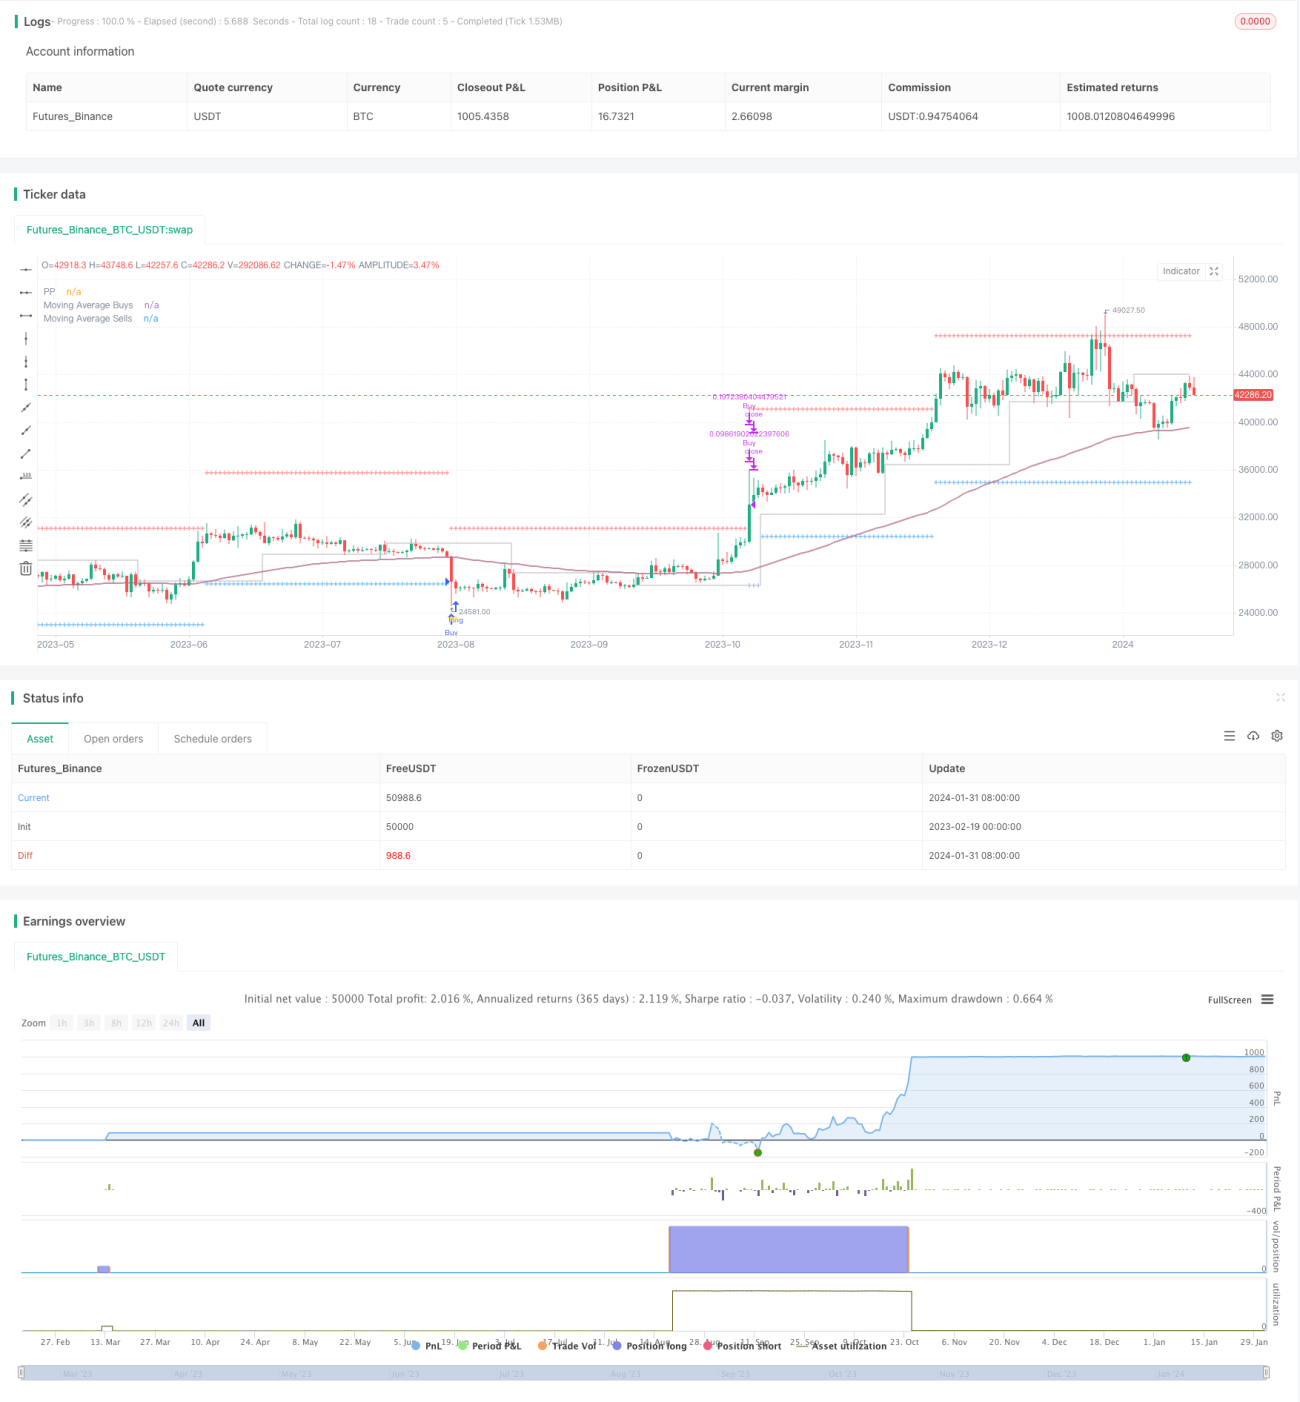
/*backtest
start: 2023-02-19 00:00:00
end: 2024-02-01 05:20:00
period: 1d
basePeriod: 1h
exchanges: [{"eid":"Futures_Binance","currency":"BTC_USDT"}]
*/
// This source code is subject to the terms of the Mozilla Public License 2.0 at https://mozilla.org/MPL/2.0/
// © AssassinsGrid
// Embark on an automated grid-based trading journey with this Pine script tailored for backtesting in TradingView using strategy.orders().
// Whether you're a seasoned trader or new to the world of financial markets, this script is designed to enhance your trading experience across various assets.
// It's essential to note that while powerful, this script may have a slightly delayed execution compared to the original Assassin's Grid due to the nature of strategy.orders() and strategy.close() functions,
// which execute on the following bar after the price crosses the grid.
//
// Key Features:
//
// 📊 Dynamic Grid Configuration: Define the grid type, width, and pivot point resolution to adapt to market dynamics.
//
// 📈 Smart Buy Strategies: Choose from various buy types, set quantities, and control the number of buy positions based on market trends.
//
// 💹 Strategic Selling: Optimize sell strategies with flexible options, including setting quantities, controlling sell positions, and defining loss thresholds.
//
// 🌐 Versatile Trading: Select between spot and margin trading modes, offering flexibility for diverse trading preferences.
//
// ⚙️ Detailed Configuration: Fine-tune your strategy with parameters like initial capital, commission values, margin rates, and more.
//
// 📊 Informative Chart Elements: Visualize critical information with adjustable labels, table size, grid visibility, and an insightful information panel.
//
// Conclusion:
//
// Whether you're a seasoned trader or a trading enthusiast exploring markets beyond cryptocurrencies, this Pine script provides a robust framework for testing and refining your strategies.
// While powerful, be aware that the execution may have a slight delay compared to the original Assassin's Grid.
// Dive into the dynamic world of grid-based trading, explore various configurations, and refine your approach across a spectrum of financial assets. Happy trading! 🚀💰
//@version=5
strategy("Assassin's Grid B", shorttitle = "AAGG📈", overlay = true, max_labels_count = 500, initial_capital = 10000, default_qty_value = 0, process_orders_on_close = true)
// INPUTS
// Grid parameters
WOption = input.string('Geometric (% Fall)', 'Width Type', ['Arithmetic (Price)', 'Geometric (% Sell)', 'Geometric (% Fall)'], group = "GRID", tooltip = "Select the type of width for the grid:\n\n- Arithmetic (Price): Fixed width in price units, maintaining constant separation on the chart.\n\n- Geometric (% Sell): Width based on a percentage of the sell price, dynamically adjusting grid lines. (Typically between 5-15%)\n\n- Geometric (% Fall): Width based on a percentage of potential market decline from the last sale, helping visualize potential drops. (Usually between 40-80%)")
Width = input.float(75, 'Width Parameter', minval = 0, step = 0.5, group = "GRID", tooltip = "Set the width parameter for the grid. Larger values result in wider grid lines.")
ppPeriod = input.string('4W', 'Pivot Point Resolution', group = "GRID", tooltip = "Set the resolution for the Pivot Point. Type a timeframe that suits your trading style: 'H, D, W, M'")
MARes = input.timeframe('D', 'EMA Resolution', group = "GRID", tooltip = "Set the resolution for the Exponential Moving Average (EMA). Choose a timeframe that suits your analysis.")
MALength = input.int(100, 'MA Length', minval = 1, group = "GRID", tooltip = "Set the length for the Moving Average (MA). This affects the responsiveness of the MA to price changes.")
// Buy
BuyType = input.string('Cash / n Buys', 'Buy Type', ['Contracts', 'Cash', '% Cash', 'Cash / n Buys', 'Cash / n Buys +'], group = "BUY", tooltip = "Select the type of buy: \n- Contracts: Specify the number of contracts to buy. \n- Cash: Specify the amount of cash to invest. \n- % Cash: Specify the percentage of available cash to invest. \n- Cash / n Buys: Distribute available cash equally across n buy positions. \n- Cash / n Buys +: Similar to Cash / n Buys, but the quantity on each buy increases proportionally with the buy number.")
BuyQ = input.float(10.0, 'Contracts / Cash / % Cash', minval = 0, group = "BUY", tooltip = "Set the quantity for buy. For 'Contracts' mode, it represents the number of contracts to buy. For 'Cash' and '% Cash' modes, it represents the amount to invest or the percentage of cash to invest, respectively.")
NBuysUp = input.int(4, 'N Buys over MA', minval = 1, maxval = 30, group = "BUY", tooltip = "Set the maximum number of buy positions allowed above the Moving Average (MA). This helps control the number of buys in an uptrend.")
NBuysDown = input.int(5, 'N Buys under MA (Max.)', minval = 1, maxval = 30, group = "BUY", tooltip = "Set the maximum number of buy positions allowed below the Moving Average (MA). This helps control the number of buys in a downtrend.")
LastXtrades = input.int(2, 'Buy all in last Trades', minval = 0, maxval = 10, group = "BUY", tooltip = "Set the number of the most recent buy trades to consider for making a buy decision. For the '% Cash' option only, this setting enables buying all available cash in the last specified number of trades.")
// Sel
SellType = input.string('Position / n Sells +', 'Sell Type', ['Contracts', 'Cash', '% Position', 'Position / n Sells', 'Position / n Sells +'], group = "SELL", tooltip = "Select the type of sell: \n- Contracts: Specify the number of contracts to sell. \n- Cash: Specify the amount of cash to disinvest. \n- % Position: Specify the percentage of the position to sell. \n- Position / n Sells: Distribute the position equally across n sell positions. \n- Position / n Sells +: Similar to Position / n Sells, but the quantity on each sell increases proportionally with the sell number.")
SellQ = input.float(5.0, 'Contracts / Cash / % Position', minval = 0, group = "SELL", tooltip = "Set the quantity for sell. For 'Contracts' mode, it represents the number of contracts to sell. For 'Cash' and '% Position' modes, it represents the amount to disinvest or the percentage of the position to sell, respectively.")
NSellsUp = input.int(20, 'N Sells over MA (Max.)', minval = 1, maxval = 30, group = "SELL", tooltip = "Set the maximum number of sell positions allowed above the Moving Average (MA). This helps control the number of sells in an uptrend.")
NSellsDown = input.int(4, 'N Sells under MA', minval = 1, maxval = 30, group = "SELL", tooltip = "Set the maximum number of sell positions allowed below the Moving Average (MA). This helps control the number of sells in a downtrend.")
LossAllowed = input.string('Never', 'Loss Allowed', ['Never', 'Last buy', 'Always'], group = "SELL", tooltip = "Set the loss allowed criteria: \n- Never: No loss allowed for selling. \n- Last buy: Allow selling if the current price is above the price of the last buy. \n- Always: Allow selling at any price.")
// Trading
TradingType = input.string('Spot', 'Trading Type', ['Spot', 'Margin'], group = "TRADING", tooltip = "Select the type of trading: \n- Spot: Regular trading without margin. \n- Margin: Trading with margin, allowing for leveraged positions.")
InitialContracts = input.float(10.0, '% Initial Capital 1st Trade', minval = 1, maxval = 100, group = "TRADING", tooltip = "Set the percentage of the initial capital to be used for the first trade. This determines the position size for the first trade.") / 100
CommissionValue = input.float(0.1, '% Commission Value', minval = 0, maxval = 100, step = 0.1, group = "TRADING", tooltip = "Set the percentage of the trade value to be considered as a commission. This is deducted from the trading capital.") / 100
MarginRate = input.float(1.0, '% Margin Rate', minval = 0, maxval = 100, step = 0.5, group = "TRADING", tooltip = "Set the percentage of margin rate to be applied. This is relevant only in margin trading scenarios.") / 100
StartDate = timestamp('01 Jan 1970 00:00 +000')
testPeriodStart = input(StartDate, 'Start of Trading', group = "TRADING", tooltip = "Set the start date for trading. The strategy will start evaluating trades from this date onwards.")
TableSizeInput = input.string('Small', 'Table Size', ['Auto', 'Tiny', 'Small', 'Normal', 'Large', 'Huge'], group = "PLOTTING", tooltip = "Set the size of the information table. Choose a size that suits your preference.")
ShowGrid = input(true, 'Level Grid', group = "PLOTTING", tooltip = "Show or hide the level grid on the chart. The grid represents price levels.")
ShowPanel = input(false, 'Information Panel', group = "PLOTTING", tooltip = "Show or hide the information panel on the chart. The panel displays key information about the strategy and current market conditions.")
ShowLiquidationPrice = input(false, 'Liquidation Price', group = "PLOTTING", tooltip = "Show or hide the liquidation price on the chart. The liquidation price is the level at which liquidation may occur, if applicable.")
// VARIABLES
// Grid levels on buys
var float _ldown = na
bool _pb = false
bool _buy = false
// Grid levels on sells
var float _lup = na
bool _ps = false
bool _sell = false
// First Buy
CloseFirstBar = ta.valuewhen(bar_index == 0, open, 0)
TimeFirstBar = ta.valuewhen(bar_index == 0, time, 0)
CloseStart = ta.valuewhen(time <= testPeriodStart, open, 0)
FirstClose = testPeriodStart > TimeFirstBar ? CloseStart : CloseFirstBar
TimeFirstClose = testPeriodStart > TimeFirstBar ? testPeriodStart : TimeFirstBar
// Buy and Sell prices
var float FinalBuyPrice = na
var float FinalSellPrice = na
var float FinalOpenPrice = na
var float BuyLimitPrice = na
var float SellLimitPrice = na
// Number of trades
var int nBuys = na
nBuys := nz(nBuys[1])
var int nSells = na
nSells := nz(nSells[1])
var int NBuys = NBuysDown
var int NSells = NSellsDown
// Quantities
var float BuyQuantity = 0
var float BuyAmount = 0
var float SellQuantity = 0
var float SellAmount = 0
var float Commission = 0
var float Gains = 0
var float Losses = 0
// Position calculation
var float PositionCash = 0
var float PositionSize = 0
var int BarIndex = 0
// Average Price Calculation
var float AvgPrice = 0
var float hl2Bar = 0
// Backtest information
var float Balance = 500000
var float Equity = 0
var float RealizedPnL = 0
var float PRealizedPnL = 0
var float Floating = 0
var float PFloating = 0
var float URealizedPnL = 0
var float PURealizedPnL = 0
var float Cash = Balance
var float Margin = 0
var float BuyAndHold = 0
var float PBuyAndHold = 0
var float CLeverage = 0
var float LiquidationPrice = 0
var bool Liquidation = false
var float ProfitFactor = 0
var int TradingTime = 0
// Fibonacci Pivots level calculation
var float PP = open
// Information panel
label labelBalance = na
// Analyzing when the period changes
bool PeriodChange = false
// Grid with arrays
aDown = array.new_float(30)
aUp = array.new_float(30)
aBuy = array.new_bool(30)
aSell = array.new_bool(30)
// Labels size
fTextSize(_SizeInput)=>
if _SizeInput == 'Auto'
size.auto
else if _SizeInput == 'Tiny'
size.tiny
else if _SizeInput == 'Small'
size.small
else if _SizeInput == 'Normal'
size.normal
else if _SizeInput == 'Normal'
size.normal
else if _SizeInput == 'Large'
size.large
else if _SizeInput == 'Huge'
size.huge
// Variable reference
var float MaxFinalOpenPrice = FirstClose
// Value of the MA
var float sMAValue = na
// GRID
// Function to calculate the Width
fWidth(_Width) =>
// If price is constant
if WOption == 'Arithmetic (Price)'
_Width
// If price is the Max % of the next Sell
else if WOption == 'Geometric (% Sell)'
MaxFinalOpenPrice * (_Width / 100)
// If price is a part of the % of the maximum fall
else if WOption == 'Geometric (% Fall)'
MaxFinalOpenPrice / NBuysDown * (_Width / 100)
// Origin from Rounded Pivot Points or last Sell
fDownGrid(_GridWidth) =>
if na(FinalOpenPrice)
FirstClose
else
if FinalSellPrice <= PP
if PositionSize > 0
if na(FinalBuyPrice)
if WOption == 'Arithmetic (Price)'
(math.floor(FinalSellPrice / _GridWidth) * _GridWidth) - _GridWidth
else
FinalSellPrice - _GridWidth
else
FinalBuyPrice - _GridWidth
else if PositionSize == 0
if WOption == 'Arithmetic (Price)'
(math.floor(PP / _GridWidth) * _GridWidth) - _GridWidth
else
PP
else
if na(FinalBuyPrice)
if WOption == 'Arithmetic (Price)'
(math.floor(PP / _GridWidth) * _GridWidth) - _GridWidth
else
if (FinalSellPrice - _GridWidth) > PP
PP
else
(FinalSellPrice - _GridWidth)
else
FinalBuyPrice - _GridWidth
// Origin for sells from Rounded Position Price
fUpGrid(_GridWidth) =>
if na(FinalSellPrice)
if LossAllowed == 'Never'
if WOption == 'Arithmetic (Price)'
math.ceil(math.max(AvgPrice, (FinalBuyPrice + _GridWidth)) / _GridWidth) * _GridWidth
else
math.max(AvgPrice, (FinalBuyPrice + _GridWidth))
else if LossAllowed == 'Last buy'
if nBuys == NBuys
FinalBuyPrice + _GridWidth
else
if WOption == 'Arithmetic (Price)'
math.ceil(math.max(AvgPrice, (FinalBuyPrice + _GridWidth)) / _GridWidth) * _GridWidth
else
math.max(AvgPrice, (FinalBuyPrice + _GridWidth))
else if LossAllowed == 'Always'
FinalBuyPrice + _GridWidth
else
FinalSellPrice + _GridWidth
// FUNCTIONS
// Function to sum factorial
fSum(_Num)=>
(math.pow(_Num, 2) + _Num) / 2
// Function when "Cash / n Buys" or "Position / n Sells"
fCaPo_N(_N, _n) =>
1 / (_N - nz(_n))
// Function when "Cash / n Buys +" or "Position / n Sells +"
fCaPo_Nplus(_OnSells, _N, _n) =>
if TradingType == 'Spot' or _OnSells == 1
(nz(_n)+1) / (fSum(_N) - fSum(nz(_n)))
else
(nz(_n)+1) / fSum(_N)
// One of the correct ways to use security
f_security(_sym, _res, _src, _rep) =>
request.security(_sym, _res, _src[not _rep and barstate.isrealtime ? 1 : 0])[_rep or barstate.isrealtime ? 0 : 1]
// Pivot points
PP := f_security(syminfo.tickerid, ppPeriod, hlc3, false)
// Moving Average
MA = ta.ema(close, MALength)
sMA = f_security(syminfo.tickerid, MARes, MA, false)
// Analyzing when the period changes
PeriodChange := ta.change(time(ppPeriod)) != 0
// On Bullish trend, less Number of Buys and more amounts per trade;
// on Bearish more Number of Buys and less amounts per trade
// Max. number of buys
NBuys := if (BuyType == "Cash / n Buys" or BuyType == "Cash / n Buys +")
if BuyLimitPrice >= sMAValue
NBuysUp
else
NBuysDown
else
NBuysDown
// On Bullish trend, more Number of Sells and less amounts per trade;
// on Bearish less Number of Sells and more amounts per trade
// Max. number of sells
NSells := if (SellType == "Position / n Sells" or SellType == "Position / n Sells +")
if SellLimitPrice < sMAValue
NSellsDown
else
NSellsUp
else
NSellsUp
// TRADING
// Start of trading
if time >= TimeFirstClose
// Final Trade Price, Average Price & Backtest
for _i = 1 to math.max(NBuys, NSells)
// Grid on Buys
array.insert(aDown, _i, fDownGrid(fWidth(Width)))
// Crossing between price and levels of grid
array.insert(aBuy, _i, (low <= array.get(aDown, _i) or open <= array.get(aDown, _i)) and nBuys <= NBuys-1)
// Grid on Sells
array.insert(aUp, _i, fUpGrid(fWidth(Width)))
// Crossing between price and levels of grid
array.insert(aSell, _i, (high >= array.get(aUp, _i) or open >= array.get(aUp, _i)) and nSells <= NSells-1)
strategy.initial_capital = 50000
// Financial Data
RealizedPnL := Balance - strategy.initial_capital
PRealizedPnL := (RealizedPnL / strategy.initial_capital) * 100
Floating := ((close - AvgPrice) / AvgPrice) * PositionSize * AvgPrice
PFloating := (Floating / Balance) * 100
URealizedPnL := RealizedPnL + Floating
PURealizedPnL := (URealizedPnL / strategy.initial_capital) * 100
Equity := Balance + Floating
Margin := TradingType == 'Spot' ? 0 : (PositionSize * AvgPrice * MarginRate)
Cash := TradingType == 'Spot' ? math.max(0, Balance - (PositionSize * AvgPrice)) : math.max(0, Balance - Margin)
BuyAndHold := ((close - FirstClose) / FirstClose) * strategy.initial_capital
PBuyAndHold := (BuyAndHold / strategy.initial_capital) * 100
CLeverage := (PositionSize * AvgPrice) / Balance
LiquidationPrice := TradingType == 'Spot' ? 0 : AvgPrice - ((Balance - (Margin * 1)) / PositionSize)
Liquidation := (ta.valuewhen(LiquidationPrice >= low, time , 0) <= timenow)
ProfitFactor := Gains / Losses
TradingTime := timenow - TimeFirstClose
// Quantities to buy according to inputs
if BuyType == "Contracts"
if na(FinalOpenPrice)
BuyQuantity := ((Cash * InitialContracts) / FirstClose)
else
BuyQuantity := math.min((Cash / AvgPrice), BuyQ)
else if BuyType == "Cash"
if na(FinalOpenPrice)
BuyQuantity := (Cash * InitialContracts)
else
BuyQuantity := math.min(Cash, BuyQ)
else if BuyType == "% Cash"
if na(FinalOpenPrice)
BuyQuantity := (Cash * InitialContracts)
else
if nBuys >= NBuys - LastXtrades
BuyQ := (1 / (NBuys - nz(nBuys))) * 100
BuyQuantity := math.min(Cash, (BuyQ / 100) * Cash)
else if BuyType == "Cash / n Buys"
if na(FinalOpenPrice)
BuyQuantity := (Cash * InitialContracts)
else
BuyQuantity := math.min(Cash, fCaPo_N(NBuys, nBuys) * Cash)
else if BuyType == "Cash / n Buys +"
if na(FinalOpenPrice)
BuyQuantity := (Cash * InitialContracts)
else
BuyQuantity := math.min(Cash, fCaPo_Nplus(0, NBuys, nBuys) * Cash)
// Quantities to sell according to inputs
if SellType == "Contracts"
SellQuantity := math.min(PositionSize, SellQ)
else if SellType == "Cash"
SellQuantity := math.min((PositionSize * AvgPrice), SellQ)
else if SellType == "% Position"
SellQuantity := math.min(PositionSize, (SellQ / 100) * PositionSize)
else if SellType == "Position / n Sells"
SellQuantity := math.min(PositionSize, fCaPo_N(NSells, nSells) * PositionSize)
else if SellType == "Position / n Sells +"
SellQuantity := math.min(PositionSize, fCaPo_Nplus(1, NSells, nSells) * PositionSize)
// First buy limit order from every change of the period
if (PP != PP[1]) and nz(nBuys) == 0 and not nz(nSells) == 0 and not na(nBuys) and not na(fDownGrid(fWidth(Width)))
// Value of the MA
sMAValue := sMA
// Buy price of the limit order
BuyLimitPrice := fDownGrid(fWidth(Width))
// Buying at better Price
if array.get(aBuy, _i) and BuyQuantity > 0
// Value of the MA
sMAValue := sMA
// Price of buy orders and resetting sales
FinalBuyPrice := math.min(open, array.get(aDown, _i))
FinalSellPrice := na
FinalOpenPrice := FinalBuyPrice
// Number of buys and resetting sales
nBuys += 1
nSells := na
// Redefining buy quantity
if BuyType == "Contracts"
BuyAmount := BuyQuantity
else
BuyAmount := (BuyQuantity / FinalBuyPrice)
// Calculating the priority and secondary price average
PositionCash += FinalBuyPrice * BuyAmount
PositionSize += BuyAmount
AvgPrice := PositionCash / PositionSize
// Calculating net profit
Balance -= (BuyAmount * FinalBuyPrice * CommissionValue)
// Comissions losses
Losses += (BuyAmount * FinalBuyPrice * CommissionValue)
// Fees paid
Commission += (BuyAmount * FinalBuyPrice * CommissionValue)
// Avoiding overlap
BarIndex := bar_index
// Variable reference
MaxFinalOpenPrice := math.max(FinalBuyPrice, nz(MaxFinalOpenPrice))
// Buy & Sell price of the limit orders
if nBuys <= NBuys-1
BuyLimitPrice := FinalBuyPrice - fWidth(Width)
else
BuyLimitPrice := na
SellLimitPrice := fUpGrid(fWidth(Width))
// Strategy orders
strategy.order("Buy", strategy.long, BuyAmount)
// Buy shapes
//string BuyText = str.tostring(BuyAmount,'#.####') + "\n" + str.tostring(((BuyAmount * FinalBuyPrice) / Cash) * 100, '#.##') + "%"
//c_BuyGrad = color.from_gradient(((NBuys - nBuys) / NBuys) * 100, 1, 100, color.lime, color.blue)
//label.new(bar_index, FinalBuyPrice, BuyText, textcolor = color.new(color.white, 50), color = c_BuyGrad, style = label.style_diamond, size = fTextSize(LabelSizeInput))
// Selling at better Price
else if array.get(aSell, _i) and SellQuantity > 0 and BarIndex != bar_index
// Value of the MA
sMAValue := sMA
// Price of sale orders and resetting buys
FinalBuyPrice := na
FinalSellPrice := math.max(open, array.get(aUp, _i))
FinalOpenPrice := FinalSellPrice
// Number of sales and resetting buys
nBuys := na
nSells += 1
// Redefining sell quantity
if SellType == "Cash"
SellAmount := SellQuantity / FinalSellPrice
else
SellAmount := SellQuantity
// Calculating the priority and resetting secondary price average
PositionCash -= AvgPrice * SellAmount
PositionSize -= SellAmount
// Calculating net profit
Balance += (FinalSellPrice - AvgPrice) * SellAmount
Balance -= (SellAmount * FinalSellPrice * CommissionValue)
// Gains and Losses
if FinalSellPrice >= AvgPrice
Gains += (FinalSellPrice - AvgPrice) * SellAmount
else
Losses += (AvgPrice - FinalSellPrice) * SellAmount
// Comission losses
Losses += (SellAmount * FinalSellPrice * CommissionValue)
// Fees paid
Commission += (SellAmount * FinalSellPrice * CommissionValue)
// Variable reference
MaxFinalOpenPrice := FinalSellPrice
// Buy & Sell price of the limit orders
BuyLimitPrice := fDownGrid(fWidth(Width))
if nSells <= NSells-1
SellLimitPrice := FinalSellPrice + fWidth(Width)
else
SellLimitPrice := na
// Strategy orders
strategy.close("Buy", comment = 'Sell', qty = SellAmount)
// Sell shapes
//string SellText = str.tostring(SellAmount,'#.####') + "\n" + str.tostring((SellAmount / (PositionSize + SellAmount)) * 100, '#.##') + "%"
//c_SellGrad = color.from_gradient(((NSells - nSells) / NSells) * 100, 1, 100, color.yellow, color.red)
//label.new(bar_index, FinalSellPrice, SellText, textcolor = color.new(color.white, 50), color = c_SellGrad, style = label.style_diamond, size = fTextSize(LabelSizeInput))
// PLOTTING
// Price of the limit orders
bool LastBar = (time >= timenow - (timeframe.multiplier * 1000 * 60))
plotshape(ShowGrid ? BuyLimitPrice : na, "Buy level", shape.cross, location.absolute, color.new(color.blue, 30), size = size.auto)
plotshape(ShowGrid ? SellLimitPrice : na, "Sell level", shape.cross, location.absolute, color.new(color.red, 30), size = size.auto)
// Table
var InfoPanel = table.new(position.middle_left, 2, 12, na, color.new(color.white, 80), 1, color.new(color.white, 80), 1)
ftable(_table_id, _column, _row, _text, _bgcolor) =>
table.cell(_table_id, _column, _row, _text, 0, 0, _bgcolor, text.align_left, text.align_center, fTextSize(TableSizeInput), na)
tfString(int timeInMs) =>
// @function Produces a string corresponding to the input time in days, hours, and minutes.
// @param (series int) A time value in milliseconds to be converted to a string variable.
// @returns (string) A string variable reflecting the amount of time from the input time.
float s = timeInMs / 1000
float m = s / 60
float h = m / 60
float d = h / 24
float mo = d / 30.416
int tm = math.floor(m % 60)
int th = math.floor(h % 24)
int td = math.floor(d % 30.416)
int tmo = math.floor(mo % 12)
int ys = math.floor(d / 365)
string result =
switch
d == 30 and th == 10 and tm == 30 => "1M"
d == 7 and th == 0 and tm == 0 => "1W"
=>
string yStr = ys ? str.tostring(ys) + "Y " : ""
string moStr = tmo ? str.tostring(tmo) + "M " : ""
string dStr = td ? str.tostring(td) + "D " : ""
string hStr = th ? str.tostring(th) + "H " : ""
string mStr = tm ? str.tostring(tm) + "min" : ""
yStr + moStr + dStr + hStr + mStr
if ShowPanel
ftable(InfoPanel, 0, 0, 'Equity: ' , color.new(color.white, 50))
ftable(InfoPanel, 0, 1, 'Position: ' , color.new(color.white, 50))
ftable(InfoPanel, 0, 2, 'Cash: ' , color.new(color.white, 50))
ftable(InfoPanel, 0, 3, 'Margin: ' , color.new(color.white, 50))
ftable(InfoPanel, 0, 4, 'Current Leverage: ' , color.new(color.white, 50))
ftable(InfoPanel, 0, 5, 'Commission Paid: ' , color.new(color.white, 50))
ftable(InfoPanel, 0, 6, 'Floating: ' , color.new(color.white, 50))
ftable(InfoPanel, 0, 7, 'Realized PnL: ' , color.new(color.white, 50))
ftable(InfoPanel, 0, 8, 'Unrealized PnL: ' , color.new(color.white, 50))
ftable(InfoPanel, 0, 9, 'Buy n Hold: ' , color.new(color.white, 50))
ftable(InfoPanel, 0, 10, 'Profit Factor: ' , color.new(color.white, 50))
ftable(InfoPanel, 0, 11, 'Time of Trading: ' , color.new(color.white, 50))
ftable(InfoPanel, 1, 0, Liquidation ? 'Liquidation' : str.tostring(Equity, '#.####') + ' ' + syminfo.currency , Liquidation ? color.red : color.green)
ftable(InfoPanel, 1, 1, str.tostring(PositionSize, '#.####') + ' ' + syminfo.basecurrency , color.green)
ftable(InfoPanel, 1, 2, str.tostring(Cash, '#.####') + ' ' + syminfo.currency , color.green)
ftable(InfoPanel, 1, 3, str.tostring(Margin, '#.####') + ' ' + syminfo.currency , color.green)
ftable(InfoPanel, 1, 4, TradingType == 'Spot' ? 'Spot' : str.tostring(CLeverage, '#.##') + 'x' , color.green)
ftable(InfoPanel, 1, 5, str.tostring(Commission, '#.####') + ' ' + syminfo.currency , Commission == 0 ? color.green : color.red)
ftable(InfoPanel, 1, 6, str.tostring(PFloating, '#.##') + ' %' , PFloating >= 0 ? color.green : color.red)
ftable(InfoPanel, 1, 7, str.tostring(PRealizedPnL, '#.##') + ' %' , PRealizedPnL >= 0 ? color.green : color.red)
ftable(InfoPanel, 1, 8, str.tostring(PURealizedPnL, '#.##') + ' %' , PURealizedPnL >= 0 ? color.green : color.red)
ftable(InfoPanel, 1, 9, str.tostring(PBuyAndHold, '#.##') + ' %' , PBuyAndHold >= 0 ? color.green : color.red)
ftable(InfoPanel, 1, 10, str.tostring(ProfitFactor, '#.##') , ProfitFactor >= 1 ? color.green : color.red)
ftable(InfoPanel, 1, 11, tfString(TradingTime) , color.new(color.white, 50))
// Plotting pivot points
plot(PP, title = "PP", style = plot.style_stepline, color = color.silver, linewidth = 1)
// Plotting the average price
plotshape(barstate.isrealtime and ta.change(AvgPrice) != 0 ? AvgPrice : na, "AvgPricepr", shape.diamond, location.absolute, color.new(color.yellow, 10), size = size.tiny)
plotshape( ta.change(AvgPrice[1]) != 0 ? AvgPrice[1] : na, "AvgPricep", shape.diamond, location.absolute, color.new(color.yellow, 40), size = size.tiny)
plotshape(TimeFirstClose == time ? FirstClose : na, "FirstClose", shape.diamond, location.absolute, color.new(color.yellow, 40), size = size.tiny)
// Plotting the moving average
plot((BuyType == "Cash / n Buys" or BuyType == "Cash / n Buys +") and NBuysUp != NBuysDown ? sMA : na, title = "Moving Average Buys", color = color.new(color.blue, 50), linewidth = 2)
plot((SellType == "Position / n Sells" or SellType == "Position / n Sells +") and NSellsUp != NSellsDown ? sMA : na, title = "Moving Average Sells", color = color.new(color.red, 50), linewidth = 2)
// Plotting the liquidation price
plot(ShowLiquidationPrice and LiquidationPrice > 0 ? LiquidationPrice : na, "Liquidation Price", Liquidation ? color.new(color.red, 30) : color.new(color.lime, 30), 2)
barcolor(Liquidation ? color.red : na)
//⚠️ IMPORTANT NOTICE: LIVE ALGORITHMIC TRADING RISKS
//🚨 Engaging in live algorithmic trading poses several inherent risks that you should be aware of:
//📉 Backtesting Limitations: Historical performance (backtesting) may not accurately predict future results. Past success does not guarantee future profits.
//🌐 Market Unpredictability: The market is dynamic and may fail or exhibit unexpected behavior, impacting your trading strategies.
//🛑 Broker Infrastructure Issues: Your broker's infrastructure may experience failures, execution delays, or reject your orders, affecting real-time trading.
//🤖 System Failures: The systems used for order generation, communication with your broker, and result reception might fail, disrupting the trading process.
//⏳ Time Lag Challenges: Time lags during live trading can lead to unexpected behavior and outcomes, requiring careful consideration.
//🤝 Third-Party System Risks: Systems of third parties, including service providers, brokers, and securities markets, may fail or malfunction, impacting overall functionality.
//💡 It's crucial to acknowledge and understand these risks before embarking on live algorithmic trading. Stay informed, be cautious, and adapt your strategies accordingly.
// Happy and safe trading! 🚀💰