개요
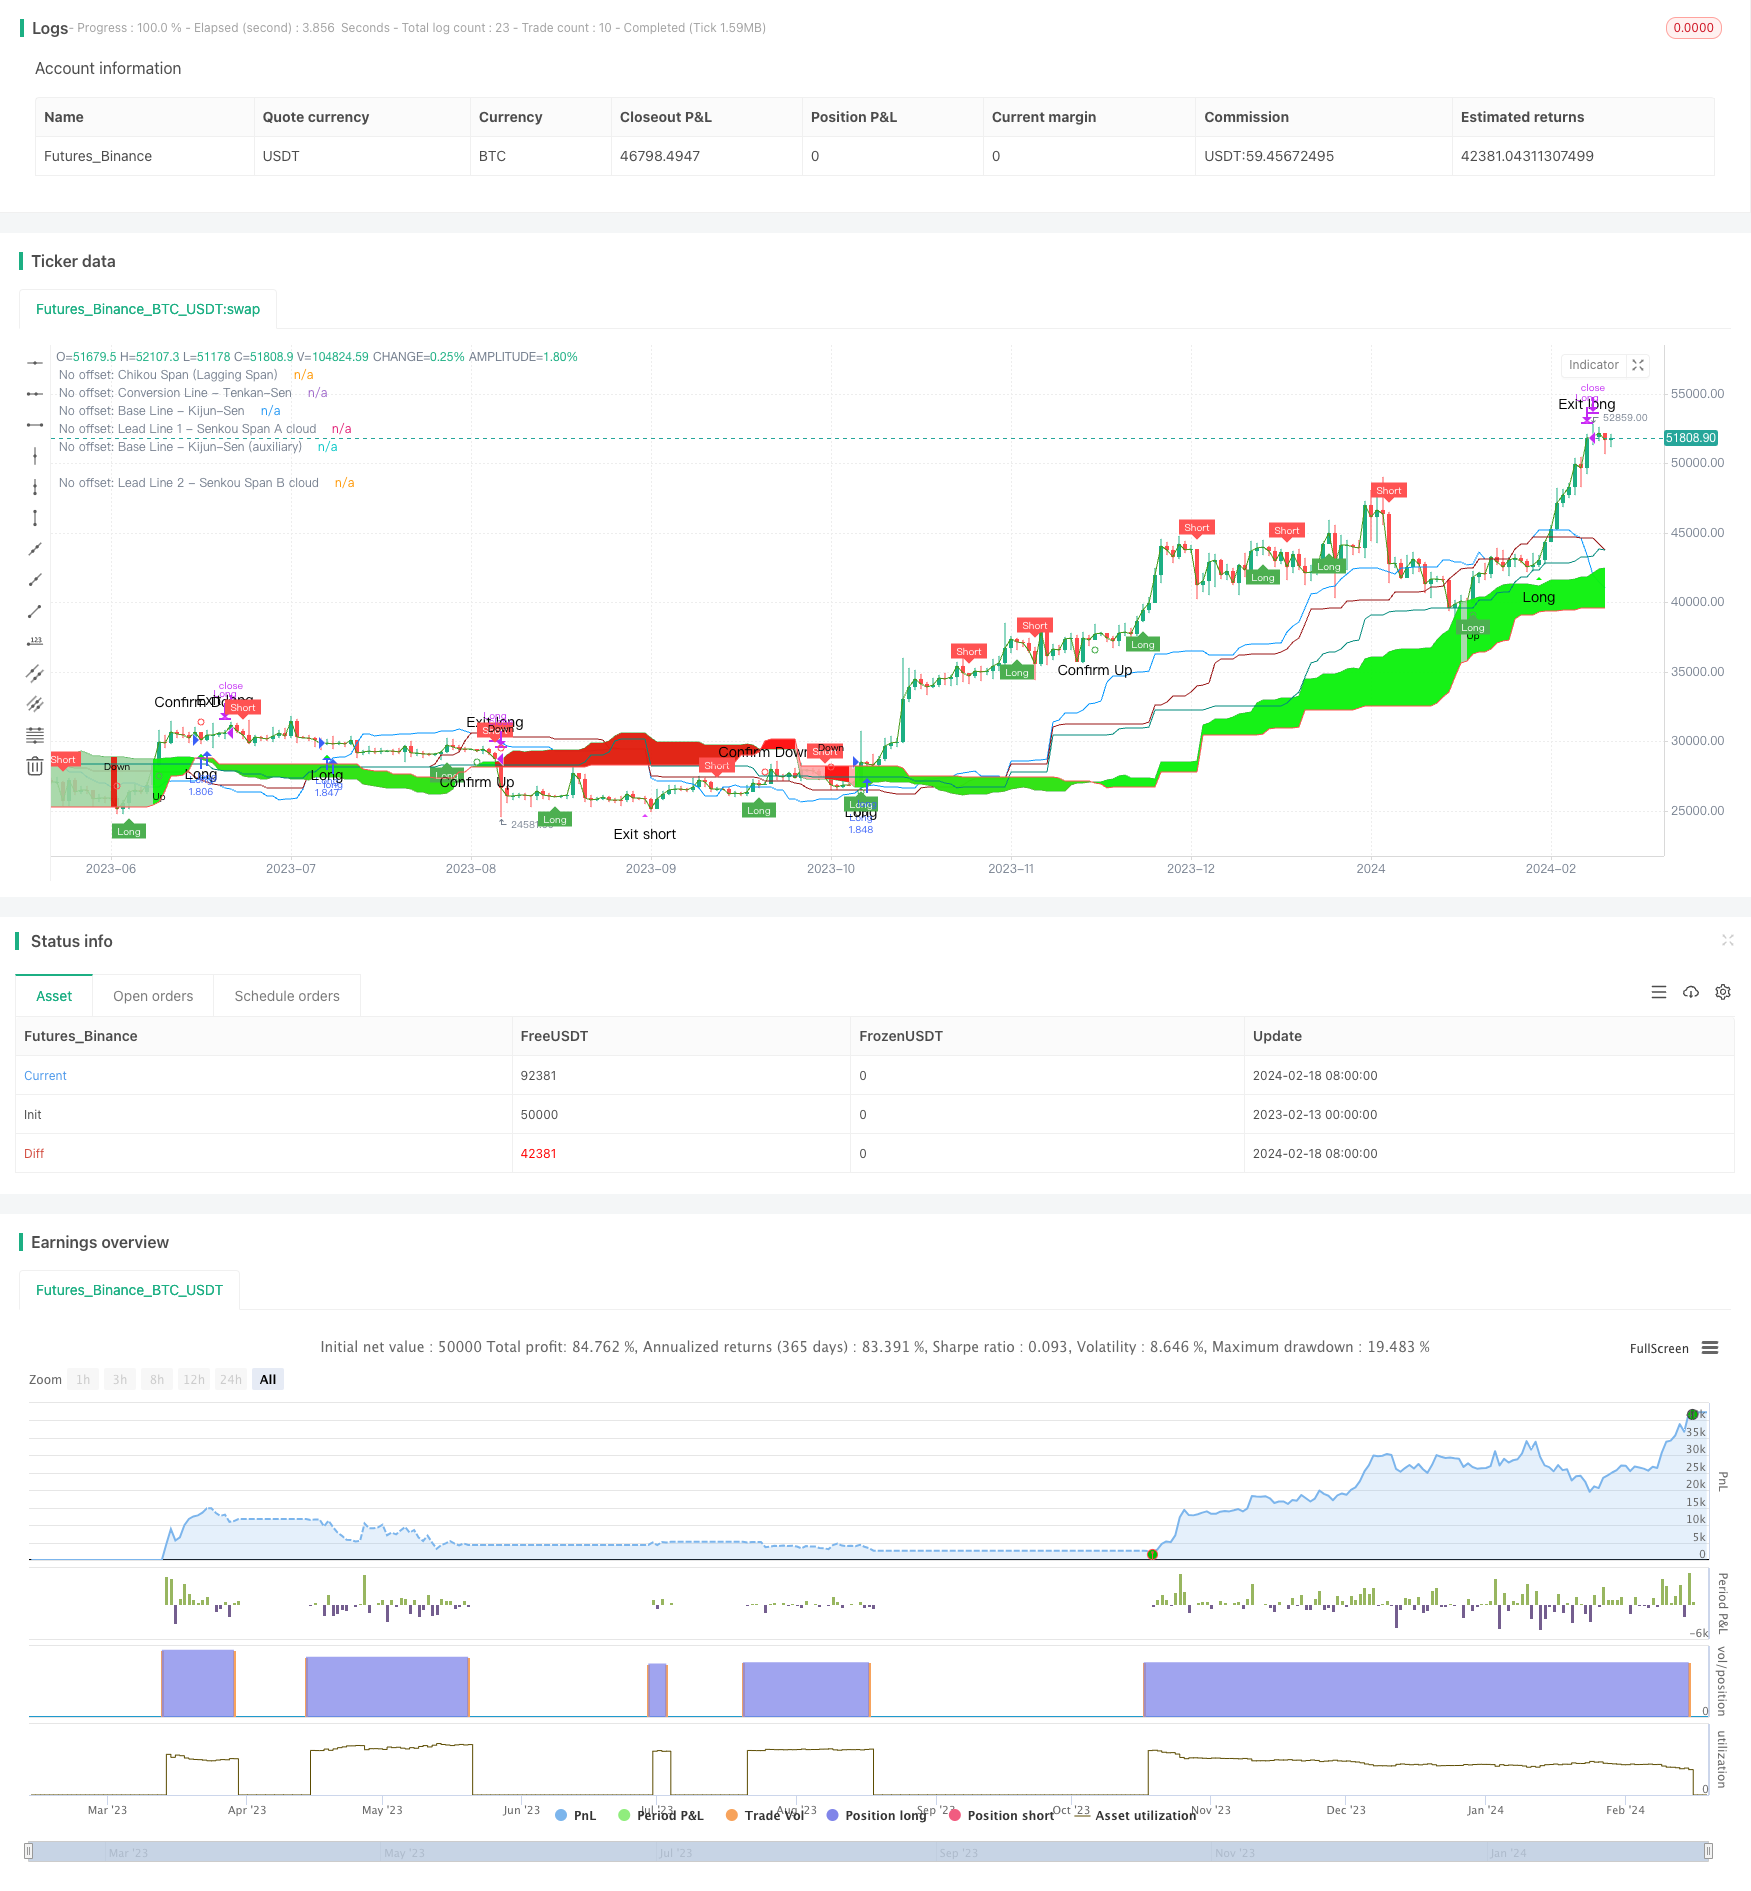
이 전략은 일목적 평형 지표와 이동적 중첩 지표의 조합으로, 주식 가격의 잠재적인 경향을 발견하고, 구매와 판매를 판단하는 데 사용됩니다. 이 전략은 일목적 평형 선을 계산하여, 이동적 중첩 지표와 결합하여 추세 방향을 판단하고 거래 신호를 발송하며, RSI 지표를 사용하여 필터링을 통해 거래 위험을 제어합니다.
전략 원칙
이 전략은 크게 세 부분으로 구성됩니다.
1시 균형 지표: 1시 균형 지표는 주로 전환점 ((Tenkan-Sen) 과 기준점 ((Kijun-sen) 두 개의 선으로 구성되어 있으며, 1시 균형 의 형태를 형성한다. 전환점 선은 가격의 단기 경향을, 기준점 선은 가격의 중기 경향을 나타낸다. 전환점 선과 기준점 선의 교차는 구매 및 판매 신호를 구성한다.
이동 중첩 지표: 이동 중첩 지표는 분산 상대값 간격带와 슬라이드 상대값을 계산하여 트렌드의 방향을 판단한다. 가격이 외부 영역带에서 중간 영역带로 들어올 때 거래 신호가 발생한다.
RSI 지표: RSI 지표는 가격이 오버오프 또는 오버소드 여부를 판단하기 위해 사용되며, 오버 바이 라인 및 오버 소드 범위를 설정하여 이동 중첩 지표의 거래 신호와 함께 구매 및 판매 신호를 판단합니다.
구체적으로, 이 전략은 전환 포인트 라인 및 기준 포인트 라인이 금 포크 (변경 포인트 라인에 기준 포인트 라인을 통과) 및 사형 포크 (변경 포인트 라인에 기준 포인트 라인을 통과) 가 발생하는지 모니터링하여 매매 시점을 판단합니다. 동시에 이동 중첩 지표와 결합하여 전반적인 트렌드 방향을 판단합니다. 두 가지 지표가 동시에 신호를 발산할 때 RSI 지표가 과잉 매매가 없는 경우 거래 신호를 발송합니다.
전략적 이점
이 전략은 트렌드 방향과 거래 시기를 판단하는 다양한 지표의 사용과 결합하여 판단 정확도를 높이고, 지표 간의 상호 보완적 이점을 활용하여 단일 지표 판단 오류의 확률을 피합니다. 구체적인 이점은 다음과 같습니다:
전환점선과 기준점선을 사용하여 초점 균형 지표를 구성하여 단기 경향과 중기 경향을 동시에 반영하여 단일 MA 지표보다 높은 정확성을 판단 할 수 있습니다.
이동 이동 중첩 지표는 전체 경향 방향을 정확하게 판단하고, 초점 균형 지표와 상호 보완된다.
RSI 지표는 필터링 조건을 설정하여 가짜 브레이크를 효과적으로 필터링하여 거래 위험을 피할 수 있습니다.
이 전략은 쉽게 이해하고 실행할 수 있으며, 양적 거래에 적용됩니다.
전략적 위험
이 전략은 여러 지표들을 사용하여 판단을 조율하고 있으며, 잘못된 판단의 가능성을 어느 정도 줄일 수 있지만, 다음과 같은 주요 위험은 여전히 존재합니다.
매개 변수 설정 위험. 전환 포인트 라인, 기준 포인트 라인 등 지표 매개 변수가 잘못 설정되면 거래 신호 오류가 발생할 수 있다. 매개 변수는 다양한 품종에 맞게 최적화해야 한다.
트렌드 반전 위험. 상환 시에는 가짜 신호가 발생할 수 있다. 트렌드 반전 신호를 판단하기 위해 더 많은 지표와 결합해야 한다.
RSI 필터링 조건이 너무 엄격한 위험. 거래 기회를 많이 제거 할 수 있습니다. RSI의 매개 변수를 적절하게 완화 할 수 있습니다.
대응방법:
더 많은 역사 데이터를 사용하여 다양한 품종에 대한 매개 변수를 최적화하여 매개 변수 설정이 합리적인지 확인하십시오.
전략에 스톱로스 메커니즘을 추가한다. 가격이 반대 방향으로 스톱로스 라인을 뚫었을 때 포지션을 종료한다.
RSI의 매개 변수를 최적화하고, 필터링 조건을 적절히 완화하여, 위험을 통제할 수 있는 조건으로 더 많은 거래 기회를 얻습니다.
전략 최적화 방향
이 전략은 계속 개선될 수 있는 방향도 있습니다:
기계 학습 알고리즘을 추가하여 시장 변화에 따라 전략 변수를 동적으로 조정하여 전략 적응력을 향상시킵니다.
전략 구성 요소를 모듈로 포장하여 모듈화 관리하여 구성 요소를 빠르게 교체하거나 개별적으로 테스트하고 최적화하여 개발 효율성을 높일 수 있습니다.
데이터 통합 모듈을 추가하고, 더 많은 데이터 소스에서 시장 데이터를 확보하고, 높은 품질의 훈련 세트를 구성하고, 기계 학습 효과를 향상시킵니다.
전략에 대한 전체적인 재검토 도구 개발, 다양한 평가 지표를 기록, 보조 매개 변수 최적화 조정 및 모델 선택.
클라우드 컴퓨팅 플랫폼을 사용하여 전략 시스템을 배포하고, 탄력적인 컴퓨팅 자원을 활용하여 빠른 병렬 피드백을 수행하고, 매개 변수 조정 반복을 가속화하고, 전략 개발 비용을 절감합니다.
요약하다
이 전략은 한눈에 균형 지표와 이동 중첩 지표 두 지표를 함께 사용하여 가격 추세와 거래 시간을 상호 보완한다. 동시에 RSI 지표를 사용하여 필터링하고 거래 위험을 제어한다. 이러한 다중 지표 조합 전략 형태는 판단 정확도를 높이고 더 나은 전략 효과를 얻을 수 있다. 그러나 전략의 매개 변수 설정 및 지표 선택은 여전히 다양한 품종에 대한 지속적인 테스트 및 최적화가 필요합니다. 전략의 매개 변수 조정 및 지표 선택은 여전히 다양한 제품에 대한 지속적인 테스트 및 최적화가 필요합니다. 전략이 시장 변화에 신속하게 적응하고 지속적인 수익성을 갖기 위해.
/*backtest
start: 2023-02-13 00:00:00
end: 2024-02-19 00:00:00
period: 1d
basePeriod: 1h
exchanges: [{"eid":"Futures_Binance","currency":"BTC_USDT"}]
*/

// This source code is subject to the terms of the Mozilla Public License 2.0 at https://mozilla.org/MPL/2.0/
// © KryptoNight

//@version=4
// comment/uncomment Study/Strategy to easily switch modes
// study("Ichimoku Kinko Hyo Cloud - no offset - no repaint - RSI filter - alerts", shorttitle="IchiCloud + RSI - alerts", overlay=true)
// ============================================================================== Strategy mode - uncomment to activate
strategy("Ichimoku Kinko Hyo Cloud - no offset - no repaint - RSI filter - strategy", shorttitle="IchiCloud + RSI - Strategy Tester Mode", overlay=true, pyramiding = 0,
  currency = currency.EUR, initial_capital = 2000, default_qty_type = strategy.percent_of_equity, default_qty_value = 100,
  calc_on_every_tick = true, calc_on_order_fills = true, commission_type = strategy.commission.percent, commission_value = 0.15)
// ==============================================================================

// ------------------------------------------------------------------------------

ichiCloud_offset   = input(false, title="Standard Ichimoku Cloud")                  // with the visual offset
ichiCloud_noOffset = input(true,  title="Ichimoku Cloud - no offset - no repaint")  // without the visual offset

conversion_prd = input(9, minval=1, title="Conversion Line Period - Tenkan-Sen")
baseline_prd   = input(27, minval=1, title="Base Line Period - Kijun-Sen")
baselineA_prd  = input(52, minval=1, title="Base Line Period - Kijun-Sen (auxiliary)")
leadingSpan_2prd = input(52, minval=1, title="Lagging Span 2 Periods - Senkou Span B")
displacement = input(26, minval=0, title="Displacement: (-) Chikou Span; (+) Senkou Span A")
extra_bars = input(1, minval=0, title="Displacement: additional bars")
laggingSpan_src = input(close, title="Lagging Span price source - Chikou-Span")

donchian(len) => avg(lowest(len), highest(len))
displ = displacement-extra_bars
// ------------------------------------------------------------------------------
// OFFSET:
conversion = donchian(conversion_prd)   // Conversion Line - Tenkan-Sen (9 Period)
baseline  = donchian(baseline_prd)      // Base Line - Kijun-Sen (26 Period)
baselineA = donchian(baselineA_prd)     // Base Line Period - Kijun-Sen (auxiliary)
leadingSpanA = avg(conversion, baseline)
leadingSpanB = donchian(leadingSpan_2prd)
laggingSpan = laggingSpan_src

// Color - bullish, bearish
col_cloud = leadingSpanA>=leadingSpanB ? color.green : color.red

// Cloud Lines
spanA = plot(ichiCloud_offset? leadingSpanA : na, offset=displ, title="Offset: Lead Line 1 - Senkou Span A cloud", color=color.green)
spanB = plot(ichiCloud_offset? leadingSpanB : na, offset=displ, title="Offset: Lead Line 2 - Senkou Span B cloud", color=color.red)
fill(spanA, spanB, color=col_cloud, transp=80, title="Offset: Ichimoku Cloud - Leading Span 1 & 2 based coloring")

// Other Lines
conversion_p = plot(ichiCloud_offset? conversion : na, title="Offset: Conversion Line - Tenkan-Sen", color=#0496ff)
standard_p = plot(ichiCloud_offset? baseline : na, title="Offset: Base Line - Kijun-Sen", color=#991515)
standardA_p = plot(ichiCloud_offset? baselineA : na, title="Offset: Base Line - Kijun-Sen (auxiliary)", color=color.teal)
lagging_Span_p = plot(ichiCloud_offset? laggingSpan : na, offset=-displ, title="Offset: Chikou Span (Lagging Span)", color=#459915)

// ------------------------------------------------------------------------------
// NO OFFSET:
conversion_noOffset = conversion[displ] // Conversion Line - Tenkan-Sen (9 Period)
baseline_noOffset  = baseline[displ]    // Base Line - Kijun-Sen (26 Period)
baselineA_noOffset = baselineA[displ]   // Base Line Period - Kijun-Sen (auxiliary)
leadingSpanA_noOffset = leadingSpanA[displ*2]
leadingSpanB_noOffset = leadingSpanB[displ*2]
laggingSpan_noOffset = laggingSpan[0]

// Color - bullish, bearish
col_cloud_noOffset = leadingSpanA_noOffset>=leadingSpanB_noOffset ? color.green : color.red

// Cloud Lines
spanA_noOffset = plot(ichiCloud_noOffset? leadingSpanA_noOffset : na, title="No offset: Lead Line 1 - Senkou Span A cloud", color=color.green, transp=0)
spanB_noOffset = plot(ichiCloud_noOffset? leadingSpanB_noOffset : na, title="No offset: Lead Line 2 - Senkou Span B cloud", color=color.red, transp=0)
fill(spanA_noOffset, spanB_noOffset, color=col_cloud_noOffset, transp=80, title="No offset: Ichimoku Cloud - Leading Span 1 & 2 based coloring")

// Other Lines
conversion_p_noOffset = plot(ichiCloud_noOffset? conversion_noOffset : na, title="No offset: Conversion Line - Tenkan-Sen", color=#0496ff, transp=0)
baseline_p_noOffset = plot(ichiCloud_noOffset? baseline_noOffset : na, title="No offset: Base Line - Kijun-Sen", color=#991515, transp=0)
baselineA_p_noOffset = plot(ichiCloud_noOffset? baselineA_noOffset : na, title="No offset: Base Line - Kijun-Sen (auxiliary)", color=color.teal, transp=0)
laggingSpan_p_noOffset = plot(ichiCloud_noOffset? laggingSpan_noOffset : na, title="No offset: Chikou Span (Lagging Span)", color=#459915, transp=0)

// ==============================================================================
// Conditions & Alerts (based on the lines without offset)

maxC = max(leadingSpanA_noOffset,leadingSpanB_noOffset)
minC = min(leadingSpanA_noOffset,leadingSpanB_noOffset)

// Trend start signals: crosses between Chikou Span (Lagging Span) and the Cloud (Senkou Span A, Senkou Span B)
uptrend_start   = crossover(laggingSpan_noOffset,maxC)
downtrend_start = crossunder(laggingSpan_noOffset,minC)

// Trends
uptrend   = laggingSpan_noOffset>maxC // Above Cloud
downtrend = laggingSpan_noOffset<minC // Below Cloud

// No trend: choppy trading - the price is in transition
notrend = maxC>=laggingSpan_noOffset and laggingSpan_noOffset>=minC

// Confirmations
uptrend_confirm   = crossover(leadingSpanA_noOffset,leadingSpanB_noOffset)
downtrend_confirm = crossunder(leadingSpanA_noOffset,leadingSpanB_noOffset)

// Signals - crosses between Conversion Line (Tenkan-Sen) and Base Line (Kijun-Sen)
bullish_signal = crossover(conversion_noOffset,baseline_noOffset)
bearish_signal = crossunder(conversion_noOffset,baseline_noOffset)

// Various alerts
alertcondition(uptrend_start,   title="Uptrend Started",   message="Uptrend Started")
alertcondition(downtrend_start, title="Downtrend Started", message="Downtrend Started")

alertcondition(uptrend_confirm,   title="Uptrend Confirmed",   message="Uptrend Confirmed")
alertcondition(downtrend_confirm, title="Downtrend Confirmed", message="Downtrend Confirmed")

alertcondition(bullish_signal, title="Buy Signal",  message="Buy Signal")
alertcondition(bearish_signal, title="Sell Signal", message="Sell Signal")

rsi_OBlevel = input(50, title="RSI Filter: Overbought level (0 = off)")
rsi_OSlevel = input(100,title="RSI Filter: Oversold level (100 = off)")
rsi_len = input(14,title="RSI Length")
rsi_src = input(close,title="RSI Price source")
rsi = rsi(rsi_src,rsi_len)

// Strategy -------------------------------
long_signal  = bullish_signal and uptrend   and rsi<=rsi_OSlevel // breakout filtered by the rsi
exit_long    = bearish_signal and uptrend
short_signal = bearish_signal and downtrend and rsi>=rsi_OBlevel // breakout filtered by the rsi
exit_short   = bullish_signal and downtrend

// Strategy alerts
alertcondition(long_signal, title="Long Signal - Uptrend",      message="Long Signal - Uptrend")
alertcondition(exit_long,   title="Long Exit Signal - Uptrend", message="Long Exit Signal - Uptrend")

alertcondition(short_signal, title="Long Signal - Downtrend",       message="Long Signal - Downtrend")
alertcondition(exit_short,   title="Short Exit Signal - Downtrend", message="Short Exit Signal - Downtrend")

// Plot areas for trend and transition
color_trend = uptrend? #00FF00 : downtrend? #FF0000 : notrend? color.new(#FFFFFF, 50) : na
fill(spanA_noOffset, spanB_noOffset, color=color_trend, transp=90, title="No offset: Ichimoku Cloud - Lagging Span & Cloud based coloring")

plotshape(ichiCloud_noOffset?uptrend_start:na, title="No offset: Uptrend Started", color=color.green, style=shape.circle, location=location.belowbar, size=size.tiny, text="Up")
plotshape(ichiCloud_noOffset?downtrend_start:na, title="No offset: Downtrend Started", color=color.red, style=shape.circle,location=location.abovebar, size=size.tiny, text="Down")

plotshape(ichiCloud_noOffset?uptrend_confirm:na, title="No offset: Uptrend Confirmed", color=color.green, style=shape.circle, location=location.belowbar, size=size.small, text="Confirm Up")
plotshape(ichiCloud_noOffset?downtrend_confirm:na, title="No offset: Downtrend Confirmed", color=color.red, style=shape.circle, location=location.abovebar, size=size.small, text="Confirm Down")

plotshape(ichiCloud_noOffset?long_signal:na, title="No offset: Long Signal", color=#00FF00, style=shape.triangleup, location=location.belowbar, size=size.small, text="Long")
plotshape(ichiCloud_noOffset?exit_long:na, title="No offset: Exit Long Signal", color=color.fuchsia, style=shape.triangledown, location=location.abovebar, size=size.small, text="Exit long")

plotshape(ichiCloud_noOffset?short_signal:na, title="No offset: Short Signal", color=#FF0000, style=shape.triangledown, location=location.abovebar, size=size.small, text="Short")
plotshape(ichiCloud_noOffset?exit_short:na, title="No offset: Exit Short Signal", color=color.fuchsia, style=shape.triangleup, location=location.belowbar, size=size.small, text="Exit short")

// ============================================================================== Strategy Component - uncomment to activate
if (long_signal)
    strategy.entry("Long",strategy.long)
if (exit_long)
    strategy.close("Long")
// if (short_signal)
//    strategy.entry("Short",strategy.short)
// if (exit_short)
//    strategy.close("Short")
// ==============================================================================


//@version=4
// This source code is subject to the terms of the Mozilla Public License 2.0 at https://mozilla.org/MPL/2.0/
// © colinmck


RSI_Period = input(10, title='RSI Length')
SF = input(5, title='RSI Smoothing')
QQE = input(2.438, title='Fast QQE Factor')
ThreshHold = input(10, title="Thresh-hold")

src = close
Wilders_Period = RSI_Period * 3 - 1

Rsi = rsi(src, RSI_Period)
RsiMa = ema(Rsi, SF)
AtrRsi = abs(RsiMa[1] - RsiMa)
MaAtrRsi = ema(AtrRsi, Wilders_Period)
dar = ema(MaAtrRsi, Wilders_Period) * QQE

longband = 0.0
shortband = 0.0
trend = 0

DeltaFastAtrRsi = dar
RSIndex = RsiMa
newshortband = RSIndex + DeltaFastAtrRsi
newlongband = RSIndex - DeltaFastAtrRsi
longband := RSIndex[1] > longband[1] and RSIndex > longband[1] ? max(longband[1], newlongband) : newlongband
shortband := RSIndex[1] < shortband[1] and RSIndex < shortband[1] ? min(shortband[1], newshortband) : newshortband
cross_1 = cross(longband[1], RSIndex)
trend := cross(RSIndex, shortband[1]) ? 1 : cross_1 ? -1 : nz(trend[1], 1)
FastAtrRsiTL = trend == 1 ? longband : shortband

// Find all the QQE Crosses

QQExlong = 0
QQExlong := nz(QQExlong[1])
QQExshort = 0
QQExshort := nz(QQExshort[1])
QQExlong := FastAtrRsiTL < RSIndex ? QQExlong + 1 : 0
QQExshort := FastAtrRsiTL > RSIndex ? QQExshort + 1 : 0

//Conditions

qqeLong = QQExlong == 1 ? FastAtrRsiTL[1] - 50 : na
qqeShort = QQExshort == 1 ? FastAtrRsiTL[1] - 50 : na

// Plotting

plotshape(qqeLong, title="QQE long", text="Long", textcolor=color.white, style=shape.labelup, location=location.belowbar, color=color.green, transp=0, size=size.tiny)
plotshape(qqeShort, title="QQE short", text="Short", textcolor=color.white, style=shape.labeldown, location=location.abovebar, color=color.red, transp=0, size=size.tiny)

// Alerts

alertcondition(qqeLong, title="Long", message="Long")
alertcondition(qqeShort, title="Short", message="Short")