개요
이 전략은 부린 띠 지표, RSI 지표 및 다중 시간 프레임 분석을 결합하여 중장선 트렌드의 방향을 잡기 위해 고안되었습니다. 부린 띠의 경로 및 경로 돌파를 통해 RSI 오버 바이드 시그널과 결합하여 트렌드 반전 지점을 판단하여 낮은 위험 진입을 달성합니다. 동시에 더 높은 시간 프레임 필터를 사용하여 흔들림 현상을 피하십시오.
전략 원칙
부린 띠 지표를 적용하여 가격 돌파를 판단한다. 부린 띠 중간 궤도는 N일 종전 가격의 이동 평균이며, 상단 및 하단 궤도는 각각 중간 궤도 상단에서 각각 하나의 표준 차이다. 종전 가격이 상단 궤도를 돌파 할 때 강한 신호이며, 하단 궤도를 돌파 할 때 약한 신호이다.
RSI 지표와 결합하여 과매매 현상을 판단한다. RSI가 70보다 크면 과매매 지역이며, 30보다 작으면 과매매 지역이다. RSI가 아래에서 위쪽으로 70을 돌파하면 과매매 상태에 있다고 간주되며, 부린은 상승 궤도 돌파구를 트렌드 반전의 확인으로 간주한다.
더 높은 시간 프레임 필터링 가짜 돌파를 적용하십시오. 당일 라인에서 돌파 신호가 발생하면 확인으로 4 시간 또는 더 높은 시간 프레임이 필요합니다.
전략적 이점
다중 지표 통합은 전략의 안정성과 수익률을 향상시킵니다.
RSI 지표는 반전점을 판단하여 가짜 돌파구로 인한 손실을 줄일 수 있습니다.
여러 시간 프레임 분석, 효율적인 필터링 흔들림의 움직임, 함정을 피한다.
브레이크 신호 판단 최적화 ((3개의 K선 모두 브린을 뚫고 내려가야 한다), 트렌드 개발이 성숙해지면 다시 진입할 수 있도록 한다.
포텍스 지표는 트렌드 방향을 판단하고, 새로운 트렌드가 형성되기 시작하는 것을 포착할 수 있다.
전략적 위험
부린 대역 변수 설정이 잘못되면 과매매 신호 오류가 발생할 수 있다.
RSI 파라미터 설정은 다양한 품종에 따라 합리적인 값을 결정해야 한다.
돌파 신호는 가짜 돌파가 발생할 수 있으며, 적절히 스톱 손실 차이를 확대해야 한다.
ATR 지표의 3배에 해당하는 충분한 스톱로스 범위를 보장한다.
전략 최적화 방향
머신러닝 알고리즘을 적용하여 브린밴드 및 RSI의 매개 변수를 실시간으로 최적화한다.
변동률 지표를 활용하여 스톱로스 차이를 최적화한다.
거래량 제어 모듈을 추가하여 시장 변화에 따라 포지션을 조정합니다.
자금 관리 원칙에 따라 단일 거래 손실 비율을 제한하십시오.
다른 거래 시점에서의 브레이크 신호의 안정성을 평가한다.
요약하다
이 전략은 종합적으로 트렌드 판단, 과매매 현상, 다중 시간 프레임 분석 등의 여러 가지 기술 지표를 고려하고, 위험을 통제하는 전제 하에, 적절한 진출 시기를 선택하고, 중장선 질적 트렌드를 포착하여, 더 나은 수익과 적자를 얻을 수 있습니다. 또한, 추가적인 최적화 공간도 있으며, 매개 변수 조정, 손해 제도를 개선하는 등의 수단으로 더 뛰어난 투자 성과를 얻을 수 있습니다.
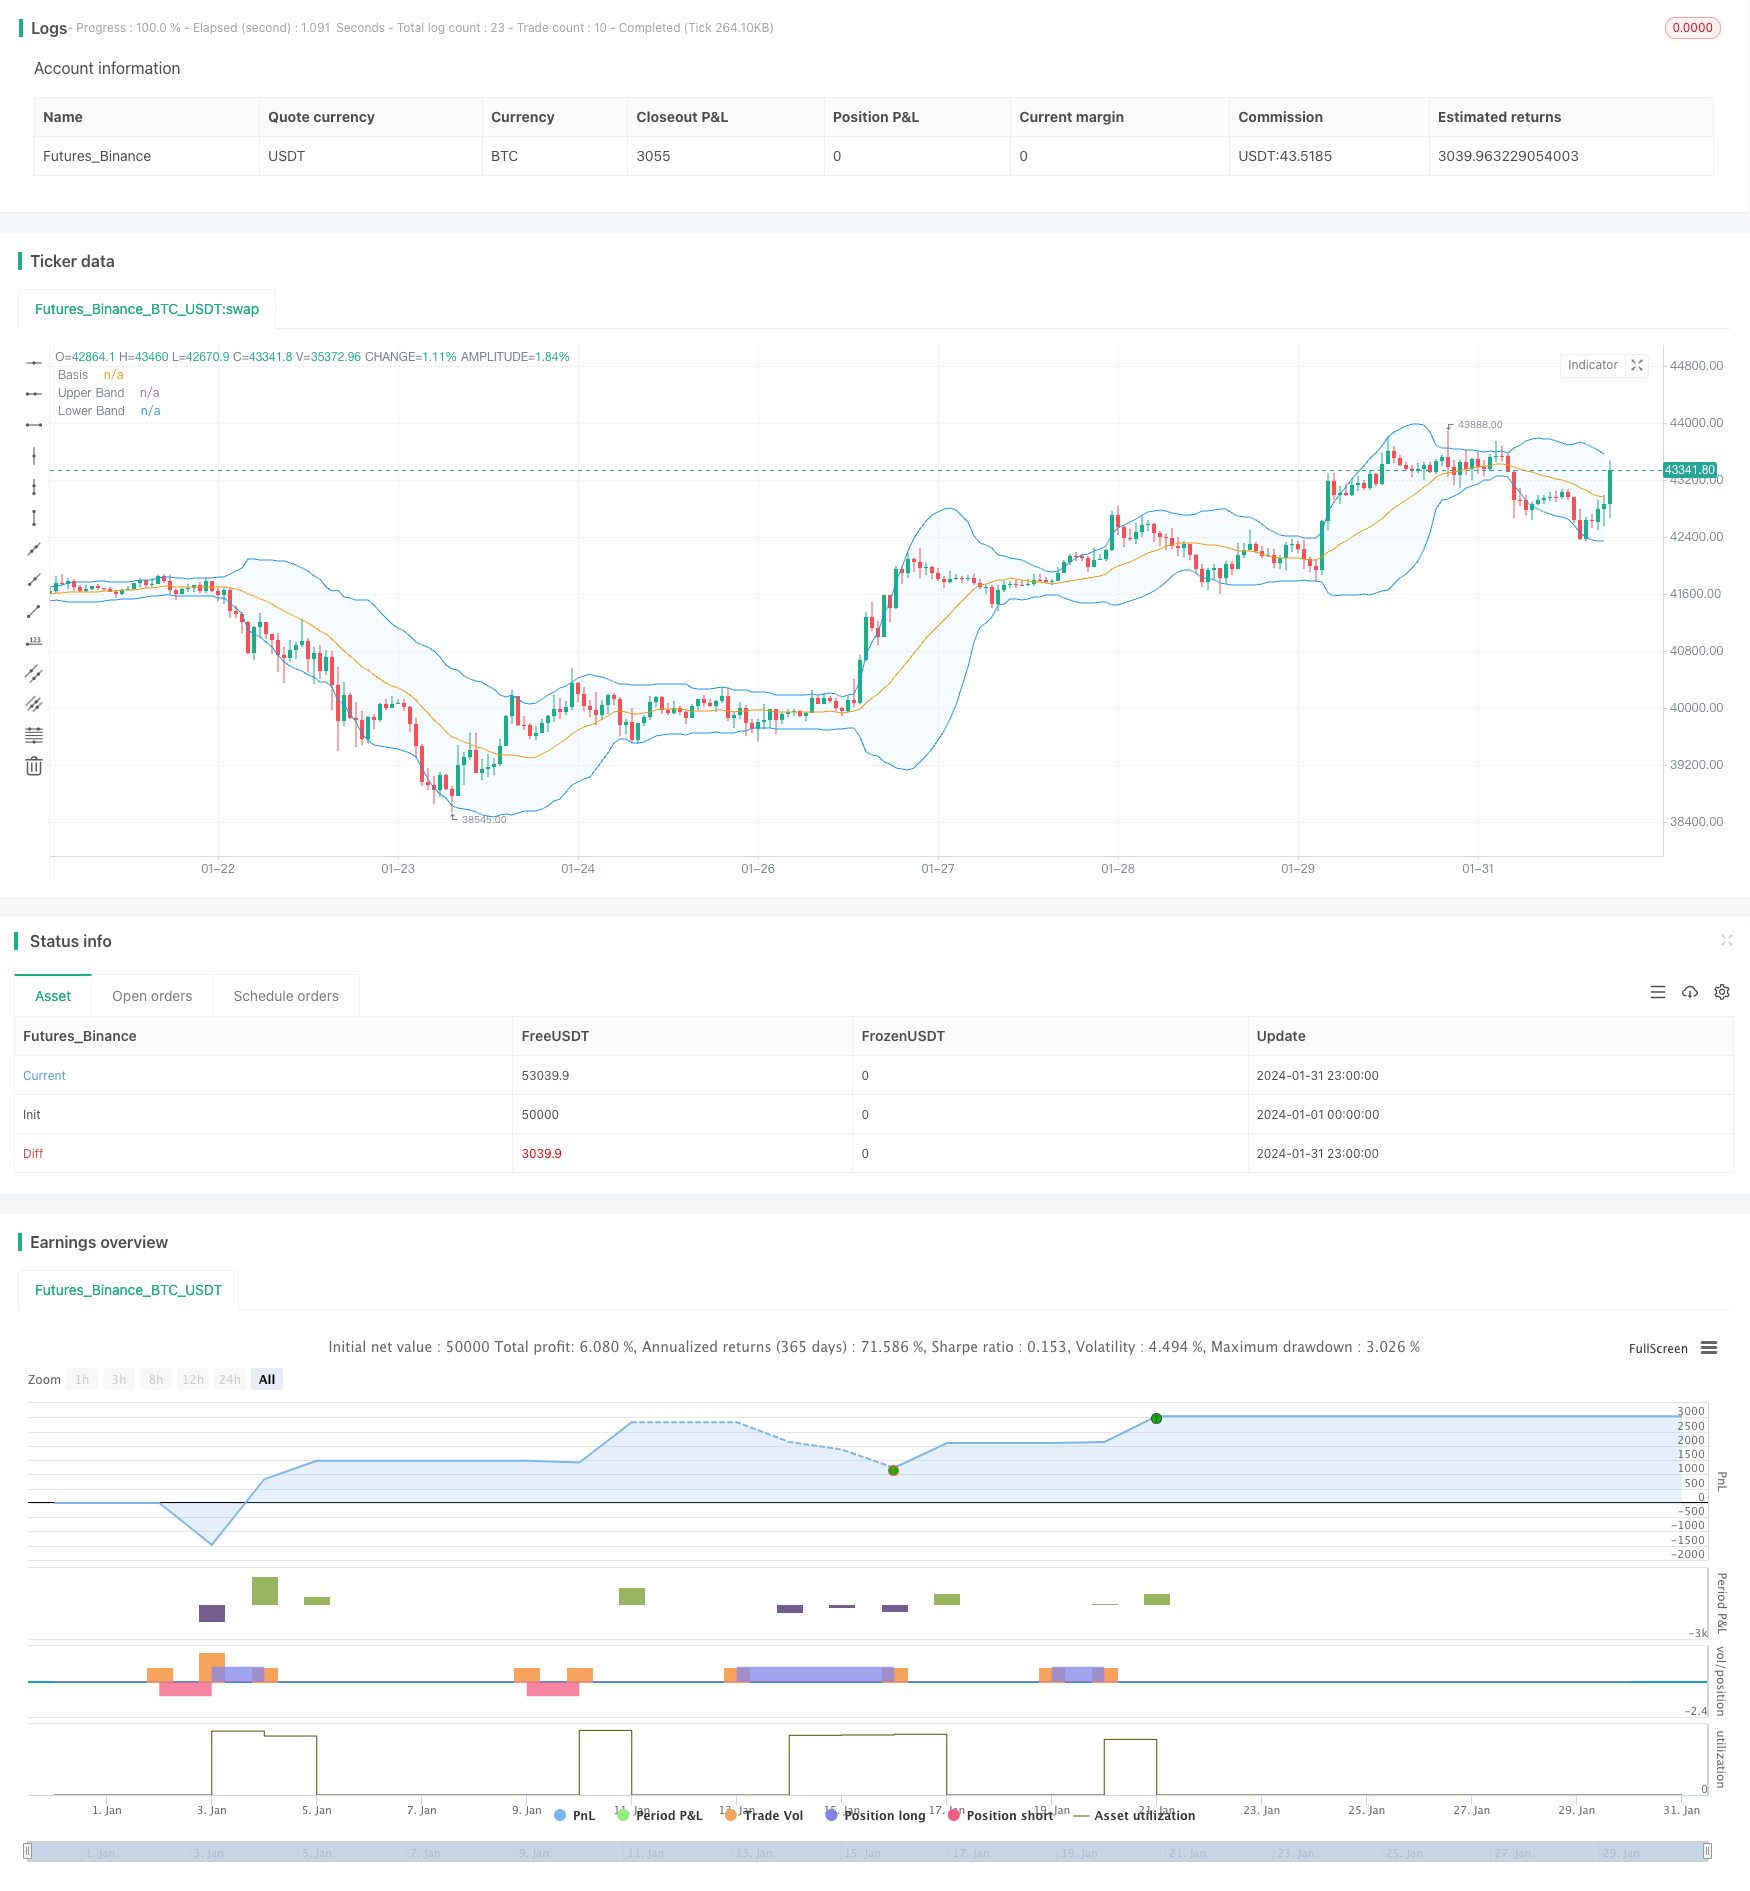
/*backtest
start: 2024-01-01 00:00:00
end: 2024-01-31 23:59:59
period: 1h
basePeriod: 15m
exchanges: [{"eid":"Futures_Binance","currency":"BTC_USDT"}]
*/

// This Pine Script™ code is subject to the terms of the Mozilla Public License 2.0 at https://mozilla.org/MPL/2.0/
// © Noway0utstorm
//@version=5
strategy(title='Vortex0.71.3 + bb 3bar breakout + rsi - close hit upper or lower', shorttitle='truongphuthinh', format=format.price, precision=4,overlay = true)

length = input(20, title="Length")
mult = input(2.0, title="Multiplier")
source = close

basis = ta.sma(source, length)
dev = mult * ta.stdev(source, length)

upperBand = basis + dev
lowerBand = basis - dev

isClosedBar = ta.change(time("15"))

var bool closeAboveUpperBand = false
var bool closeBelowLowerBand = false


// Vortex Indicator Settings
period_ = input.int(14, title='Period', minval=2)

VMP = math.sum(math.abs(high - low[1]), period_)
VMM = math.sum(math.abs(low - high[1]), period_)
STR = math.sum(ta.atr(1), period_)
VIP = VMP / STR
VIM = VMM / STR

//
lengthrsi = input(14, title="RSI Length")
overboughtLevel = input(70, title="Overbought Level")
oversoldLevel = input(30, title="Oversold Level")

sourcersi = close
rsiValue = ta.rsi(sourcersi, lengthrsi)

shouldShort = rsiValue > overboughtLevel
shouldLong = rsiValue < oversoldLevel


if bool(isClosedBar[1]) and bool(isClosedBar[2]) and bool(isClosedBar[3])

    if close[1] > upperBand[1] and close[2] > upperBand[2] and close[3] > upperBand[3] and VIP > 1.25 and VIM < 0.7 and rsiValue > overboughtLevel
        strategy.entry("Short", strategy.short)
        closeAboveUpperBand := false  // Reset the condition when entering a new Short position
    if close[1] < lowerBand[1] and close[2] < lowerBand[2] and close[3] < lowerBand[3] and VIP < 0.7 and VIM > 1.25 and rsiValue < oversoldLevel
        strategy.entry("Long", strategy.long)
        closeBelowLowerBand := false  // Reset the condition when entering a new Long position


if strategy.position_size > 0  // Check if there is an open Long position
    closeAboveUpperBand := close > upperBand  // Update the condition based on close price
    if closeAboveUpperBand
        strategy.close("Long",disable_alert=true)  // Close the Long position if close price is above upper band

if strategy.position_size < 0  // Check if there is an open Short position
    closeBelowLowerBand := close < lowerBand  // Update the condition based on close price
    if closeBelowLowerBand
        strategy.close("Short",disable_alert=true)  // Close the Short position if close price is below lower band

// Plots
plot(basis, color=color.orange, title="Basis")
p1 = plot(upperBand, color=color.blue, title="Upper Band")
p2 = plot(lowerBand, color=color.blue, title="Lower Band")
fill(p1, p2, title = "Background", color=color.rgb(33, 150, 243, 95))