이동평균선 교차를 기반으로 한 추세 추종 전략

1
Follow
1782
Followers
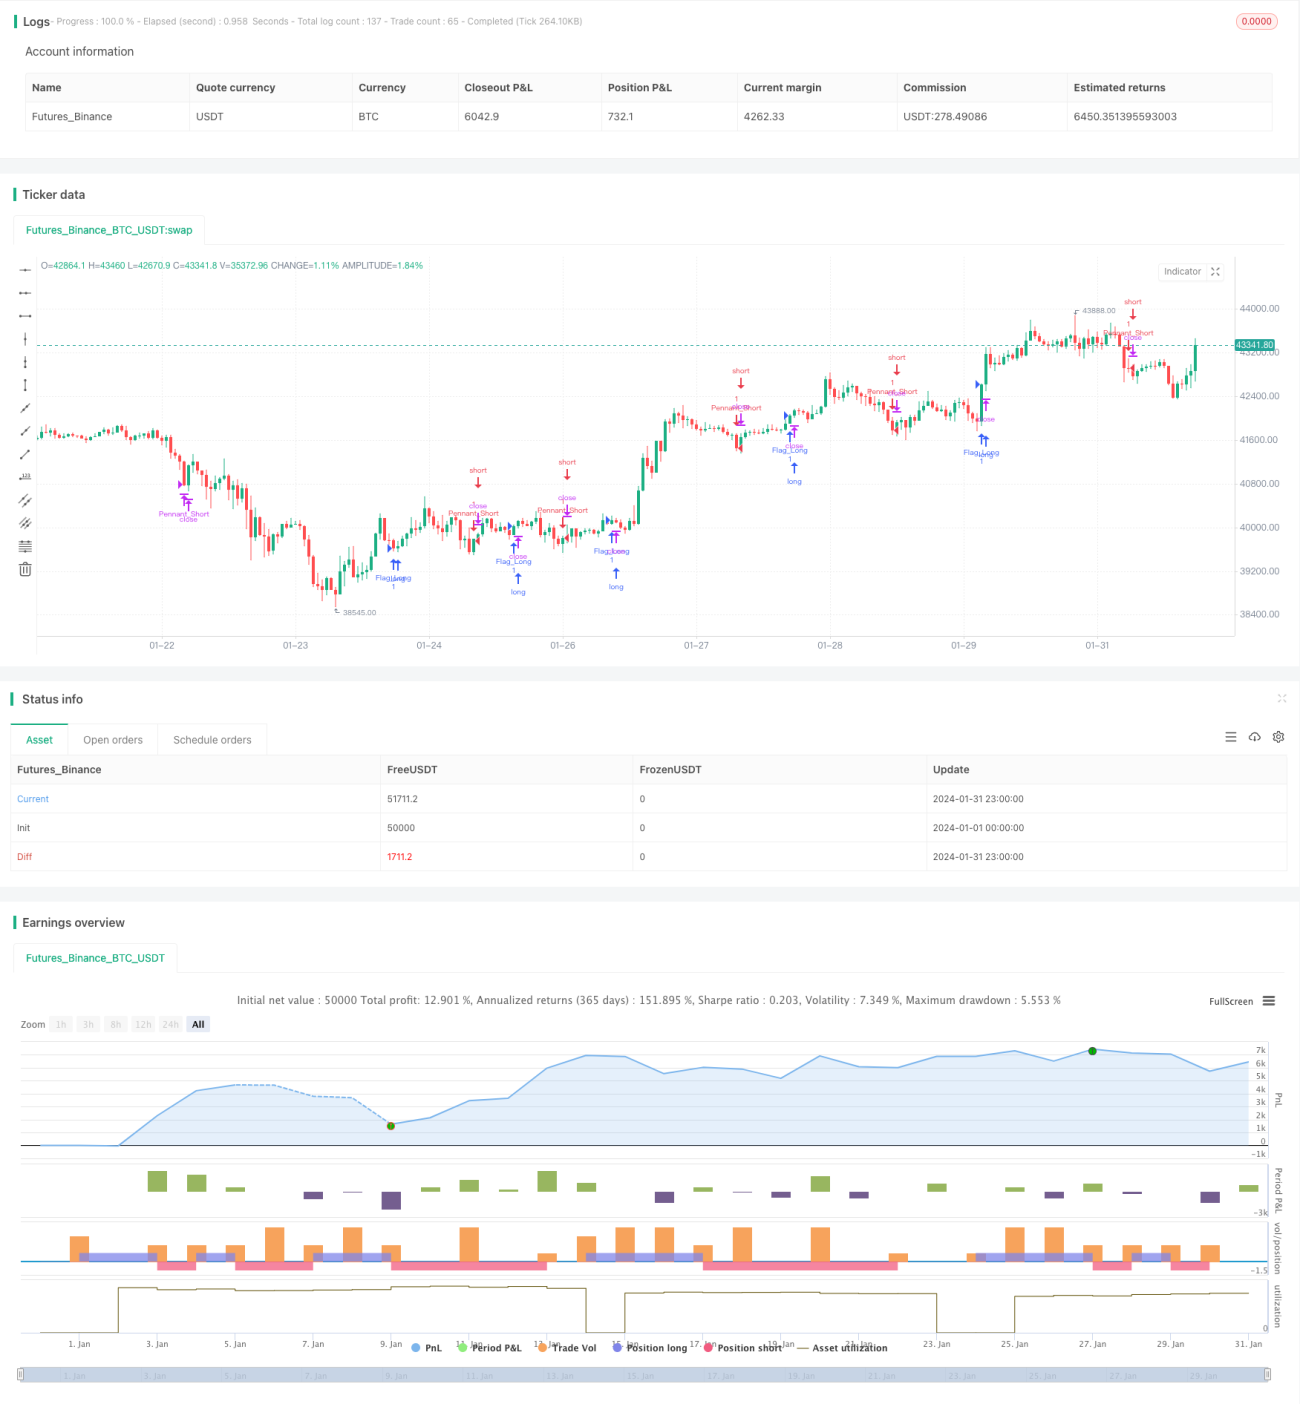
개요
이 전략은 평행선 교차를 기반으로 시장의 경향 방향을 판단하고 트렌드를 추적하는 양적 거래 전략이다. 이 전략은 여러 개의 다른 파라미터의 간단한 이동 평균의 교차를 사용하여 구매와 판매의 시간을 판단한다.
전략 원칙
이 전략의 주요 판단 규칙은 다음과 같습니다.
- 단기 평균이 하향에서 장기 평균을 돌파할 때, 즉 시장이 다방면으로 갈 가능성이 있는 경우, 이 때 더 많이 할 수 있습니다.
- 단기 평균이 상향에서 하향으로 내려가 장기 평균을 넘어서면, 시장이 상향 추세로 진입할 수 있음을 나타냅니다.
- 다른 변수들의 평균선을 사용하여 다른 수준의 트렌드를 판단하고, 다른 시간대의 트렌드 추적을 구현한다.
구체적으로, 전략은 20 일선, 30 일선, 50 일선, 60 일선 및 200 일선 5 개의 이동 평균을 사용합니다. 20 일선이 50 일선을 상향으로 가로질러 구매 신호로 판단하고, 10 일선이 30 일선을 하향으로 가로질러 판매 신호로 판단합니다. 다른 매개 변수의 평균선을 사용하여 더 장기 및 더 단기 경향 방향을 판단 할 수 있습니다.
전략적 이점
이 평행선 교차에 기반한 트렌드 추적 전략은 다음과 같은 장점이 있습니다.
- 이 프로젝트의 핵심은,
- 시장의 동향과 강점을 효과적으로 판단할 수 있습니다.
- 다양한 파라미터 설정으로 다양한 시간대의 트렌드 추적이 가능합니다.
- 커스터마이징도 가능하며, 자신의 필요에 따라 평균선 파라미터를 조정할 수 있다.
전략적 위험
이 전략에는 몇 가지 위험도 있습니다.
- 평균선에는 지연성이 있어 지연이 발생할 수 있습니다.
- 잘못된 평균선 변수 설정으로 인해 과도한 거래 신호와 불필요한 손실이 발생할 수 있습니다.
- 이 전략은 재조합 시점에 사용되지 않도록 주의해야 하며, 명확한 추세 시점에 사용해야 한다.
위험을 줄이기 위해, 우리는 평균선 변수를 조정하고, 변수 설정을 최적화할 수 있으며, 다른 지표들을 사용하여 의사결정을 보조할 수 있습니다.
전략 최적화 방향
우리는 다음과 같은 몇 가지 측면에서 이 전략을 개선할 수 있습니다.
- 평균선 변수를 최적화하여 최적의 변수 조합을 찾아 거래 빈도를 낮추고 동시에 수익률을 높이는 방법
- 다른 기술적인 지표들을 추가하여 결정의 정확성을 높이는 것, 예를 들어 RSI, KD 등;
- 제3항은 "지속적 손실을 방지하기 위한 전략"을 추가하고, 제3항은 "지속적 손실을 방지하기 위한 전략"을 추가하고, 제3항은 "지속적 손실을 방지하기 위한 전략"을 추가하고,
- 복잡한 기계 학습 모델과 결합하여 변수 최적화 및 전략 평가를 수행하고, 계속 반복적으로 업그레이드합니다.
요약하다
이 전략은 매우 기초적인 트렌드 추적 전략이다. 이 전략은 평행선 교차 원칙을 사용하여 시장의 트렌드 방향을 판단하고, 간단하고 효과적이며 이해하기 쉬운 구현이다. 우리는 이 기초를 기반으로 더 복잡한 양적 거래에 적용할 수 있도록 많은 확장과 최적화를 할 수 있다.
Source
Pine
Related strategies
Comment
All comments (0)
No data
- 1