개요
쌍선 돌파 금포크 사형포크 트렌드 추적 전략은 지지 저항선과 이동 평균을 대안 선택 신호로 동시에 사용하는 트렌드 추적을 위한 양자형 거래 전략이다. 이 전략은 가격의 지지 저항선과 이동 평균의 금포크 사형포크 신호를 다양한 시간대에 걸쳐 종합적으로 고려하고, 가격 돌파가 중요한 지지 및 저항 위치를 포착할 때, 트렌드 지표 필터와 결합하여 다중 공백 기회를 만들고, 트렌드 변화의 초기에 입장을 열고, 중장선 트렌드를 추적하는 수익 목표를 달성한다.
전략 원칙
이 전략은 크게 4가지로 구성되어 있습니다.
- 30일 최저지점 지각선
- 30주 최고점으로 지정된 저항선
- 10일 간단한 이동 평균, 트렌드 필터링 트레이드 신호를 확인하기 위한
- Identification 모듈을 뚫고 가격의 중요한 저항 지점을 돌파하는 거래 기회를 식별합니다.
구체적으로, 전략은 먼저 요청 Security 함수를 사용하여 30 일 및 30 주간의 최고 가격과 최저 가격을 얻으며, 각각 동적인 지지선과 저항선을 구분한다. 그리고 10 일 이동 평균의 골드 포크 및 데드 포크 신호를 결합하여 거래 기회를 뚫기 위해 필터링한다. 가격이 30 일 내의 지지선과 10 일 평균선보다 높으면 다중 신호가 발생하며, 가격이 30 주 내의 저항선과 10 일 평균선보다 낮으면 빈 신호가 발생한다.
이 전략은 중단계와 중장선의 지지 저항을 동시에 고려하여 큰 트렌드 기회를 잡을 수 있다. 이동 평균과 결합하면 흔들림 트렌드에서 잘못된 신호를 효과적으로 필터링 할 수 있다.
우위 분석
이 전략에는 다음과 같은 장점이 있습니다.
- 중단선과 중장선의 지지 저항 지점을 활용하여 더 큰 돌파구를 포착할 수 있다.
- 이동평균선의 필터를 증가시켜 손실을 효과적으로 제어하고, 진동 중에 잘못된 신호를 피한다.
- 동적 업데이트는 새로운 트렌드 방향을 잡기 위해 저항 지점을 지원합니다.
- 리스크 관리를 통한 스톱 로스 제약은 수익을 보장하는 데 도움이 됩니다.
위험 분석
이 전략에는 몇 가지 위험도 있습니다.
- 돌파형 전략은 거래 시간에 대한 지지를 요구하며, 앞선 또는 뒤진 문제가 발생할 수 있다.
- 지원 저항 지점이 실패하면 잘못된 신호와 큰 손실이 발생할 수 있다.
- 이동 평균 자체는 가격에 뒤쳐져 있고, 트렌드 전환점을 놓칠 수도 있다.
- 소규모 투자자에게는 적합하지 않은 철회 위험성이 높습니다.
대응방법:
- 더 많은 필터링 조건을 도입하기 위해 브레이크 인식 논리를 적절하게 조정하십시오.
- 이동 평균의 주기 변수를 증가시켜 트렌드가 안정된 후에만 신호를 생성하도록 한다.
- 단위 손실을 통제하기 위해 합리적으로 스톱포트를 설정하십시오.
최적화 방향
이 전략에는 더 많은 최적화 가능성이 있습니다:
- ATR와 같은 변동률 지표와 결합하여 더 합리적인 스톱 스톱 을 결정하려고 노력하십시오.
- 기계학습 모형을 추가하여 핵심 지지 저항의 부작용을 판단한다.
- 트렌드 반전을 더 빨리 잡기 위해 적응형 이동 평균을 사용하십시오.
- 다양한 품종의 매개 변수에 맞게 조정 최적화
요약하다
쌍선 돌파 금叉死叉 트렌드 추적 전략은 중장선의 지지 저항치와 이동 평균 지표를 거래 신호로 종합적으로 고려하여, 큰 트렌드 배경에서 효율적으로 노이즈를 필터링하여 수익을 창출할 수 있으며, 비교적 성숙한 정량 거래 전략이다. 이 전략의 최적화 공간은 여전히 넓으며, 손해 중지 메커니즘, 변수 자조 등의 측면에서 개선할 수 있으며, 기계 학습과 같은 새로운 방법을 도입하여 전략의 안정성을 향상시킬 수도 있다.
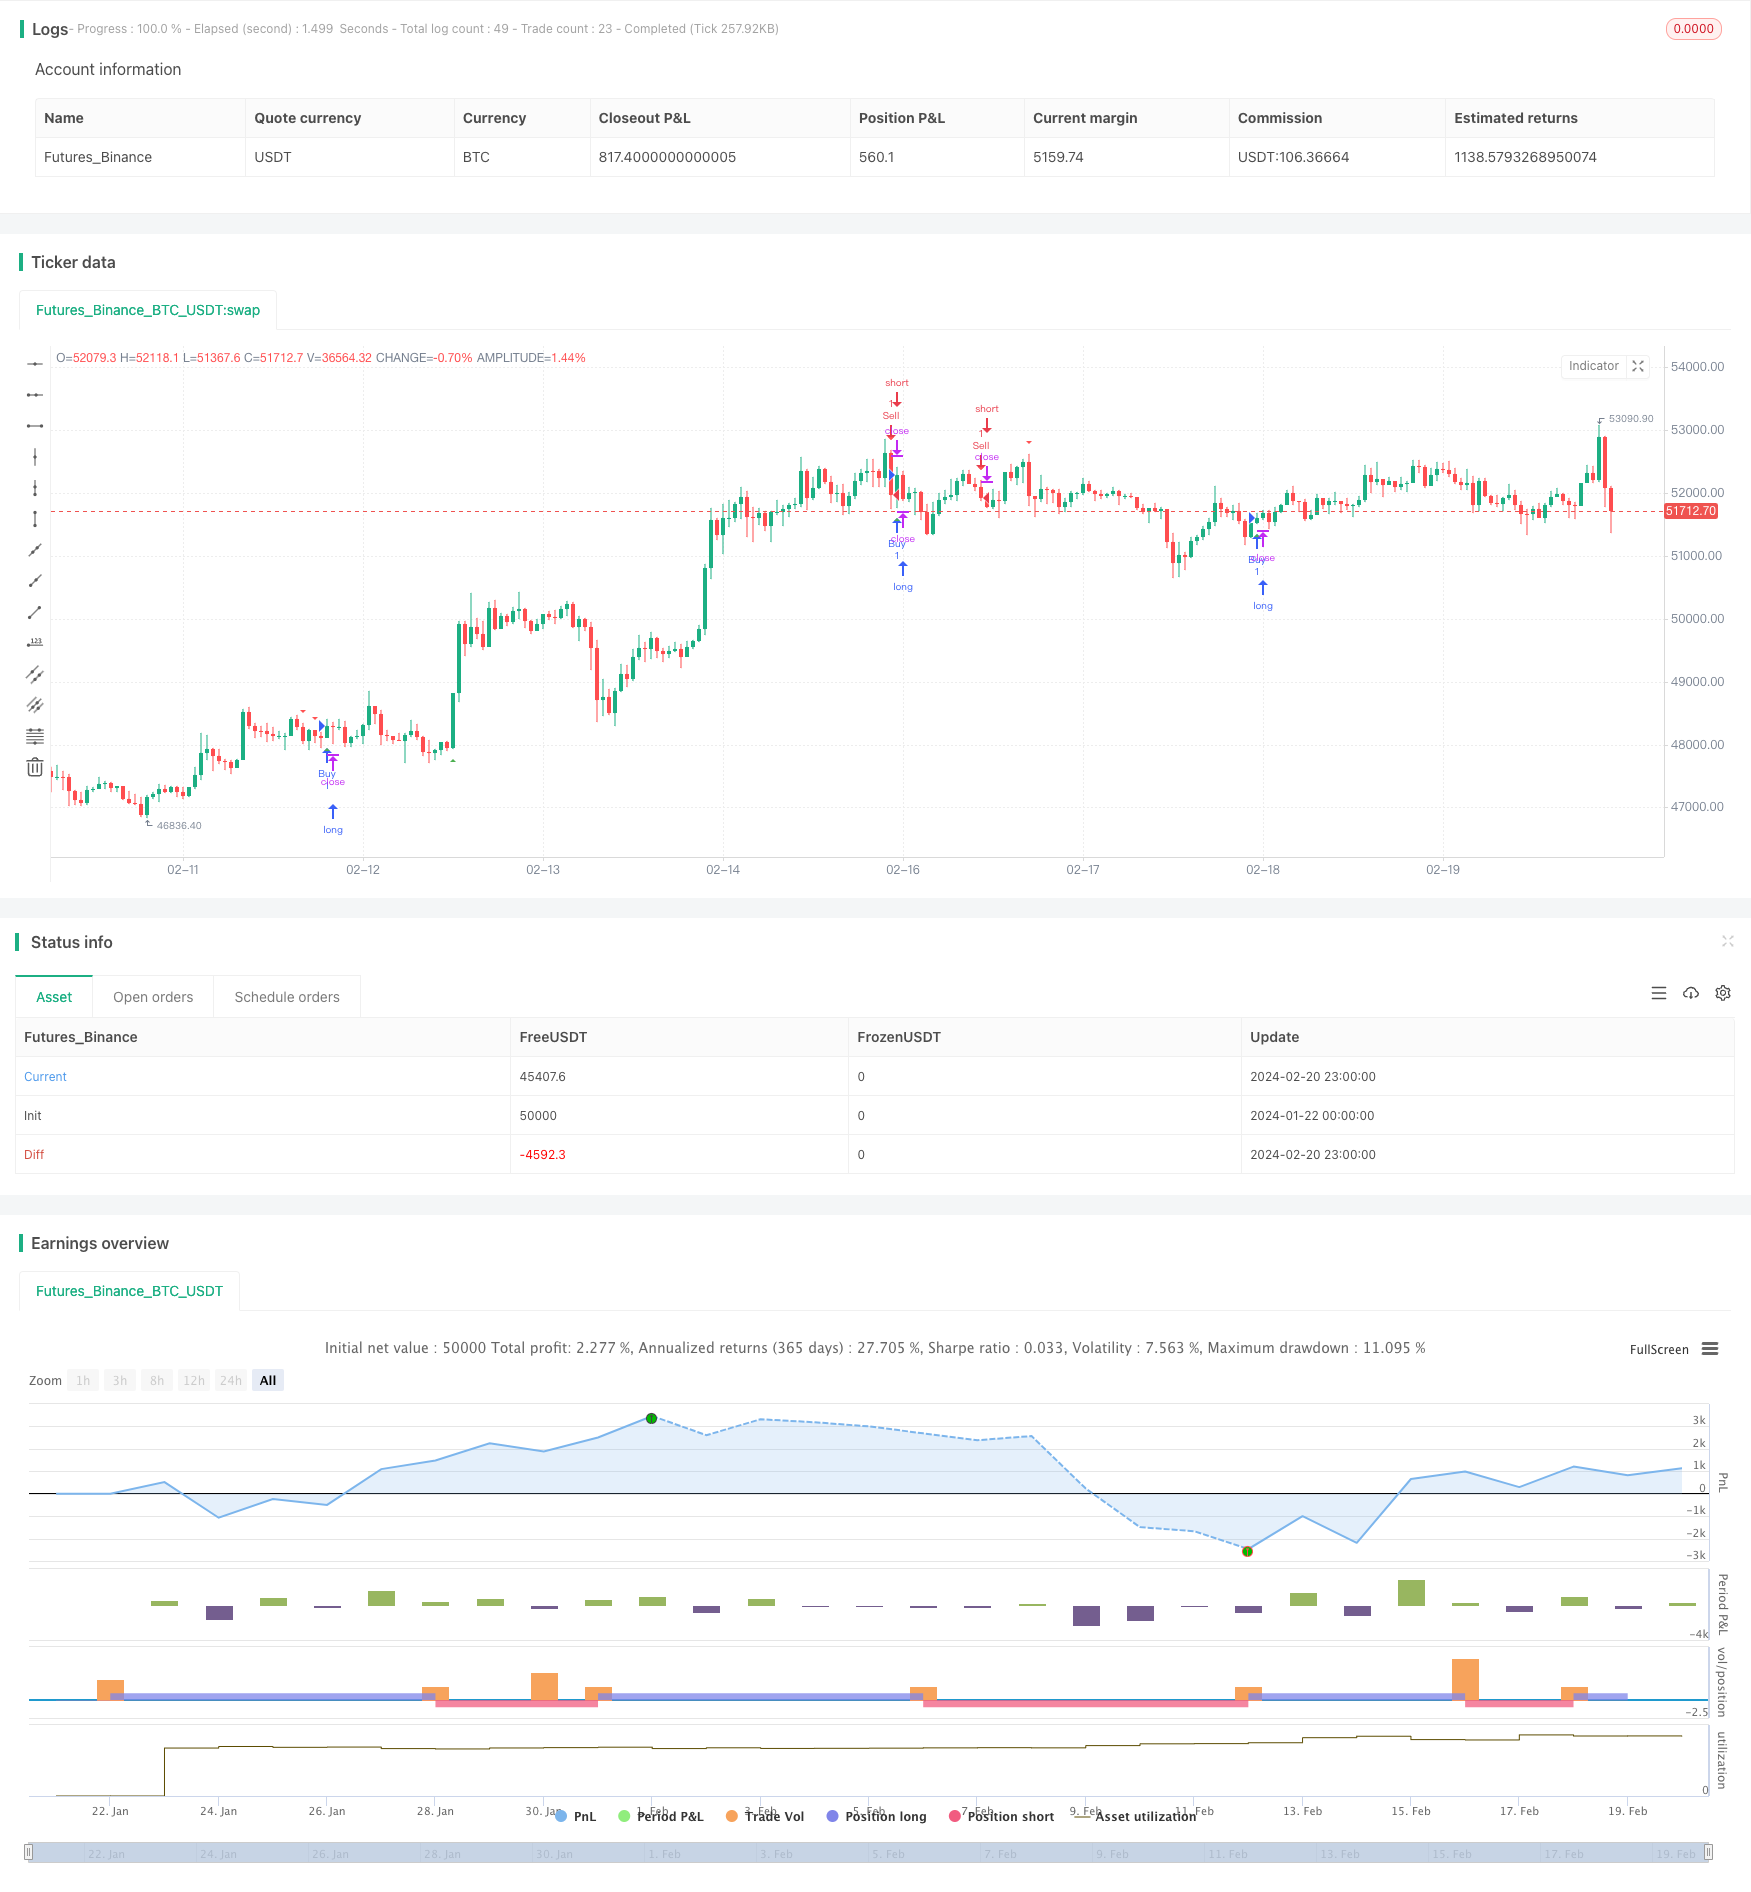
/*backtest
start: 2024-01-22 00:00:00
end: 2024-02-21 00:00:00
period: 1h
basePeriod: 15m
exchanges: [{"eid":"Futures_Binance","currency":"BTC_USDT"}]
*/

// This Pine Script™ code is subject to the terms of the Mozilla Public License 2.0 at https://mozilla.org/MPL/2.0/
// © neosaid

//@version=5
strategy("Support and resistant Strategy", overlay=true)

// Function to check for breakout
f_breakoutCondition(closingPrice, highestHigh, lowestLow) =>
    closingPrice > highestHigh or closingPrice < lowestLow

// Step 1: 30 Days Trend Line (Lower Lows)
low30Days = request.security(syminfo.tickerid, "D", low)

// Step 2: 30 Weeks Upper Trend Line (Higher Highs)
high30Weeks = request.security(syminfo.tickerid, "W", high)

// Step 3: Trend Line for Lowest Low within the Last Month
var float lowestLowLastMonth = na
for i = 0 to 29
    lowestLowLastMonth := na(lowestLowLastMonth) ? low[i] : math.min(lowestLowLastMonth, low[i])

lowestLowLastMonthValue = lowestLowLastMonth[1]

// Breakout Strategy
highestHighLast3Candles = request.security(syminfo.tickerid, "D", ta.highest(close, 3))
lowestLowLast3Candles = request.security(syminfo.tickerid, "D", ta.lowest(close, 3))

// Additional conditions to filter signals
buyCondition = f_breakoutCondition(close, highestHighLast3Candles, lowestLowLast3Candles) and close > low30Days

sellCondition = f_breakoutCondition(close, highestHighLast3Candles, lowestLowLast3Candles) and close < high30Weeks

// Additional filters to reduce the number of orders
buyFilter = ta.crossover(close, ta.sma(close, 10)) // Buy only when price crosses above a 10-period SMA
sellFilter = ta.crossunder(close, ta.sma(close, 10)) // Sell only when price crosses below a 10-period SMA

buyCondition := buyCondition and buyFilter
sellCondition := sellCondition and sellFilter

// Plot Buy and Sell signals on the chart
plotshape(series=buyCondition, title="Buy Signal", color=color.green, style=shape.triangleup, location=location.belowbar)
plotshape(series=sellCondition, title="Sell Signal", color=color.red, style=shape.triangledown, location=location.abovebar)

// Strategy entries
strategy.entry("Buy", strategy.long, when = buyCondition)
strategy.entry("Sell", strategy.short, when = sellCondition)