MyQuant 추세 식별 전략

개요
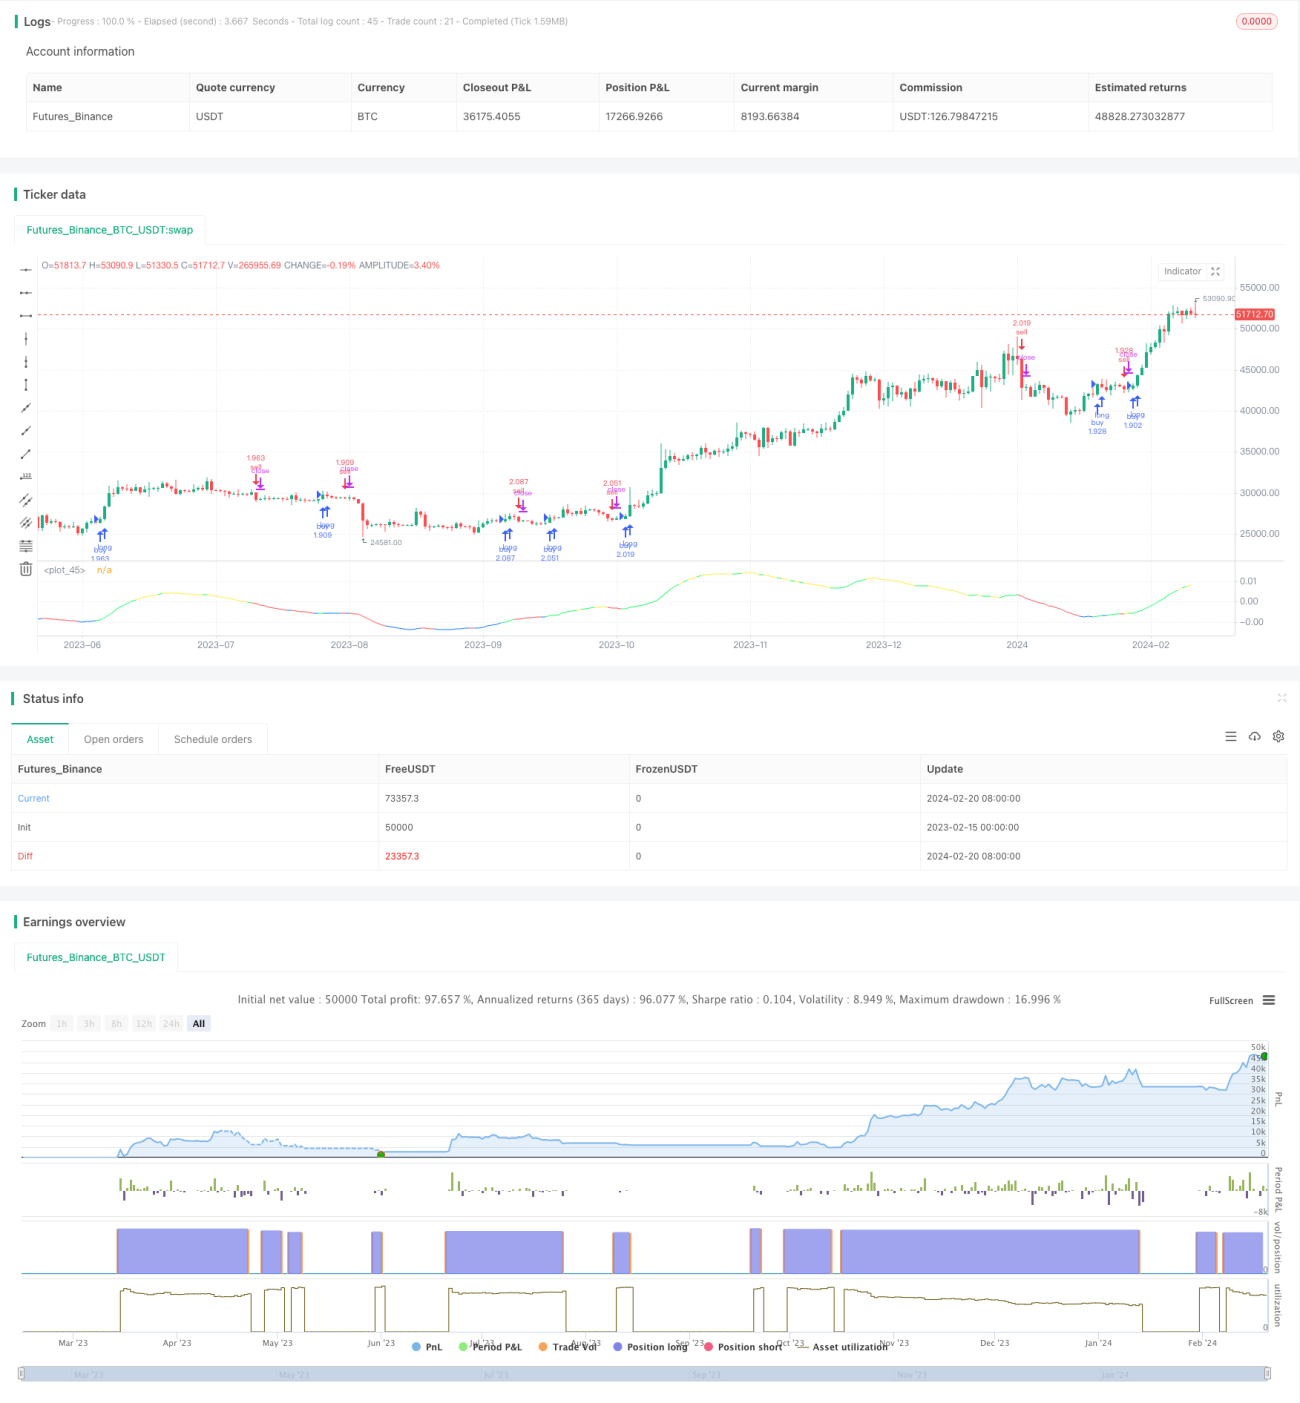
MyQuant 추세 식별 전략은 비트코인 일일 거래를 위한 전략입니다. 이 전략은 가격의 이동 평균선과 그 1차 및 2차 도함수를 계산하여 시장 추세를 식별하고, 이에 따라 매수 및 매도 결정을 내립니다.
전략 원리
이 전략은 먼저 가격의 적응 이동 평균선(ALMA)과 그 1차 도함수 및 2차 도함수를 계산합니다. 1차 도함수는 가격 변화 속도를 반영하고, 2차 도함수는 가격 곡률을 반영합니다. 1차 및 2차 도함수 값을 기반으로 현재 상승 추세, 하강 추세 또는 횡보 기간인지 판단합니다. 그런 다음 주식 지표와 결합하여 매수 또는 매도 조건이 충족되는지 판단합니다.
구체적으로, 전략은 다음 지표를 계산합니다:
- ALMA: 가격의 적응 이동 평균선, 길이 140, 빠른 계수 1.1, 시그마 6
- dema: ALMA의 1차 도함수
- d2ema: dema의 1차 도함수, 가격의 2차 도함수 반영
- index: dema 지표의 진동 지수
- ind: 가격이 이동 평균선에서 벗어난 정도 지수
매수 조건이 충족되면 CAUSED.Accumulation/Distribution Bands 및 Caused Exposure Top and Bottom Finder 신호에 따라 매수 수량을 계산합니다. 매도 조건이 충족되면 모든 포지션을 매도합니다.
전략 장점
이 전략은 추세와 지표 판단을 결합하여 시장 추세 전환점을 효과적으로 식별할 수 있습니다. 가격의 1차 및 2차 도함수를 사용하여 추세를 판단함으로써 가격 변동의 영향을 받지 않아 신호가 더 명확해집니다. 일반적인 이동 평균선 전략에 비해 판단 정확도가 더 높은 장점이 있습니다.
위험 분석
이 전략은 거래 시간대 선택 및 매개변수 조정에 매우 민감합니다. 시간대 선택이 적절하지 않아 중요한 가격 전환점을 포함하지 못하면 전략 효과가 좋지 않습니다. 지표 매개변수 설정이 적절하지 않으면 매수 및 매도 신호가 더 많은 노이즈의 영향을 받아 전략 수익에 영향을 미칩니다. 또한, 전략에 사전 설정된 손절 조건도 최종 수익에 영향을 미칩니다.
최적화 방향
- 시간대 선택 로직을 최적화하여 백테스트 및 실시간 거래 시간대를 더 지능적으로 선택합니다.
- 지표 매개변수를 최적화합니다. 예를 들어 ALMA 및 dema의 길이 등 매개변수를 조정합니다.
- 최대 손실을 제어하기 위해 손절 조건 판단을 추가합니다.
- 다양한 암호화폐의 효과를 평가하여 가장 성과가 좋은 종목을 선별합니다.
요약
MyQuant 추세 식별 전략은 가격의 적응 이동 평균선에 대한 1차 및 2차 도함수 계산을 통해 비트코인의 시장 추세를 효과적으로 식별하고 이에 따라 매수 및 매도 결정을 내립니다. 이 전략은 여러 지표를 결합하여 판단하므로 신호가 과도한 노이즈에 방해받지 않습니다. 추가적인 시간 및 매개변수 최적화를 통해 이 전략의 효과를 더욱 향상시킬 수 있습니다.
- 1