슈퍼 트렌드 볼린저 밴드 더블 지수 이동 평균 거래 전략

개요
이 전략은 여러 가지 기술 지표를 통합합니다. 그 중에는 초 트렌드 지표, 이중 지수 이동 평균 및 브린 밴드 등이 있습니다. 이 전략은 각 지표의 장점을 활용하여 더 정확한 거래 신호를 제공합니다.
전략 원칙
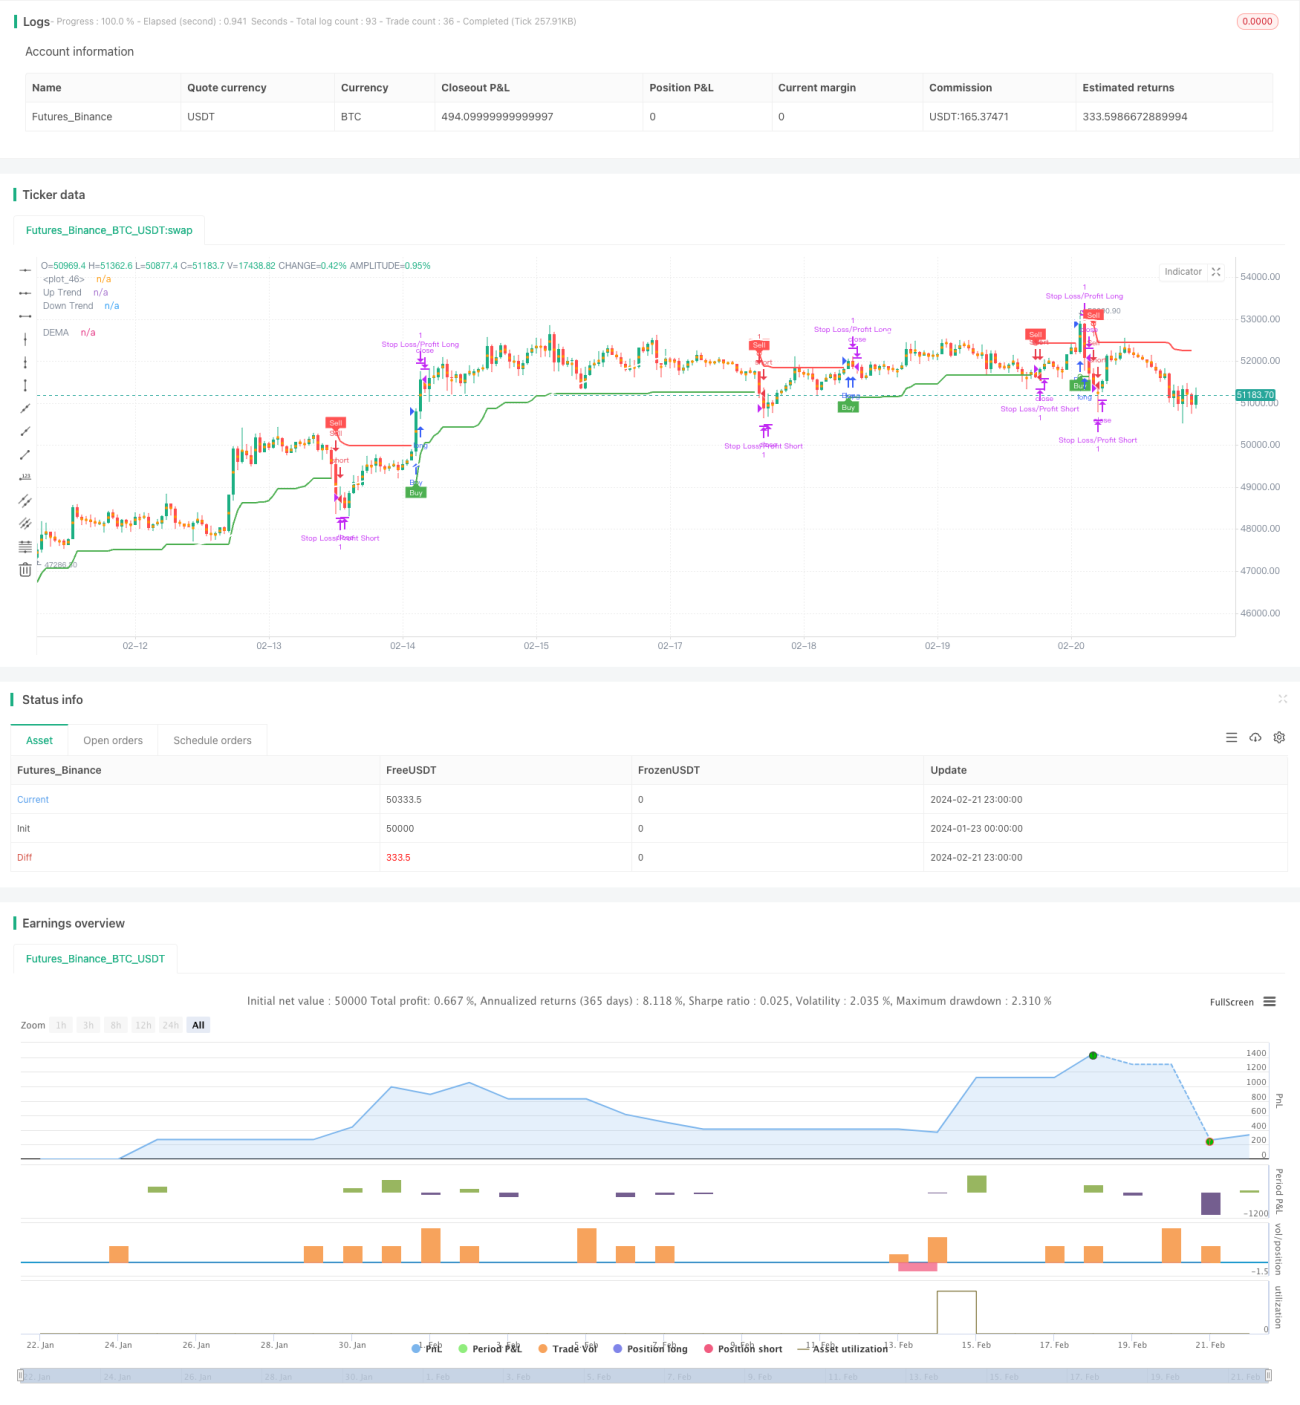
전략은 12주기의 ATR과 가격의 평균값을 계산해 초트렌드의 상도와 하도, 가격의 돌파 상도와 하도에 따라 다단계와 빈도 신호를 판단한다. 동시에, 200주기의 쌍 지수 이동 평균을 사용하여 추세를 판단하는 보조 지표로 한다. 또한, 전략은 브린을 사용하여 시장에 진입하고 손실을 막는 최적의 시간을 결정한다.
가격이 상향 트렌드를 통과할 때 구매 신호를 생성하고, 가격이 하향 트렌드를 통과할 때 판매 신호를 생성한다. 가격이 상향 트렌드를 통과하거나 하향 트렌드를 통과할 때, 해당 궤도에 표시와 글자를 그려서 BUY <unk> 또는 SELL <unk>을 낸다. 동시에 모바일 엔드 신호를 전송한다.
이중 지수 이동 평균은 가격 곡선의 위 또는 아래에 그려져 있으며, 흰색으로 표시된다. 그것은 전반적인 경향의 방향을 판단하는 데 사용됩니다.
브린 띠는 시장에 진입하고 상쇄하는 최적의 시기를 찾기 위해 사용됩니다. 그것의 상하 궤도는 가격 변동 주위를 둘러싸고 통로를 형성하여 가격이 정상적인 범주에서 벗어났을 때, 즉 큰 시간을 넘어서 변동했을 때 확인 할 수 있습니다.
상장 후, 전략은 스톱로스 및 스톱스<unk> 방식을 사용하여 이익을 잠금하거나 손실을 줄인다. 스톱로스 가격과 스톱스<unk> 가격을 설정하여 자동으로 지분을 줄인다.
우위 분석
이 전략은 여러 지표를 통합하여 각 지표의 장점을 최대한 활용하여 더 정확한 거래 신호를 얻을 수 있습니다.
슈퍼 트렌드는 시장 소음을 필터링하여 거래 빈도를 방지하는 능력을 가지고 있습니다. 이중 지수 이동 평균은 대략적인 추세를 판단하여 역전 거래를 피할 수 있습니다. 브린 띠는 시장에 진입하고 손실을 막기위한 최적의 시간을 파악 할 수 있습니다.
모바일 신호를 사용하여 거래 팁을 신속하게 얻을 수 있습니다. 자동 중지 중지 손실은 이익을 잠금하고 손실을 줄일 수 있습니다.
위험 분석
전략이 여러 지표를 통합하기 때문에 전략의 복잡성이 증가하고, 오류의 확률도 증가한다. 지표 설정은 놓친 거래 기회를 초래하거나 잘못된 신호를 발생시킬 수도 있다.
또한, 너무 급진적인 스탠드 설정은 손실을 증폭시킬 수 있다. 모바일 엔드 신호의 안정성 또한 적시에 수익을 얻는 스탠드 손실의 효과에 영향을 준다.
최적화 방향
다양한 매개 변수 설정을 테스트하여 최적의 매개 변수 조합을 찾을 수 있다. 또한 다른 시장에 따라 매개 변수를 조정할 수 있다.
일부 지표만 사용해서 잘못된 신호의 가능성을 줄일 수 있다. 또는 다른 보조 지표를 추가하여 최적화할 수 있다.
정지 및 정지 조건을 조정할 수 있으며, 추적 정지 또는 부분 정지 등의 방법을 설정할 수 있다.
요약하다
이 전략은 여러 가지 기술 지표의 장점을 통합하여 거래 신호 판단을 실현하는 데 있어 강력한 실용성을 가지고 있다. 그러나 또한 일정 수준의 위험에 직면해 있으며, 지속적으로 테스트 및 최적화를 통해 안정적인 수익을 얻을 수 있다.
- 1