개요
슈퍼지원 저항 트렌드 추적 전략은 지지 저항 포인트와 슈퍼 트렌드 두 가지의 인기있는 지표를 결합하고 정확성을 높이기 위해 추가 트렌드 필터를 추가하는 혁신적인 트렌드 추적 전략입니다. 이 전략은 Lonesome TheBlue의 지지 저항 포인트 슈퍼 트렌드 추적 스크립트에 영감을 받아 거래자에게 신뢰할 수있는 트렌드 추적 도구를 제공하면서 가짜 신호를 최소화합니다.
전략 원칙
이 전략은 지지부진점과 슈퍼트렌드 지표의 결합과 강력한 트렌드 필터의 추가에 기반을 두고 있다. 우선, 지정된 기간 동안 지지부진점의 고위점과 낮은 점을 계산한다. 이러한 중요한 기준점은 트렌드 분석에 매우 중요하다.
다음으로, 중선과 사용자 정의 ATR 인자에 따라 상승과 하락이 생성됩니다. 이 파장은 시장의 변동에 따라 스스로 조정되며, 전략에 대한 유연성을 증가시킵니다. 지각 저항점을 지탱하는 슈퍼 트렌드 전략의 핵심은 가격과 슈퍼 트렌드 파장이 상호 작용할 때 지표가 다중 및 공중 신호 사이에 부드럽게 전환하는 지배적 트렌드를 정확하게 식별하는 것입니다.
전략의 추가 트렌드 필터를 도입하여 그 능력을 더욱 강화합니다. 이동 평균을 기반으로 한 필터는 동적으로 트렌드의 강도와 방향을 평가합니다. 전략은 트렌드 필터를 원시의 지지점 저항점 슈퍼 트렌드 신호와 결합하여 더 현명하고 신뢰할 수있는 거래 결정을 내리는 것을 목표로합니다.
우위 분석
정확성 향상: 트렌드 필터를 추가하여 신호를 생성하기 전에 전체적인 트렌드 방향을 확인함으로써 전략의 정확성을 향상시킵니다.
트렌드 연장: 저항점과 슈퍼 트렌드를 뒷받침하고 트렌드 필터를 통합하여 강력한 시장 추세 동안 거래를 연장하여 잠재적으로 수익 기회를 극대화합니다.
가짜 신호를 줄여: 전략의 중도 평균 계산과 함께 트렌드 필터는 가짜 신호를 최소화하고 불확실성이나 시장 조건의 조정을 위해 공기를 떨어뜨리는 것을 줄여줍니다.
지지부진 통찰력: 이 전략은 지지부진 지점에 따라 추가적인 지지부진과 저항 부위를 계속 제공하여 거래자에게 가치있는 컨텍스트 정보를 제공합니다.
위험 분석
매개 변수 의존성: 이 전략은 ATR 주기 및 ATR 배수의 매개 변수에 민감하며, 부적절한 매개 변수 설정은 과도한 거래 또는 놓친 기회를 초래할 수 있다.
트렌드 반전: 트렌드 반전 지점 근처에서, 전략은 잘못된 신호를 생성하여 불필요한 손실을 초래할 수 있습니다.
과도한 최적화: 매개 변수는 최적화하여 최적의 조합을 얻을 수 있지만, 미래지향성이 없다. 매개 변수 선택에 대한 현상과 품종의 차이를 고려해야 한다.
빈 포지션 위험: 가격이 상승과 하락의 궤도를 벗어나면 전략이 빈 포지션 상태로 들어갑니다. 이것은 트렌드가 다시 형성된 후 기회를 놓칠 수 있습니다.
최적화 방향
다른 지표와 결합: 거래량이나 변동률 지표와 같은 전략의 안정성을 높이기 위해 고려할 수 있습니다.
동적 변수: 자동으로 최적화하거나 시장 환경에 따라 변수를 조정하는 방법을 연구하여 전략을 더 적응시킬 수 있습니다.
손해 방지 전략: 전략 논리를 유지하면서, 손해 방지 장치를 설계하고, 단일 손실을 효과적으로 제어하는 방법을 연구한다.
품종 적응성: 평가 전략 Parameter în diferite piețe și instrumente, optimizați parametrii în funcție de specificul fiecăruia.
요약하다
초지원 저항 트렌드 추적 전략은 매우 유망한 양적 전략이다. 그것은 단순성, 트렌드 추적 능력과 같은 여러 차원에서 독특한 이점을 보여준다. 동시에, 전략은 개선 할 수있는 공간이 있으며, 매개 변수, 중지, 품종 적응 등 여러 가지 측면에서 최적화되어 더 보편적이고 신뢰할 수있는 양적 도구가 될 수 있습니다.
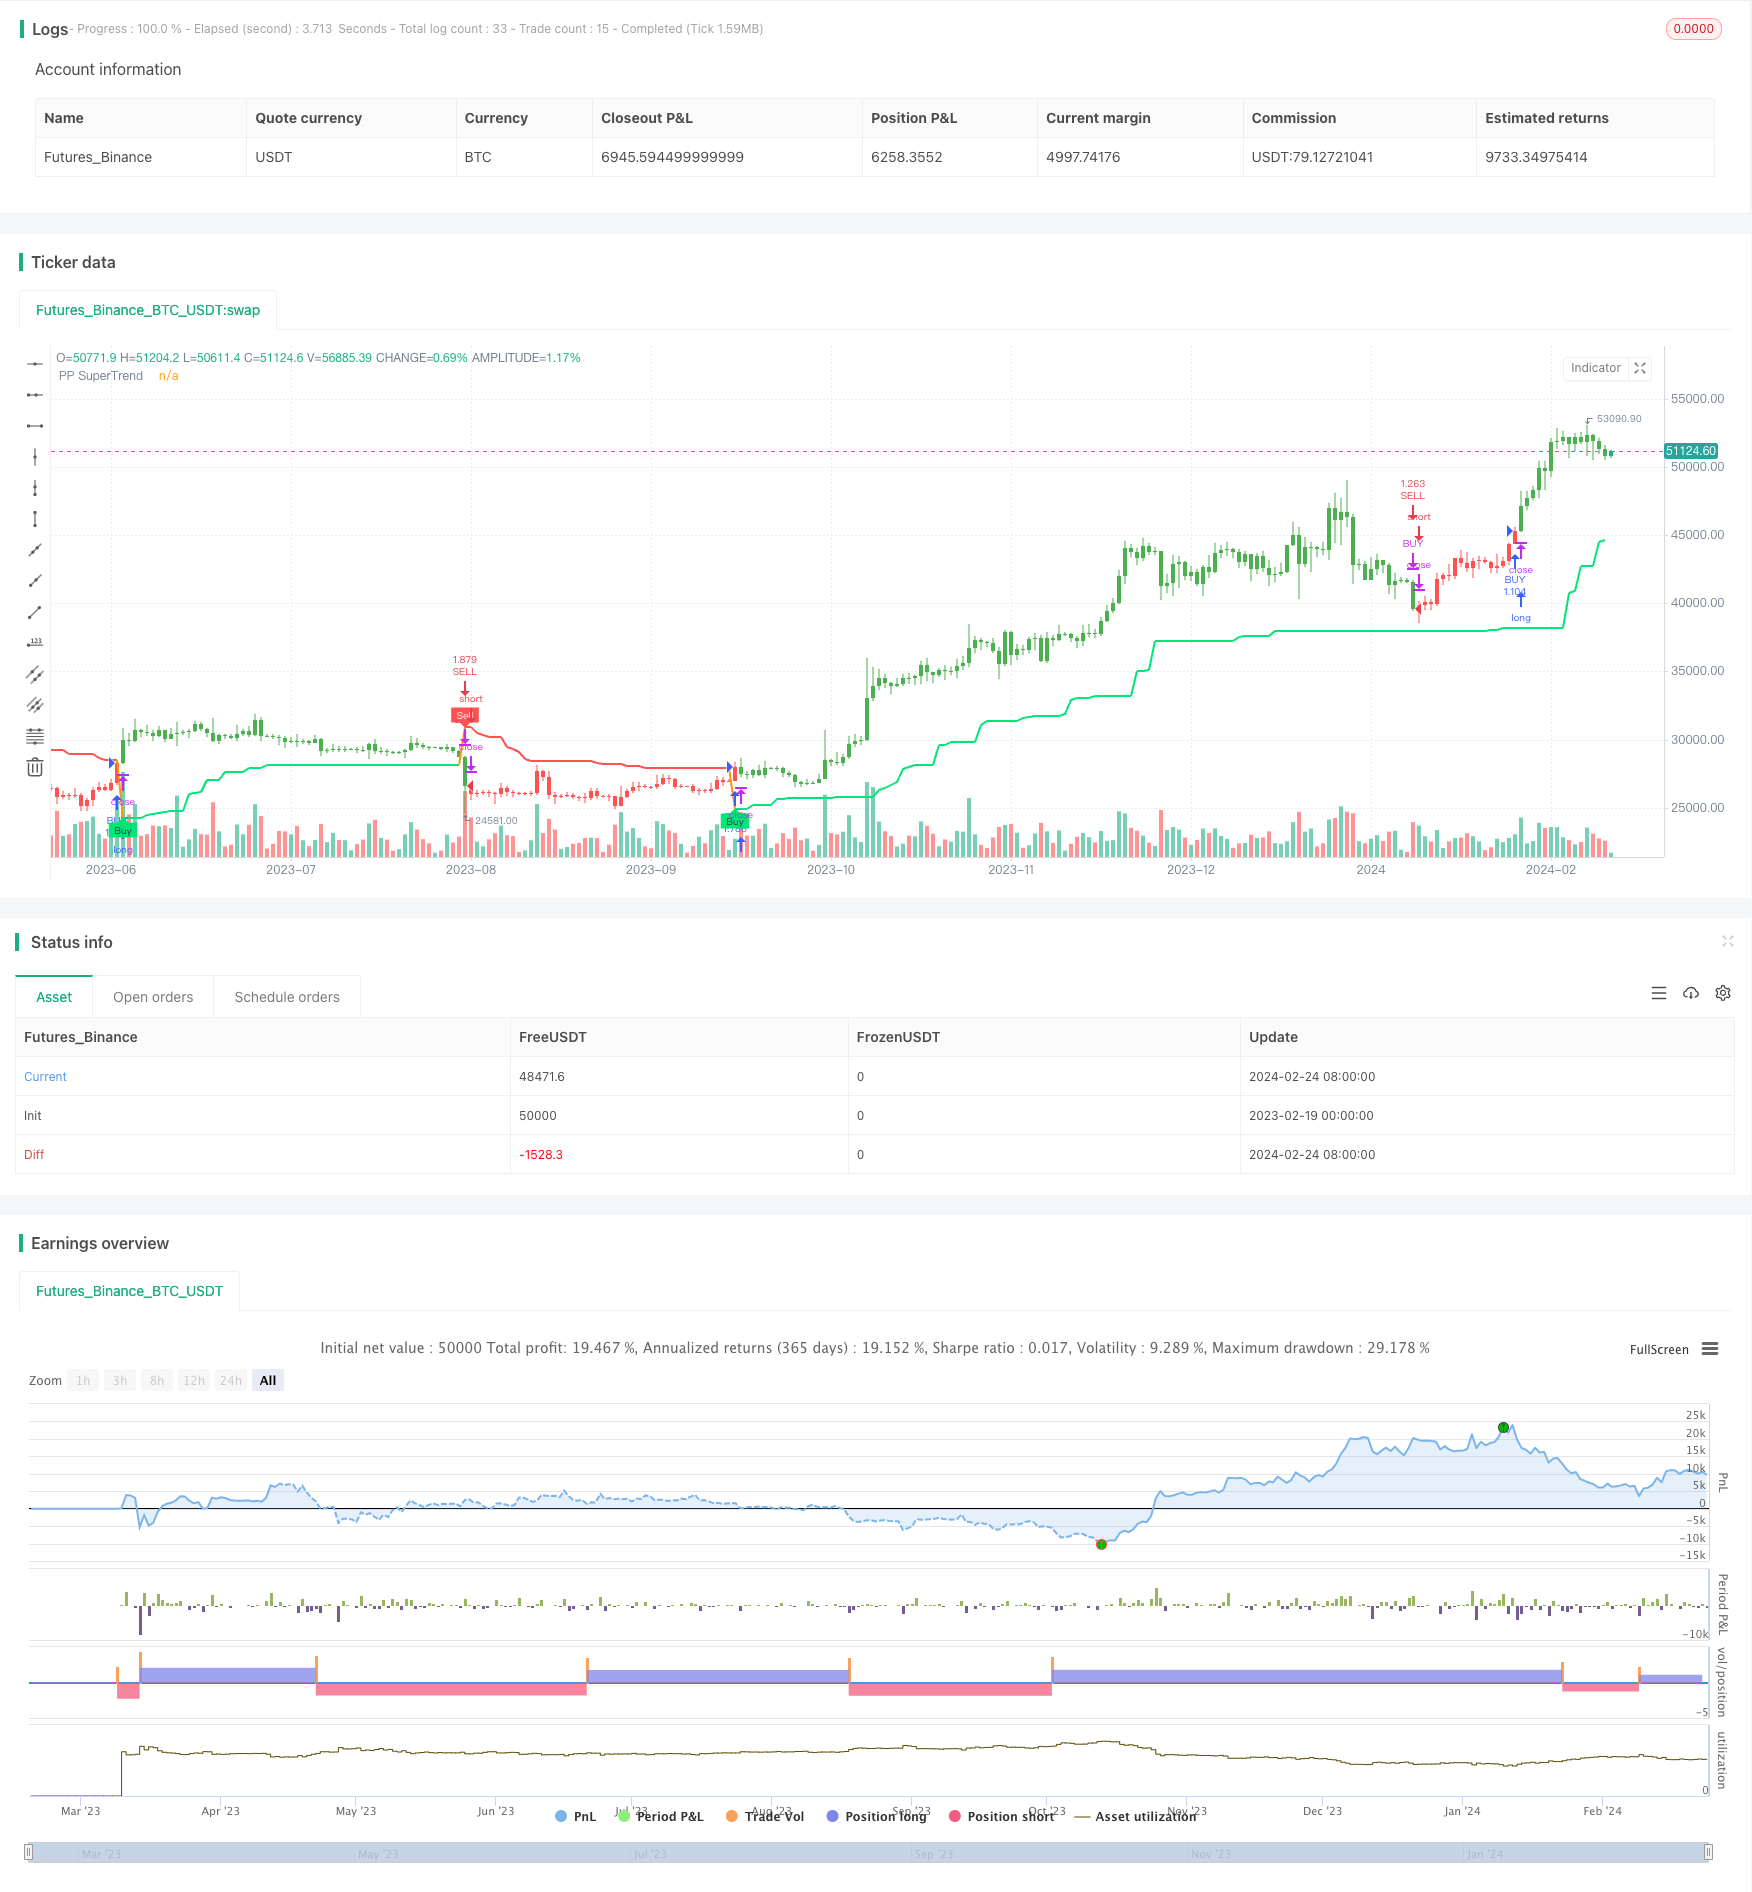
/*backtest
start: 2023-02-19 00:00:00
end: 2024-02-25 00:00:00
period: 1d
basePeriod: 1h
exchanges: [{"eid":"Futures_Binance","currency":"BTC_USDT"}]
*/

// © Julien_Eche
// Strategy based on "Pivot Point Supertrend" Indicator by LonesomeTheBlue

//@version=4

strategy("PPS", overlay=true, initial_capital=500000, currency=currency.USD, default_qty_type=strategy.cash, default_qty_value=50000)

prd = input(defval = 2, title="Pivot Point Period", minval = 1, maxval = 50)
Factor=input(defval = 3, title = "ATR Factor", minval = 1, step = 0.1)
Pd=input(defval = 10, title = "ATR Period", minval=1)
showpivot = input(defval = false, title="Show Pivot Points")
showlabel = input(defval = true, title="Show Buy/Sell Labels")
showcl = input(defval = false, title="Show PP Center Line")
showsr = input(defval = false, title="Show Support/Resistance")

// get Pivot High/Low
float ph = pivothigh(prd, prd)
float pl = pivotlow(prd, prd)

// drawl Pivot Points if "showpivot" is enabled
plotshape(ph and showpivot, text="H",  style=shape.labeldown, color=na, textcolor=color.red, location=location.abovebar, transp=0, offset = -prd)
plotshape(pl and showpivot, text="L",  style=shape.labeldown, color=na, textcolor=color.lime, location=location.belowbar, transp=0, offset = -prd)

// calculate the Center line using pivot points
var float center = na
float lastpp = ph ? ph : pl ? pl : na
if lastpp
    if na(center)
        center := lastpp
    else
        //weighted calculation
        center := (center * 2 + lastpp) / 3

// upper/lower bands calculation
Up = center - (Factor * atr(Pd))
Dn = center + (Factor * atr(Pd))

// get the trend
float TUp = na
float TDown = na
Trend = 0
TUp := close[1] > TUp[1] ? max(Up, TUp[1]) : Up
TDown := close[1] < TDown[1] ? min(Dn, TDown[1]) : Dn
Trend := close > TDown[1] ? 1: close < TUp[1]? -1: nz(Trend[1], 1)
Trailingsl = Trend == 1 ? TUp : TDown

// plot the trend
linecolor = Trend == 1 and nz(Trend[1]) == 1 ? color.lime : Trend == -1 and nz(Trend[1]) == -1 ? color.red : na
plot(Trailingsl, color = linecolor ,  linewidth = 2, title = "PP SuperTrend")

plot(showcl ? center : na, color = showcl ? center < hl2 ? color.blue : color.red : na)

// check and plot the signals
bsignal = Trend == 1 and Trend[1] == -1
ssignal = Trend == -1 and Trend[1] == 1
plotshape(bsignal and showlabel ? Trailingsl : na, title="Buy", text="Buy", location = location.absolute, style = shape.labelup, size = size.tiny, color = color.lime, textcolor = color.black, transp = 0)
plotshape(ssignal and showlabel ? Trailingsl : na, title="Sell", text="Sell", location = location.absolute, style = shape.labeldown, size = size.tiny, color = color.red, textcolor = color.white, transp = 0)

//get S/R levels using Pivot Points
float resistance = na
float support = na
support := pl ? pl : support[1]
resistance := ph ? ph : resistance[1]

// if enabled then show S/R levels
plot(showsr and support ? support : na, color = showsr and support ? color.lime : na, style = plot.style_circles, offset = -prd)
plot(showsr and resistance ? resistance : na, color = showsr and resistance ? color.red : na, style = plot.style_circles, offset = -prd)

// Trend Filter from SuperTrend Long Strategy
Periods = input(title="ATR Period", type=input.integer, defval=10)
src = input(hl2, title="Source")
Multiplier = input(title="ATR Multiplier", type=input.float, step=0.1, defval=3.0)
changeATR = input(title="Change ATR Calculation Method ?", type=input.bool, defval=true)

// Combine the SuperTrend calculations
atr2 = sma(tr, Periods)
atr = changeATR ? atr(Periods) : atr2

up = src - (Multiplier * atr)
up1 = nz(up[1], up)
up := close[1] > up1 ? max(up, up1) : up

dn = src + (Multiplier * atr)
dn1 = nz(dn[1], dn)
dn := close[1] < dn1 ? min(dn, dn1) : dn

trend = 1
trend := nz(trend[1], trend)
trend := trend == -1 and close > dn1 ? 1 : trend == 1 and close < up1 ? -1 : trend

// Moving Average as Trend Filter
periodes_ma = input(title="Moving Average Period", type=input.integer, defval=20)
src_ma = input(title="Moving Average Source", type=input.source, defval=close)
ma = sma(src_ma, periodes_ma)

// Strategy Entry Conditions
FromMonth = input(defval = 9, title = "From Month", minval = 1, maxval = 12)
FromDay   = input(defval = 1, title = "From Day", minval = 1, maxval = 31)
FromYear  = input(defval = 2018, title = "From Year", minval = 999)
ToMonth   = input(defval = 1, title = "To Month", minval = 1, maxval = 12)
ToDay     = input(defval = 1, title = "To Day", minval = 1, maxval = 31)
ToYear    = input(defval = 9999, title = "To Year", minval = 999)

start     = timestamp(FromYear, FromMonth, FromDay, 00, 00)
finish    = timestamp(ToYear, ToMonth, ToDay, 23, 59)

window()  => time >= start and time <= finish ? true : false

// Combined entry conditions
longCondition = (trend == 1 and trend[1] == -1 and close > ma) or (bsignal and window())
shortCondition = (trend == -1 and trend[1] == 1 and close < ma) or (ssignal and window())

if (longCondition)
    strategy.entry("BUY", strategy.long)

if (shortCondition)
    strategy.close("BUY")
    strategy.entry("SELL", strategy.short)

buy1 = barssince((trend == 1 and trend[1] == -1 and close > ma) or (bsignal and window()))
sell1 = barssince((trend == -1 and trend[1] == 1 and close < ma) or (ssignal and window()))
color1 = buy1[1] < sell1[1] ? color.green : buy1[1] > sell1[1] ? color.red : na
barcolor(color1)