동적 적응형 카우프만 이동 평균 추세 추종 전략

개요
이 전략은 카우프만 적응 이동 평균 (KAMA) 에 기반하여 거래 포지션을 동적으로 조정하고 시장 추세를 자동으로 추적할 수 있습니다. 전략의 주요 기능은 다음과 같습니다.
- 동적으로 계산 거래 걸음 길이는 ((점 단위로), 시장의 변동률에 적응
- KAMA 방향에 따라 구매 및 판매 신호를 생성
- 신호가 발생하면, 스톱로스 거리를 설정하고 가격 이동에 따라 조정합니다.
- 선택적으로 K선 닫기 확인 신호를 기다립니다. 가짜 신호를 필터링합니다.
이러한 기능을 통해, 전략은 트렌드의 추가적인 수익을 얻고, 동시에 위험을 통제하려고 한다.
전략 원칙
이 전략은 카우프만 (Kaufman) 의 자율적 이동 평균 지표 작업에 기초한다. KAMA는 가격 운동량과 변동률의 비율을 계산하여 평균의 무게와 부드러움을 동적으로 조정하여 가격 변화에 더 빠르게 반응한다.
KAMA 상의 하향 스톱 라인을 통과하면 트렌드가 반전되어 구매 신호가 발생하고 KAMA 아래의 하향 스톱 라인을 통과하면 트렌드가 반전되어 판매 신호가 발생합니다. 포지션에 진입 한 후, 전략은 ATR에 따라 동적인 스톱 거리를 계산하고 스톱 라인을 설정합니다. KAMA가 유리한 방향으로 이동하면 스톱 라인이 따라 조정되어 더 많은 이익을 잠금하기 위해 스톱 라인을 유리한 위치로 이동합니다.
이렇게하면, 전략은 트렌드를 추적하고, 서서히 스톱 라인을 움직여서 스톱 라인이 트리플되거나 반전 신호가 트리플되어서 평형할 수 있다.
전략적 이점
전통적인 이동 평균 전략에 비해 이 전략은 다음과 같은 장점이 있습니다.
- KAMA 지표는 가격 동향을 더 빨리 파악할 수 있는 매우 민감한 지표입니다.
- 동적으로 정지 거리를 계산하여 추세에 따라 조정하여 더 높은 수익을 얻을 수 있습니다.
- 선택적인 K선 폐쇄 확인으로, 가짜 신호를 필터링하여 불필요한 포지션 개설을 줄일 수 있다.
전체적으로 보면, 전략은 빠르게 반응하고, 통제가능하며, 전형적인 트렌드 추적 전략이다.
전략적 위험
이 전략에는 몇 가지 위험도 있습니다.
- 트렌드 반전 위험. KAMA 지표는 가격 변동에 대해 유연하게 대응하지만, 갑작스러운 트렌드 반전에 대해서는 충분히 제때 대응하지 않을 수 있다.
- 너무 급진적인 스톱로스. 동적 스톱로스 거리가 너무 커 설정되면 너무 급진적이어서 수익이 잠금되지 않을 수 있습니다.
- 가짜 신호 위험. K선 폐쇄 확인을 활성화하면 가짜 신호를 줄일 수 있지만 완전히 제거하지는 않는다.
이러한 위험에 대해, 절감 손실 거리를 최적화, 최대 절감 손실 비율을 설정하는 방법과 같은 방법을 통해 제어 할 수 있습니다. 또한 다른 지표와 결합하여 확인하여 잘못된 거래를 방지 할 수 있습니다.
전략 최적화 방향
이 전략의 최적화 방향은 다음과 같습니다.
- KAMA 파라미터를 최적화: 평균 길이를 조정하고 부드러움을 최적화합니다.
- 동적 손상을 최적화: 다양한 품종의 특성에 따라 최적의 손상을 막는 거리와 걸음걸이를 테스트합니다.
- 필터 지표를 추가: 다른 트렌드 지표와 결합하여 거래 신호를 확인하고 신호의 신뢰성을 향상시킵니다.
예를 들어, KAMA 골드포크와 동시에 MACDif가 긍정적이고 확장되도록 요구되는 보조 확인 지표로 MACD를 추가하는 테스트를 수행 할 수 있습니다. 이것은 몇 가지 가짜 신호를 필터링하여 불필요한 반복적인 포지션을 피 할 수 있습니다.
요약하다
이 전략은 전체적으로 원활하게 작동하며, 동적 스톱로스를 사용하여 트렌드를 추적하고, 트렌드 수익을 최대한 고정합니다. KAMA 지표의 적응성은 전략이 시장의 급격한 변화에 따라 움직일 수 있도록합니다. 약간의 최적화를 통해 전략은 중장선 운영에 적합한 효율적인 트렌드 추적 프로그램이 될 수 있습니다.
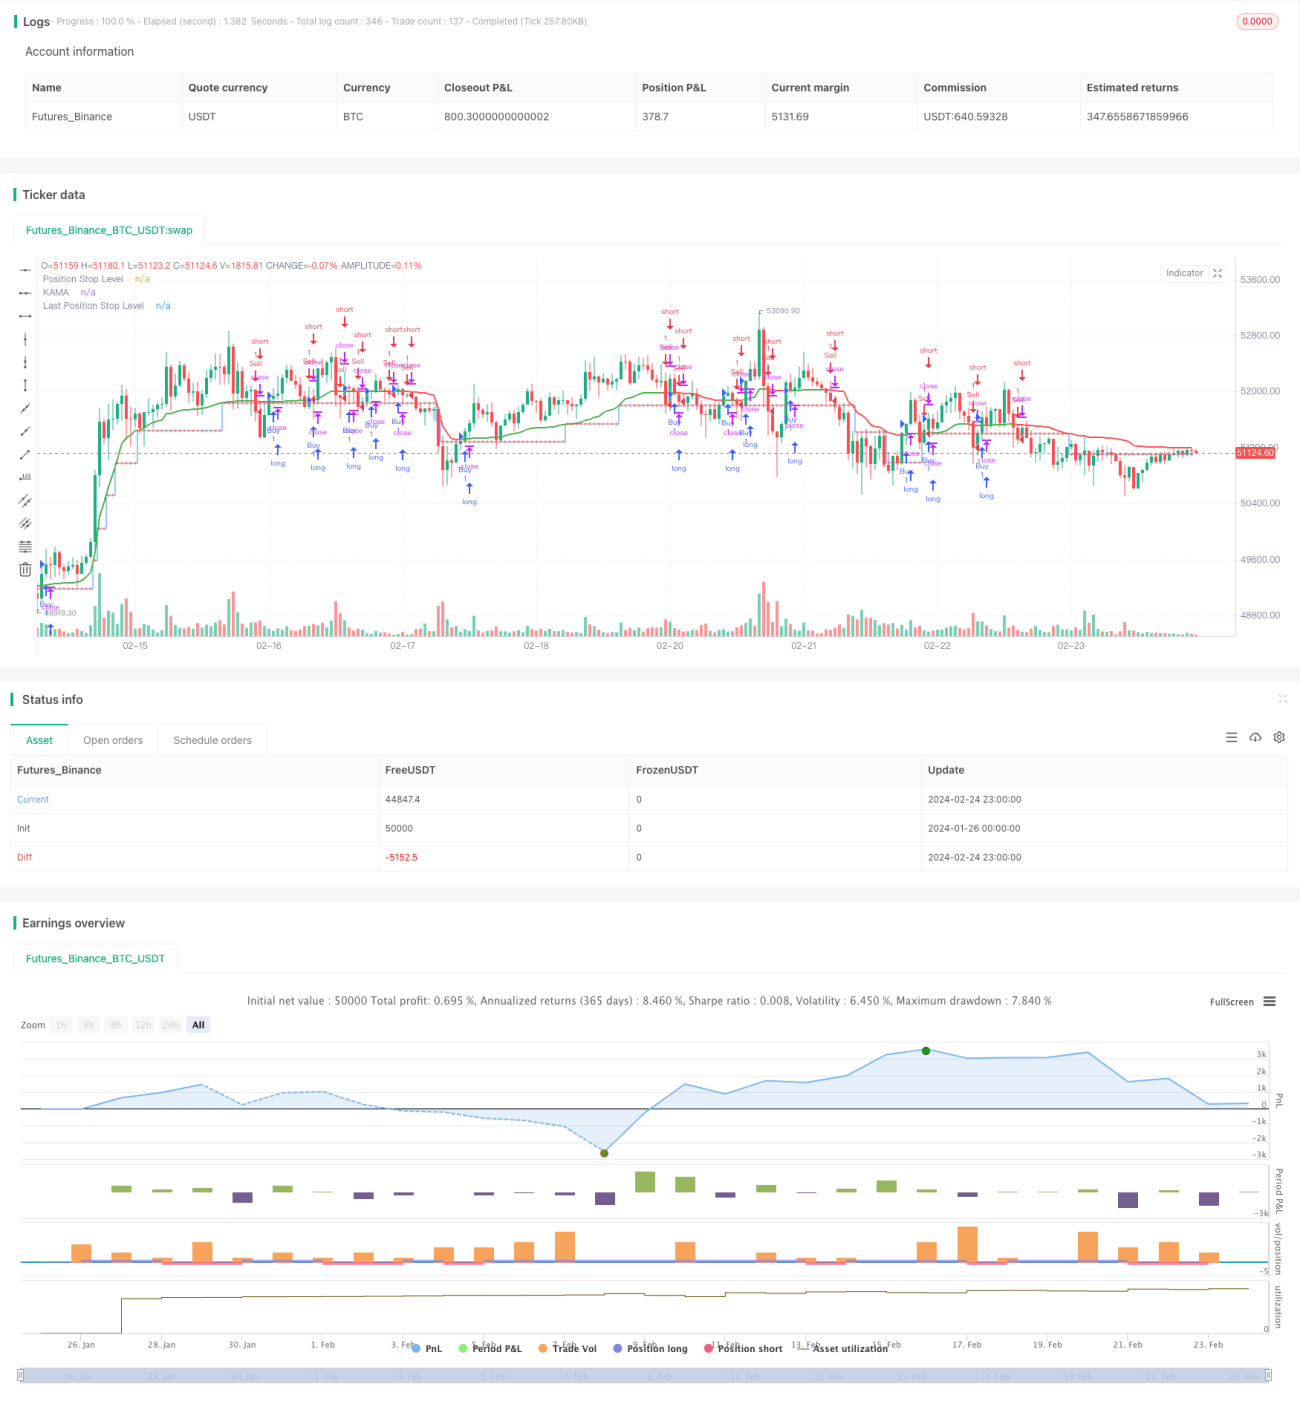
/*backtest
start: 2024-01-26 00:00:00
end: 2024-02-25 00:00:00
period: 1h
basePeriod: 15m
exchanges: [{"eid":"Futures_Binance","currency":"BTC_USDT"}]
*/

//@version=5
strategy("THMA - Bharath Vc Improved", overlay=true, process_orders_on_close=true)

// Function to calculate pips with higher precision- 1