모멘텀 지표를 기반으로 한 단기 거래 전략

개요
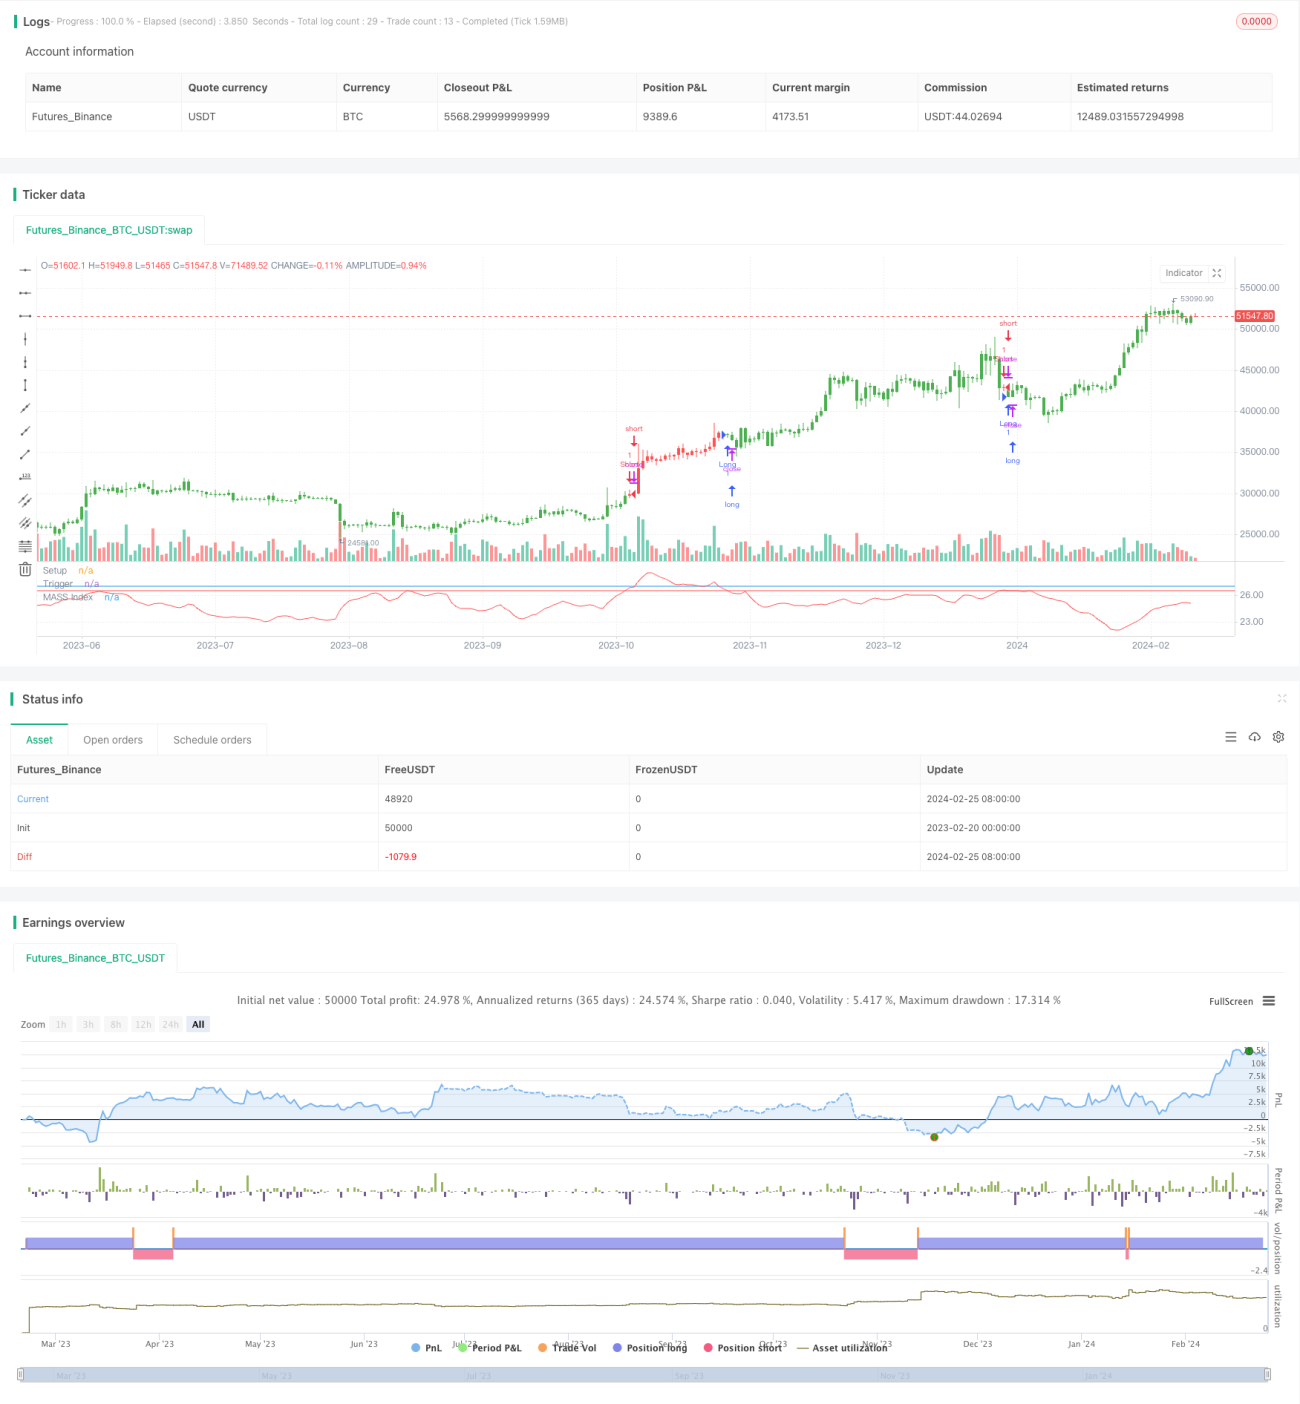
이 전략은 동력 지표에 기반한 단기 거래 전략이라고 불린다. 동력 지표인 매스 인덱스를 사용하여 시장 추세의 전환점을 식별하여 단기 거래 기회를 잡는다.
전략 원칙
이 전략은 두 세트의 다른 변수들의 지수 이동 평균 EMA를 사용하여 가격의 최고 가격과 최저 가격의 차이를 평평하게 하고, Mass Index이라는 지표를 얻는다. Mass Index 위에 어떤 절벽을 통과할 때 공백을 하고, Mass Index 아래에 어떤 절벽을 통과할 때 더 많이 한다.
구체적으로, 먼저 최고 가격과 최저 가격의 차이를 계산한다. xPrice. 그리고 xPrice의 9주기 및 25주기 EMA를 계산한다. 각각 xEMA와 xSmoothXAvg라고 명명한다.
이 전략은 매스 인덱스의 상하위 돌파구를 사용하여 트렌드 전환점을 판단하여 단기 거래를 한다. 시장의 흔들림이 심해지면 매스 인덱스는 상승할 것이며, 시장의 흔들림이 약해지면 매스 인덱스는 하락할 것이다. 특정 수준의 돌파구를 모니터링하면 단기 거래 기회를 효과적으로 잡을 수 있다.
전략적 이점
이 전략은 다음과 같은 장점을 가지고 있습니다.
- 동력 지표인 Mass Index을 사용하여 단기간에 변동과 트렌드 전환을 효과적으로 식별할 수 있습니다.
- 구매와 매매의 시점을 정확하게 파악하고, 상하를 쫓는 것을 피하십시오.
- 거래 전략과 매개 변수는 간단하고 실행하기 쉽습니다.
- 다양한 시장 환경에 적용할 수 있는 유연하게 조정 가능한 매개 변수
전략적 위험과 해결 방법
이 전략에는 몇 가지 위험도 있습니다.
- 허위 돌파구가 발생할 수 있으며, 불필요한 거래가 발생할 수 있습니다. 잘못된 보고율을 줄이기 위해 파라미터를 적절히 조정할 수 있습니다.
- 장기적인 추세 판단을 고려하지 않고, 주요 추세에서 벗어날 수 있다. 추세 지표와 결합하여 역 추세 조작을 피할 수 있다.
- 데이터 곡선 적합의 위험. 샘플 범위를 적절히 확장하여 파라미터의 안정성을 검사할 수 있다.
전략 최적화 방향
이 전략은 다음과 같은 부분에서 최적화될 수 있습니다.
- 주식 기초 분석과 함께 거래의 과도한 변동성을 방지하기 위한 저품질 주식
- 단독 손실을 엄격히 통제하기 위한 손해 방지 제도를 강화
- 변동성 지표와 결합하여 시장의 변동이 심해지면 포지션 규모를 줄이십시오.
- 조건 단기 기능 추가, 출전 타이밍 최적화
요약하다
이 전략은 매스 인덱스 지표에 기반한 비교적 간단한 단기 거래 전략을 설계하여 시장의 전환점을 효과적으로 식별하여 정확하게 더 많은 공백을 할 수 있습니다. 이 전략의 거래 전략과 매개 변수 설정은 간단하고 직관적이며, 실행하기 쉽고, 다양한 시장 환경에 따라 조정 및 최적화 할 수 있으며, 강력한 실용성을 가지고 있습니다. 그러나 데이터 과다 조정 및 지표의 실패의 위험도 주의해야하며, 추세 판단과 손해 방지 조치를 결합하여 시장의 불확실성에 대처해야합니다.
/*backtest
start: 2023-02-20 00:00:00
end: 2024-02-26 00:00:00
period: 1d
basePeriod: 1h
exchanges: [{"eid":"Futures_Binance","currency":"BTC_USDT"}]
*/

//@version=2
////////////////////////////////////////////////////////////
//  Copyright by HPotter v1.0 12/09/2017
// The Mass Index was designed to identify trend reversals by measuring - 1