개요
삼중 확증 트렌드 추적 전략은 평균선, 기억선 및 슈퍼 트렌드 등 세 가지 지표의 신호를 조합하여 트렌드에 대한 높은 확률을 포착합니다. 세 가지 지표가 동시에 구매 또는 판매 신호를 발산하면 전략은 시간에 맞춰 진입하여 트렌드를 추적합니다.
전략 원칙
평균선 판단 주요 추세
전략은 52주기의 평균선을 사용하여 주 트렌드 방향을 판단한다. 가격이 평균선을 넘으면 상승 트렌드로 판단하고, 가격이 평균선을 넘으면 하향 트렌드로 판단한다.
염기서열 인식 하위 역전
전략은 동시에 이모선 (意忘線) 을 사용하여 단기간의 하위 반전을 식별한다. 이모선 (意忘線) 의 계산 방법은 평균선과 비슷하지만, CLOSE 가격은 오픈 가격으로 대체되어 가격 반전의 정보를 더 빠르게 반영한다. 가격이 하락하는 이모선 (意忘線) 을 넘으면, Prices의 짧은 이모선이 안정된 반전의 신호를 예고한다. 가격이 상승하는 이모선 (意忘線) 을 넘으면, 가격의 짧은 이모선이 돌아가는 신호를 예고한다.
슈퍼 트렌드 판별 역전점
전략은 또한 슈퍼 트렌드 지표 판단의 중요한 반전점을 결합한다. 슈퍼 트렌드 지표는 ATR 지표의 창 기간과 가격 데이터를 결합, 동적으로 채널을 조정 하향, 따라서 반전의 시간을 판단한다.
트리플 확인 신호 필터링
평균선, 망각선, 슈퍼트렌드 세 지표가 동시에 구매 신호를 발신할 때만 전략이 더 많이 할 수 있고, 세 지표가 동시에 판매 신호를 발신할 때만 전략이 비어진다. 삼중 지표 확인을 통해 가짜 신호를 효과적으로 필터링하여 진입 확률을 높일 수 있다.
우위 분석
다차원 판단, 높은 확률
전략은 평균선, 망각선, 슈퍼 트렌드 세 가지 지표를 조합하여 다양한 차원에서 추세와 핵심 지점을 판단하여 높은 확률로 진출을 보장합니다.
신속한 대응, 실시간 추적
의도치 않은 선의 도입은 전략이 가격의 짧은 선 반향에 신속하게 반응할 수 있도록 보장합니다. ATR은 채널의 슈퍼 트렌드 지표에 적응하여 가격 변화를 실시간으로 추적 할 수 있습니다.
자동 스톱 손실, 효과적인 위험 제어
전략에 내장된 자동 스톱 스톱 로직으로 ATR 동력에 따라 스톱 스톱 포인트를 조정할 수 있으며, 단일 손실을 효과적으로 제어한다.
위험과 해결책
거래 빈도가 너무 높은 위험
전략 거래 신호가 자주 발생하기 때문에 과도한 거래가 발생할 수 있다. 평균선 주기 변수를 적절히 확대하여 거래 빈도를 줄일 수 있다.
반전 불확실성 위험
의도치 않은 선과 슈퍼 트렌드 지표의 반전점을 판단하는 효과는 확실하지 않으며, 잘못된 판단의 위험이 있을 수 있다. 지표의 매개 변수의 필터링 조건을 증가시켜 더 높은 확률의 반전 신호를 보장할 수 있다.
위기상황의 손실 위험
충격적인 상황에서는, 반복적으로 교차하기 때문에, 전략은 자주 포지션을 열고 상실을 하게 되는데, 이로 인해 손실 위험이 발생한다. 충격적인 상황을 식별할 수 있으며, 이 단계에서 전략 거래는 일시 중단된다.
최적화 방향
변동률 지표와 함께
부린띠와 같은 변동률급 지표와 결합하여 고려할 수 있다. 부린띠에 가까운 가격으로 하향 궤도에 오르면, 새로운 포지션을 개설하는 것을 피하고, 파동 시장의 위험을 효과적으로 회피한다.
입국 필터링 추가
KDJ, MACD 등과 같은 다른 보조 판단 지표들을 추가하여, 그들이 동시에 신호를 내보낼 때만 진입할 수 있다. 이것은 가짜 신호를 더욱 필터링하여 불필요한 거래를 줄일 수 있다.
정지 손실 전략의 최적화
이동식 스톱, 지수 이동식 스톱, 반고지 간격식 스톱 등의 최적화 가능한 스톱 스톱 전략으로 수익을 더 많이 안정화할 수 있다.
요약하다
삼중확인 트렌드 추적 전략은 평균선, 망각선, 슈퍼 트렌드 세 가지 지표의 장점을 최대한 활용하여 트렌드에 대한 높은 확률 판단과 포착을 구현한다. 동시에 자동 스톱 스톱 손실 메커니즘을 설정하여 단독 손실을 효과적으로 제어한다. 추가적으로 최적화 할 가치가있는 것은 다른 보조 지표 필터링과 결합 할 수 있으며, 스톱 스톱 손실 전략을 개선하여 전략을 더 실용화 할 수 있습니다.
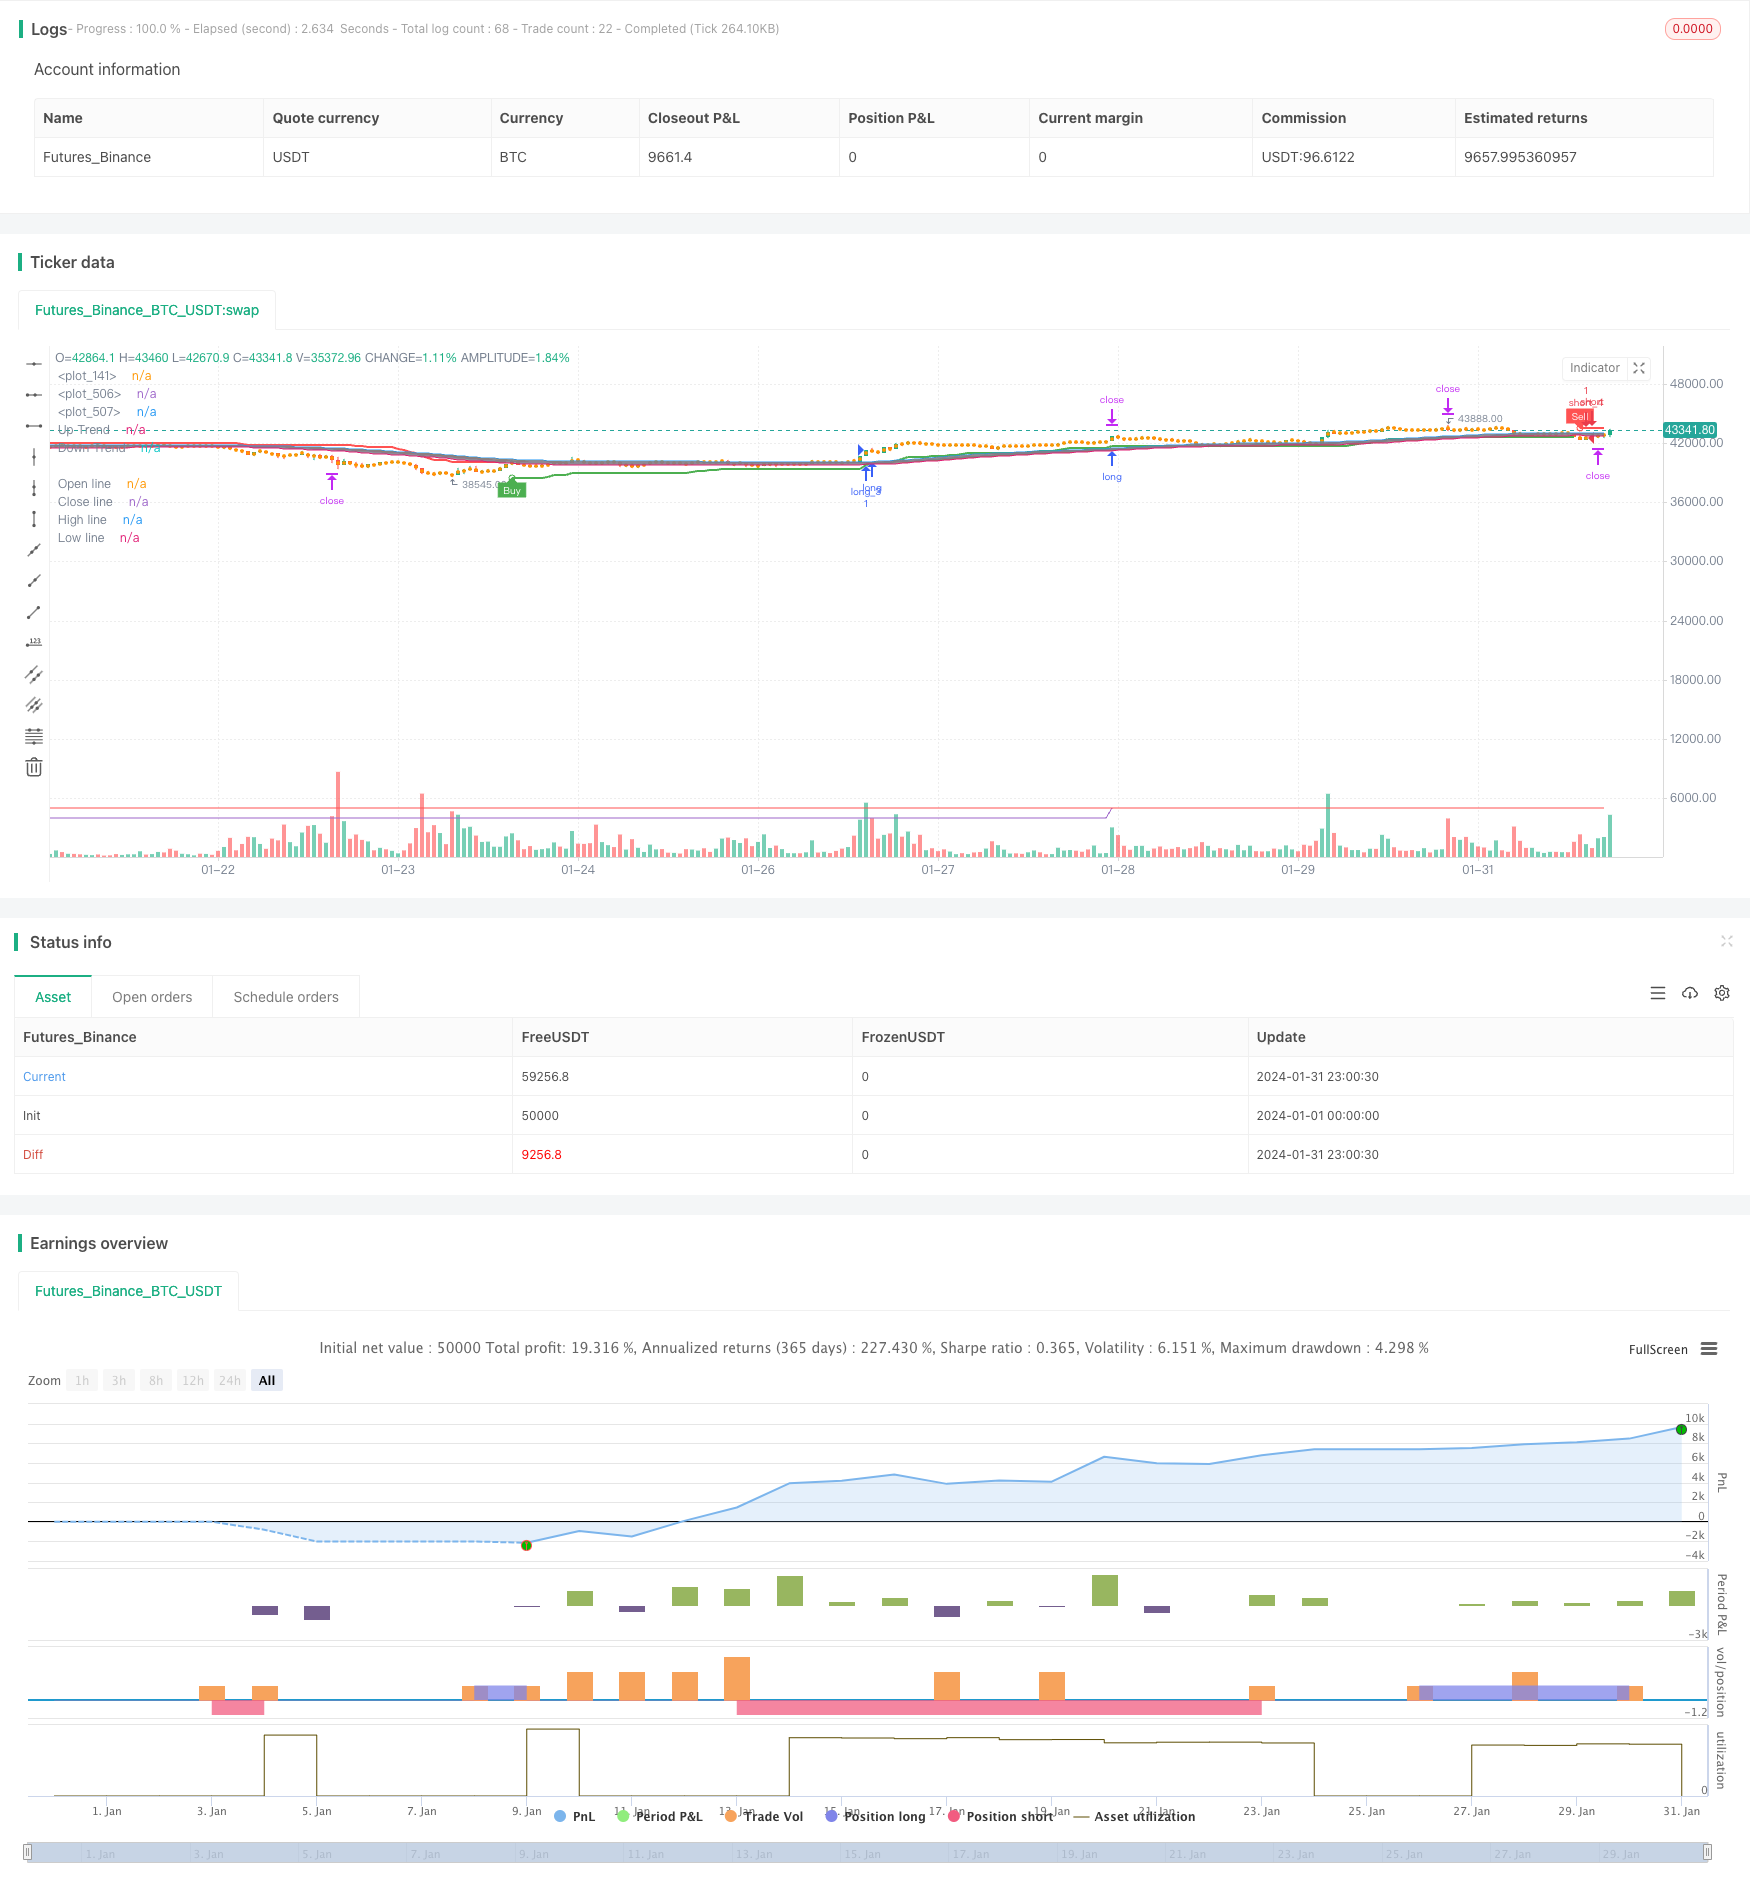
/*backtest
start: 2024-01-01 00:00:00
end: 2024-01-31 23:59:59
period: 1h
basePeriod: 15m
exchanges: [{"eid":"Futures_Binance","currency":"BTC_USDT"}]
*/

//@version=5


//custom variables
hei_col = 0  //1 for green 0 for red
qqe_col = 0  //1 for blue 0 for red
supa_col = 0  //1 for buy 0 for sell
float upratr=0
float lwratr=0
//end


strategy(title='Death_star', overlay=true,calc_on_every_tick = true)

ma_type = input.string(title='MA Type', defval='EMA', options=['EMA', 'SMA', 'SWMA', 'VWMA', 'WMA'])
ma_period = input.int(title='MA Period (Length)', defval=52, minval=1)
ma_period_smoothing = input.int(title='MA Period smoothing (Length)', defval=10, minval=1)

color_positive = input(title='Positive color (Bullish)', defval=color.new(#26A69A, 50))
color_negative = input(title='Negative color (Bearish)', defval=color.new(#EF5350, 50))
color_hl = input(title='High & Low cloud color', defval=color.new(#808080, 80))

show_line = input(title='Show (lines)', defval=false)
show_hl_cloud = input(title='Show (High & Low cloud)', defval=true)
show_oc_cloud = input(title='Show (Open & Close cloud)', defval=true)

//————————————————————————————————————————————————————————————————————————————————
// I.2. Settings, Function definition — — — — — — — — — — — — — — — — — — — — — —
//————————————————————————————————————————————————————————————————————————————————

f_ma_type(input_ma_type, input_source, input_ma_period) =>
    result = float(na)

    if input_ma_type == 'EMA'
        result := ta.ema(input_source, input_ma_period)
        result
    if input_ma_type == 'SMA'
        result := ta.sma(input_source, input_ma_period)
        result
    if input_ma_type == 'SWMA'
        result := ta.swma(input_source)
        result
    if input_ma_type == 'VWMA'
        result := ta.vwma(input_source, input_ma_period)
        result
    if input_ma_type == 'WMA'
        result := ta.wma(input_source, input_ma_period)
        result

    result

//————————————————————————————————————————————————————————————————————————————————
// II.1. Calculations, MA — — — — — — — — — — — — — — — — — — — — — — — — — — — —
//————————————————————————————————————————————————————————————————————————————————

o = f_ma_type(ma_type, open, ma_period)
c = f_ma_type(ma_type, close, ma_period)
h = f_ma_type(ma_type, high, ma_period)
l = f_ma_type(ma_type, low, ma_period)

//————————————————————————————————————————————————————————————————————————————————
// II.2. Calculations, Heikin Ashi — — — — — — — — — — — — — — — — — — — — — — — —
//————————————————————————————————————————————————————————————————————————————————

ha = ticker.heikinashi(syminfo.tickerid)

ha_o = request.security(ha, timeframe.period, o)
ha_c = request.security(ha, timeframe.period, c)
ha_h = request.security(ha, timeframe.period, h)
ha_l = request.security(ha, timeframe.period, l)

//————————————————————————————————————————————————————————————————————————————————
// II.3. Calculations, MA (Smoothing) — — — — — — — — — — — — — — — — — — — — — —
//————————————————————————————————————————————————————————————————————————————————

ha_o_smooth = f_ma_type(ma_type, ha_o, ma_period_smoothing)
ha_c_smooth = f_ma_type(ma_type, ha_c, ma_period_smoothing)
ha_h_smooth = f_ma_type(ma_type, ha_h, ma_period_smoothing)
ha_l_smooth = f_ma_type(ma_type, ha_l, ma_period_smoothing)

//————————————————————————————————————————————————————————————————————————————————
// III.1. Display, Colors — — — — — — — — — — — — — — — — — — — — — — — — — — — —
//————————————————————————————————————————————————————————————————————————————————

tren = ha_c_smooth >= ha_o_smooth

color_trend = tren ? color_positive : color_negative

hei_col := tren ? 1 : 0

color_show_line_positive = show_line ? color_positive : na
color_show_line_negative = show_line ? color_negative : na

color_show_hl_cloud = show_hl_cloud ? color_hl : na
color_show_oc_cloud = show_oc_cloud ? color_trend : na

//————————————————————————————————————————————————————————————————————————————————
// III.2. Display, Plotting & Filling — — — — — — — — — — — — — — — — — — — — — —
//————————————————————————————————————————————————————————————————————————————————

o_line = plot(ha_o_smooth, color=color_show_line_positive, title='Open line')
c_line = plot(ha_c_smooth, color=color_show_line_negative, title='Close line')

h_line = plot(ha_h_smooth, color=color_show_line_positive, title='High line')
l_line = plot(ha_l_smooth, color=color_show_line_negative, title='Low line')

fill(o_line, c_line, color=color_show_oc_cloud, title='Open & Close Trendcloud', transp=90)
fill(h_line, l_line, color=color_show_hl_cloud, title='High & Low Trendcloud', transp=90)

upratr:=(ha_h_smooth)
lwratr:=(ha_l_smooth)
// supa


Periods = input(title='ATR Period', defval=9)
src = input(hl2, title='Source')
Multiplier = input.float(title='ATR Multiplier', step=0.1, defval=3.9)
changeATR = input(title='Change ATR Calculation Method ?', defval=true)
showsignals = input(title='Show Buy/Sell Signals ?', defval=true)
highlighting = input(title='Highlighter On/Off ?', defval=true)
atr2 = ta.sma(ta.tr, Periods)
atr = changeATR ? ta.atr(Periods) : atr2
up = src - Multiplier * atr
up1 = nz(up[1], up)
up := close[1] > up1 ? math.max(up, up1) : up
dn = src + Multiplier * atr
dn1 = nz(dn[1], dn)
dn := close[1] < dn1 ? math.min(dn, dn1) : dn
trend = 1
trend := nz(trend[1], trend)
trend := trend == -1 and close > dn1 ? 1 : trend == 1 and close < up1 ? -1 : trend
upPlot = plot(trend == 1 ? up : na, title='Up Trend', style=plot.style_linebr, linewidth=2, color=color.new(color.green, 0))
buySignal = trend == 1 and trend[1] == -1
plotshape(buySignal ? up : na, title='UpTrend Begins', location=location.absolute, style=shape.circle, size=size.tiny, color=color.new(color.green, 0))
plotshape(buySignal and showsignals ? up : na, title='Buy', text='Buy', location=location.absolute, style=shape.labelup, size=size.tiny, color=color.new(color.green, 0), textcolor=color.new(color.white, 0))
dnPlot = plot(trend == 1 ? na : dn, title='Down Trend', style=plot.style_linebr, linewidth=2, color=color.new(color.red, 0))
sellSignal = trend == -1 and trend[1] == 1
plotshape(sellSignal ? dn : na, title='DownTrend Begins', location=location.absolute, style=shape.circle, size=size.tiny, color=color.new(color.red, 0))
plotshape(sellSignal and showsignals ? dn : na, title='Sell', text='Sell', location=location.absolute, style=shape.labeldown, size=size.tiny, color=color.new(color.red, 0), textcolor=color.new(color.white, 0))
mPlot = plot(ohlc4, title='', style=plot.style_circles, linewidth=0)
longFillColor = highlighting ? trend == 1 ? color.green : color.white : color.white
shortFillColor = highlighting ? trend == -1 ? color.red : color.white : color.white
supa_col := trend == 1 ? 1 : 0
fill(mPlot, upPlot, title='UpTrend Highligter', color=longFillColor, transp=90)
fill(mPlot, dnPlot, title='DownTrend Highligter', color=shortFillColor, transp=90)
alertcondition(buySignal, title='SuperTrend Buy', message='SuperTrend Buy!')
alertcondition(sellSignal, title='SuperTrend Sell', message='SuperTrend Sell!')
changeCond = trend != trend[1]
alertcondition(changeCond, title='SuperTrend Direction Change', message='SuperTrend has changed direction!')

//QQE


//By Glaz, Modified
//study("QQE MOD")
RSI_Period = input(6, title='RSI Length')
SF = input(5, title='RSI Smoothing')
QQE = input(3, title='Fast QQE Factor')
ThreshHold = input(3, title='Thresh-hold')
//

srctt = input(close, title='RSI Source')
//

//
Wilders_Period = RSI_Period * 2 - 1


Rsi = ta.rsi(srctt, RSI_Period)
RsiMa = ta.ema(Rsi, SF)
AtrRsi = math.abs(RsiMa[1] - RsiMa)
MaAtrRsi = ta.ema(AtrRsi, Wilders_Period)
dar = ta.ema(MaAtrRsi, Wilders_Period) * QQE

longband = 0.0
shortband = 0.0
trenda = 0

DeltaFastAtrRsi = dar
RSIndex = RsiMa
newshortband = RSIndex + DeltaFastAtrRsi
newlongband = RSIndex - DeltaFastAtrRsi
longband := RSIndex[1] > longband[1] and RSIndex > longband[1] ? math.max(longband[1], newlongband) : newlongband
shortband := RSIndex[1] < shortband[1] and RSIndex < shortband[1] ? math.min(shortband[1], newshortband) : newshortband
cross_1 = ta.cross(longband[1], RSIndex)
trenda := ta.cross(RSIndex, shortband[1]) ? 1 : cross_1 ? -1 : nz(trenda[1], 1)
FastAtrRsiTL = trenda == 1 ? longband : shortband
////////////////////


length = input.int(50, minval=1, title='Bollinger Length')
mult = input.float(0.35, minval=0.001, maxval=5, step=0.1, title='BB Multiplier')
basis = ta.sma(FastAtrRsiTL - 50, length)
dev = mult * ta.stdev(FastAtrRsiTL - 50, length)
upper = basis + dev
lower = basis - dev
color_bar = RsiMa - 50 > upper ? #00c3ff : RsiMa - 50 < lower ? #ff0062 : color.gray


//
// Zero cross
QQEzlong = 0
QQEzlong := nz(QQEzlong[1])
QQEzshort = 0
QQEzshort := nz(QQEzshort[1])
QQEzlong := RSIndex >= 50 ? QQEzlong + 1 : 0
QQEzshort := RSIndex < 50 ? QQEzshort + 1 : 0
//

//Zero = hline(0, color=color.rgb(116, 26, 26), linestyle=hline.style_dotted, linewidth=1)

////////////////////////////////////////////////////////////////

RSI_Period2 = input(6, title='RSI Length')
SF2 = input(5, title='RSI Smoothing')
QQE2 = input(1.61, title='Fast QQE2 Factor')
ThreshHold2 = input(3, title='Thresh-hold')

src2 = input(close, title='RSI Source')
//

//
Wilders_Period2 = RSI_Period2 * 2 - 1


Rsi2 = ta.rsi(src2, RSI_Period2)
RsiMa2 = ta.ema(Rsi2, SF2)
AtrRsi2 = math.abs(RsiMa2[1] - RsiMa2)
MaAtrRsi2 = ta.ema(AtrRsi2, Wilders_Period2)
dar2 = ta.ema(MaAtrRsi2, Wilders_Period2) * QQE2
longband2 = 0.0
shortband2 = 0.0
trend2 = 0

DeltaFastAtrRsi2 = dar2
RSIndex2 = RsiMa2
newshortband2 = RSIndex2 + DeltaFastAtrRsi2
newlongband2 = RSIndex2 - DeltaFastAtrRsi2
longband2 := RSIndex2[1] > longband2[1] and RSIndex2 > longband2[1] ? math.max(longband2[1], newlongband2) : newlongband2
shortband2 := RSIndex2[1] < shortband2[1] and RSIndex2 < shortband2[1] ? math.min(shortband2[1], newshortband2) : newshortband2
cross_2 = ta.cross(longband2[1], RSIndex2)
trend2 := ta.cross(RSIndex2, shortband2[1]) ? 1 : cross_2 ? -1 : nz(trend2[1], 1)
FastAtrRsi2TL = trend2 == 1 ? longband2 : shortband2


//
// Zero cross
QQE2zlong = 0
QQE2zlong := nz(QQE2zlong[1])
QQE2zshort = 0
QQE2zshort := nz(QQE2zshort[1])
QQE2zlong := RSIndex2 >= 50 ? QQE2zlong + 1 : 0
QQE2zshort := RSIndex2 < 50 ? QQE2zshort + 1 : 0
//

hcolor2 = RsiMa2 - 50 > ThreshHold2 ? color.silver : RsiMa2 - 50 < 0 - ThreshHold2 ? color.silver : na
// plot(FastAtrRsi2TL - 50, title='QQE Line', color=color.new(color.white, 0), linewidth=2)
// plot(RsiMa2 - 50, color=hcolor2, title='Histo2', style=plot.style_columns, transp=50)

Greenbar1 = RsiMa2 - 50 > ThreshHold2
Greenbar2 = RsiMa - 50 > upper

Redbar1 = RsiMa2 - 50 < 0 - ThreshHold2
Redbar2 = RsiMa - 50 < lower
// plot(Greenbar1 and Greenbar2 == 1 ? RsiMa2 - 50 : na, title='QQE Up', style=plot.style_columns, color=color.new(#00c3ff, 0))
// plot(Redbar1 and Redbar2 == 1 ? RsiMa2 - 50 : na, title='QQE Down', style=plot.style_columns, color=color.new(#ff0062, 0))

qqe_col:=Greenbar1 and Greenbar2 == 1 ?1:(Redbar1 and Redbar2 == 1 ?0:-1)


//lab=label.new(bar_index,50,str.tostring(qqe_col))


// ////////////////////////////////////////////////////////////////

// //custom code

// ////////////////////////////////////////////////////////////////


// sma=((lhitt+shitt)/cnt)
// plot(sma*1000)
// plot(250,color=color.red)


//begin


sess=input("0916-1200","time for reversals!!")
v=time(timeframe.period,sess)
rr=input.float(1,"enter the reward..def is 3")
on=na(v)?false:true
bool daybreak=input.bool(false,"daybreak ? true means day end close")
bool apply_on=input.bool(true,"do u want time for reversal?")
apply_on:=not apply_on
test=input.int(2,"train(0) test(1) all(2)?")
// if str.tonumber(timeframe.period)!=5
//     runtime.error("backtests and stocks only valid for 5 min tf!!")
on:=apply_on or on


pts=1/syminfo.mintick
var float sl=0
var float profit=0
// var dud=0
// var counter=0
var con_win=0
var con_lose=0
var tempwin=0
var templose=0
//adding analytics variables
var float[] stararr=array.new_float(10,-1)
var float[] sslarr=array.new_float(10,-1)
var float skipper=-1
var float[] ltararr=array.new_float(10,-1)
var float[] lslarr=array.new_float(10,-1)

var float lhit=0
var float shit=0
var float miss=0
var float cnt=0
var lflag=0
var sflag=0
var i=0
var dud=0
var gap=0
float begin=0
float end=0
// ei_col = 0  //1 for green 0 for red
// qqe_col = 0  //1 for blue 0 for red
// supa_col = 0
//plot(i)
//code begins here
if test==0
    begin:=0
    end:=5500/2
else if test==1
    begin:=5500/2
    end:=bar_index
else if test==2
    begin:=0
    end:=bar_index


if  hei_col==1 and qqe_col==1 and supa_col==1 and lflag==0 and low>upratr and bar_index>=begin and bar_index<=end and on
    lflag:=1
    sflag:=0
    if array.get(lslarr,i)!=-1
        dud:=dud+1
    array.set(lslarr,i,upratr)
    array.set(ltararr,i,(close+rr*(close-upratr)))
    cnt:=cnt+1
    skipper:=i
   // lab=label.new(bar_index,close+100,str.tostring(array.get(lslarr,i)) +"\n"+  str.tostring(array.get(ltararr,i)) +"\n"+str.tostring(i))
    i:=(i+1)%9
    strategy.order("long_"+str.tostring(i-1),strategy.long,1)
    strategy.order("sl_l"+str.tostring(i-1),strategy.short,stop=upratr,oca_name = "exit"+str.tostring(i-1))
    strategy.order("target_l"+str.tostring(i-1),strategy.short,limit=((close+rr*(close-upratr))),oca_name = "exit"+str.tostring(i-1))

if  hei_col==0 and qqe_col==0 and supa_col==0 and sflag==0 and high<lwratr and bar_index>=begin and bar_index<=end and on
    sflag:=1
    lflag:=0
    if array.get(sslarr,i)!=-1
        dud:=dud+1
    array.set(sslarr,i,lwratr)
    array.set(stararr,i,(close-rr*(lwratr-close)))
    skipper:=i
  //  lab=label.new(bar_index,close+100,str.tostring(array.get(sslarr,i)) +"\n"+  str.tostring(array.get(stararr,i)) +"\n"+str.tostring(i))
    i:=(i+1)%9
    cnt:=cnt+1
    strategy.order("short_"+str.tostring(i-1),strategy.short,1)
    strategy.order("sl_s"+str.tostring(i-1),strategy.long,stop=lwratr,oca_name = "exit"+str.tostring(i-1))
    strategy.order("target_s"+str.tostring(i-1),strategy.long,limit=((close-rr*(lwratr-close))),oca_name = "exit"+str.tostring(i-1))


for j=0 to 9
    if array.get(lslarr,j)!=-1 and j!=skipper
        if low < array.get(lslarr,j)  and array.get(lslarr,j)!=-1// and open>array.get(lslarr,j)
            miss:=miss+1
            array.set(ltararr,j,-1)
            array.set(lslarr,j,-1)

        else if high > array.get(ltararr,j)  and array.get(lslarr,j)!=-1 //and open<array.get(ltararr,j)
            lhit:=lhit+1
            array.set(ltararr,j,-1)
            array.set(lslarr,j,-1)

    if array.get(sslarr,j)!=-1 and j!=skipper


        if high > array.get(sslarr,j) and array.get(sslarr,j)!=-1 //and open<array.get(sslarr,j)
            miss:=miss+1
            array.set(stararr,j,-1)
            array.set(sslarr,j,-1)
        else if low < array.get(stararr,j) and array.get(sslarr,j)!=-1 //and open>array.get(stararr,j)
            shit:=shit+1
            array.set(stararr,j,-1)
            array.set(sslarr,j,-1)
skipper:=-1
var day_miss=0
string ender=""
if (timeframe.period)=="1"
    ender:="1528-1529"
else if (timeframe.period)=="5"
    ender:="1520-1525"
else if (timeframe.period)=="15"
    ender:="1500-1515"
else if (timeframe.period)=="60"
    ender:="1330-1430"
else
    //runtime.error("not accounted tf!!")
    daybreak:=false
if time(timeframe.period,ender) and daybreak
    if strategy.position_size!=0
        day_miss+=1
        strategy.cancel_all()
        strategy.close_all("day_end_close")
        for k=0 to (array.size(stararr)==0?na:(array.size(stararr)-1))
            array.set(stararr,k,-1)
            array.set(sslarr,k,-1)

            array.set(ltararr,k,-1)
            array.set(lslarr,k,-1)
    i:=0


if (lhit+shit)>(lhit[1]+shit[1])
    tempwin:=tempwin+1
    templose:=0

else if (miss)>(miss[1])
    templose:=templose+1
    tempwin:=0

if tempwin>con_win
    con_win:=tempwin
if templose>con_lose
    con_lose:=templose


// //*********************adding randomness indicator************

var float nhit=0,var float nphit=0
if cnt%10==0 and cnt>0
    nhit:=(lhit+shit)-nphit
    nphit:=(lhit+shit)

t=table.new(position.top_right,1,6,bgcolor = color.rgb(236, 172, 172))
table.cell(t,0,0,str.tostring(((lhit+shit)/cnt)*100))
table.cell(t,0,1,str.tostring(((lhit+shit)/(lhit+shit+miss))*100))
table.cell(t,0,2,"daymiss "+str.tostring(day_miss))
//table.cell(t,0,1,str.tostring(((lhit)/cnt)*100))
//table.cell(t,0,2,str.tostring(((shit)/cnt)*100))
table.cell(t,0,3,str.tostring(con_win))
// table.cell(t,0,4,str.tostring(gap))
table.cell(t,0,4,str.tostring(con_lose))
table.cell(t,0,5,str.tostring(cnt))
//plot(1000*cnt,color =color.rgb(105, 28, 28))
// // plot(40000+lhit+shit,color=strategy.closedtrades%10==0?color.green:color.white,style=plot.style_circles)
//plot(1000*(lhit+shit),color=color.green)
//plot(1000*miss,color=color.red)

// // hitrate=strategy.wintrades/strategy.closedtrades
// // plot(hitrate*100)
// // plot(strategy.wintrades)
//plot(nhit*10000)
//dud is overwritten trades whereas day_miss are the trades closed at days end

// sma=(lhit+shit)/(lhit+shit+miss)
// plot(sma*100000)
// plot(50000,color=color.red)

// plot(con_win*1000,color=color.green)
// plot(con_lose*1000,color=color.red)


var float[] dat=array.new_float(10,-1)
var dati=0
var float datp=0
if miss>miss[1]
    for cd=0 to ((miss-miss[1])-1)
        array.set(dat,dati,0)
        dati:=(dati+1)%10
if (lhit+shit)>(lhit[1]+shit[1])
    for cd=0 to (  ((lhit+shit)-(lhit[1]+shit[1]))  -1)
        array.set(dat,dati,1)
        dati:=(dati+1)%10

if array.get(dat,9)!=-1
    for cd=0 to 9
        datp:=datp+array.get(dat,cd)

plot((datp/10)*10000)
plot(5000,color = color.red)
datp:=0