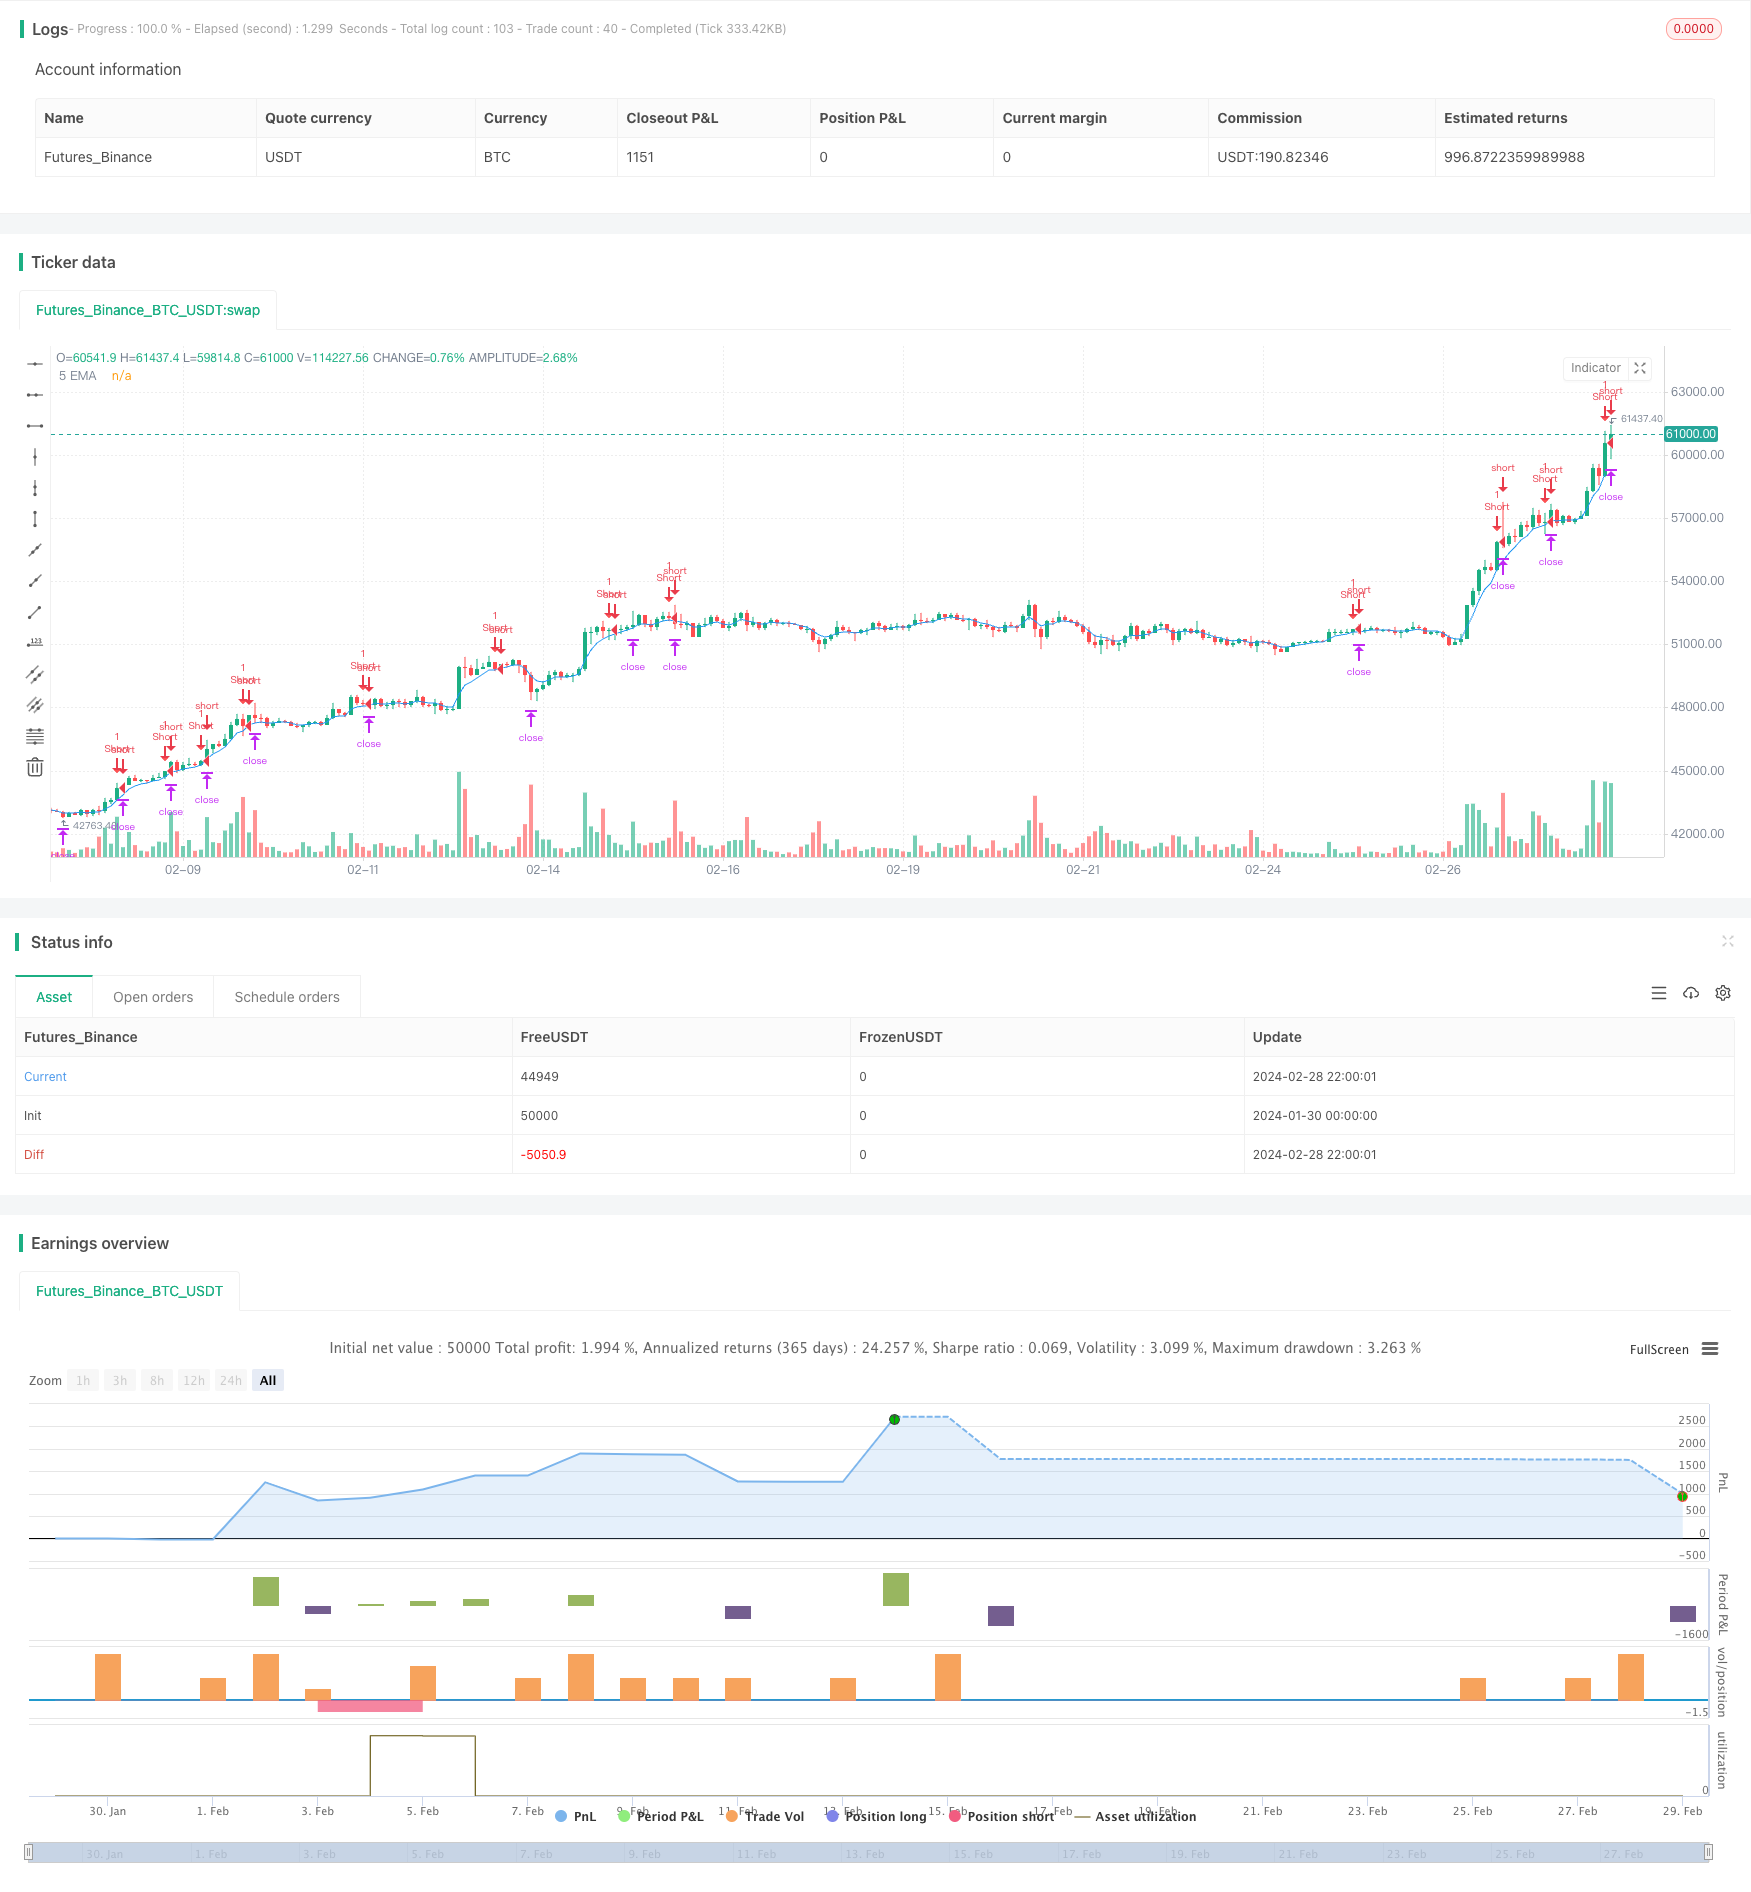
개요
이 전략은 EMA 지표에 기반한 브레이크 트레이딩 전략으로, 가격이 EMA를 뚫을 때 입문 신호로 간주하고, 삼각 스톱 방식을 사용하여 스톱 포스트와 스톱 포스트를 설정하여 높은 수익 가능성을 갖는다.
전략 원칙
이 전략은 5일 EMA를 지표로 계산하고, 상위에서 5일 EMA를 터치할 때, 하락 신호로; 그리고는 입문 가격을 신호 생성 기둥의 높은 지점으로 설정하고, 상쇄 손실을 전 K선에서 가장 높은 지점으로 설정하고, 입문 가격을 3배의 위험값으로 하락시키는 것을 중지합니다. (예컨대, 상쇄 손실 비율은 2: 1) 이므로 가격이 하향 EMA를 돌파하면, 우리는 하락합니다.
우위 분석
이것은 EMA를 뚫기 위한 간단한 전략으로 다음과 같은 장점이 있습니다:
- 규칙은 간단하고 명확하며 실행하기 쉽습니다.
- EMA는 가격 동향을 잘 파악하고, 돌파 신호를 활용하여 수익을 창출할 수 있습니다.
- 삼각 스톱 스톱 손실을 사용하면 더 높은 수익률을 얻을 수 있습니다.
- 가시적인 손해정지 지점은 위험관리에 도움이 됩니다.
위험 분석
이 전략에는 몇 가지 위험도 있습니다.
- 시장의 급격한 변화로 인해, 제약이 작동하지 않을 수 있습니다.
- EMA 지표가 뒤쳐져 있고, 가장 좋은 시점을 놓칠 수도 있습니다.
- 삼각형의 집합은 감금될 수 있고, 손상될 수 없다.
위험을 제어하기 위해, 다른 지표와 결합하여 큰 추세를 판단하여 역전 거래를 피할 수 있습니다. 또한 시장의 변동 정도에 따라 중지 손실을 조정할 수 있습니다.
최적화 방향
이 전략은 간단하지만, 다음의 몇 가지 측면에서 최적화될 수 있습니다.
- EMA 사이클 파라미터를 최적화하여 다른 사이클에 적응합니다.
- 다른 지표들을 추가하여 전략적 안정성을 높여주기 위해서입니다.
- 동적 스톱 방식을 사용하여 시장의 변동에 따라 스톱 크기를 조정합니다.
- 거래량과 같은 지표와 결합하여 가짜 돌파구를 피하십시오.
요약하다
이 전략은 전체적으로 간단하고 실용적인 단기 돌파 EMA 전략이다. 규칙이 명확하고, 구현하기 쉽고, 스톱 스톱 손실이 완료되는 등의 장점이 있으며, 더 나은 리스크 수익률을 얻을 수 있다. 하지만, 수축 리스크 등의 문제가 있다. 이후 파라미터를 조정하고, 지표를 추가하고, 동적 스톱 손실 등을 통해 최적화할 수 있어 전략이 더 안정적이고 신뢰할 수 있다.
전략 소스 코드
/*backtest
start: 2024-01-30 00:00:00
end: 2024-02-29 00:00:00
period: 2h
basePeriod: 15m
exchanges: [{"eid":"Futures_Binance","currency":"BTC_USDT"}]
*/

//@version=5
strategy("Short Entry EMA Strategy with Visual SL and TP", shorttitle="SE-EMA-SL-TP-Viz", overlay=true)

// Customization Inputs
emaPeriod = input.int(5, title="EMA Period", minval=1)

// EMA Calculation
emaValue = ta.ema(close, emaPeriod)
plot(emaValue, title="5 EMA", color=color.blue)

// Detecting Short Entry Conditions
shortEntryCondition = close > emaValue and low <= emaValue and low[1] > emaValue[1] and close[1] > emaValue[1]

// Entry, SL, and TP Logic
if (shortEntryCondition)
    entryPrice = open[1]
    slLevel = high[1]
    risk = slLevel - entryPrice
    tpLevel = entryPrice - risk * 3  // Assuming a 2:1 risk-reward ratio for TP calculation

    // Execute short trade
    strategy.entry("Short", strategy.short)
    strategy.exit("Exit", "Short", stop=slLevel, limit=tpLevel)

    // Visualizing SL and TP levels
    // line.new(bar_index, slLevel, bar_index + 20, slLevel, color=color.red, width=2)
    // line.new(bar_index, tpLevel, bar_index + 20, tpLevel, color=color.green, width=2)

// Plotting Short Entry Signal
plotshape(series=shortEntryCondition, style=shape.triangledown, location=location.abovebar, color=color.red, title="Short Signal")