
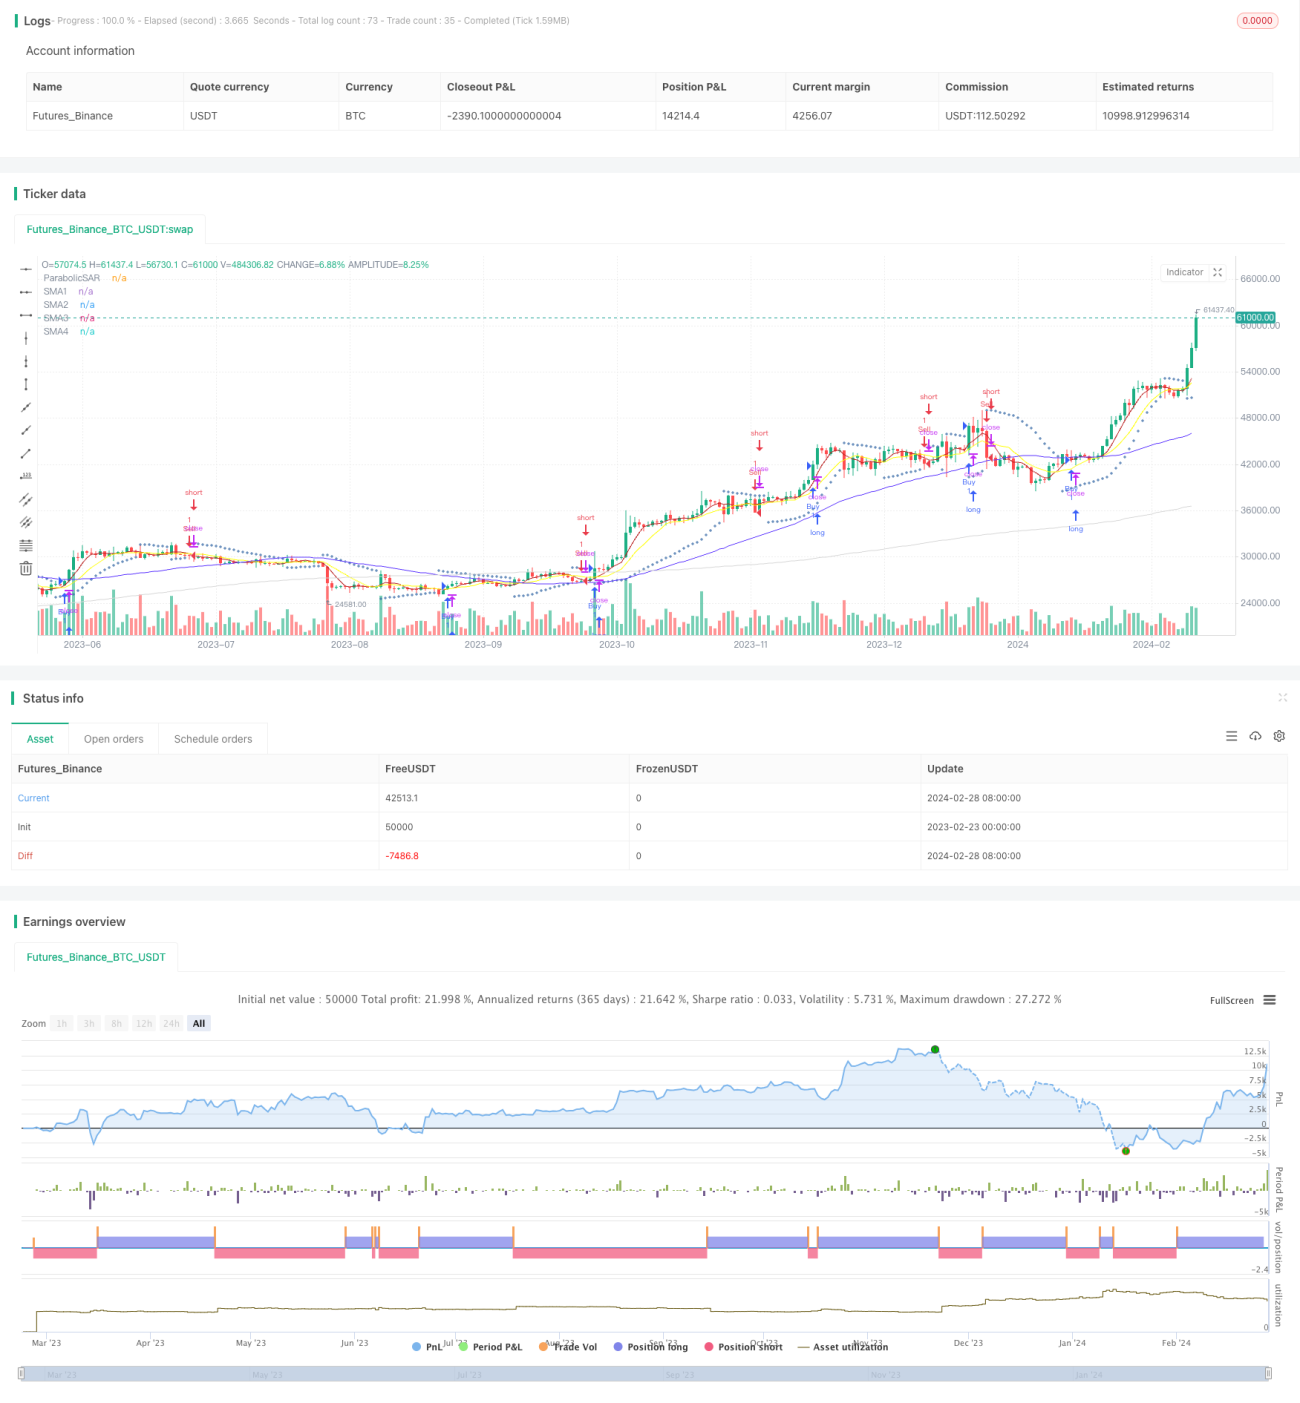
이 전략은 이동 평균 (SMA), 평균 실제 범위 지표 (ATR), 시세 지표 (CCI) 및 브린 대역을 결합하여 단기 및 중기 가격 동향을 발견하여 거래 결정을 지원합니다.
이 전략은 4개의 다른 주기적인 SMA 곡선을 사용하여 가격 트렌드 방향을 식별합니다. 5일, 10일, 50일, 200일 라인을 포함합니다. ATR은 시장의 변동성을 측정하고 중지 지점을 설정합니다. CCI는 과매도 과매도 상황을 식별합니다.
단기 SMA ((5일과 10일 라인) 에서 장기 SMA ((50일과 200일 라인) 를 입었을 때 더 많이 한다. 단기 SMA 아래에서 장기 SMA를 입었을 때 더 많이 한다. CCI가 100이면 팔고, 100이면 살다.
이 전략은 이동 평균의 트렌드 판단과 CCI의 과매매 판단을 결합하여 시장 기회를 효과적으로 포착할 수 있다. 특히 중장기 거래 효과는 더 좋다. 또한, 위험 통제는 과학적으로 비교하여 손실을 최대한 피할 수 있다.
이 전략은 보수적이기 때문에 놓친 신호가 발생할 수 있다. 시장의 흔들림이나 트렌드 반전이 있을 때, 정지기는 더 일찍 촉발될 수 있다. 또한, 매개 변수 설정이 잘못되면 효과에 영향을 줄 수 있다.
SMA의 변수를 최적화하여 현재 시장 상태에 더 가깝게 만들 수 있습니다. 또한 부린 밴드의 표준 차이를 조정하여 지원 저항 수준에 더 적합하게 만들 수 있습니다. 또한 KDJ, MACD 등과 같은 다른 지표 보조 판단을 추가하는 것을 고려할 수 있습니다. 이것은 전략의 승률을 높일 수 있습니다.
이 전략은 여러 가지 분석 도구를 통합하여 시장을 판단하고, 적절한 매개 변수를 설정하면 좋은 투자 수익을 얻을 수 있습니다. 그것의 손해 중지 규칙은 또한 위험을 제어 할 수 있습니다. 실제 검증 및 최적화를 할 가치가 있습니다.
/*backtest
start: 2023-02-23 00:00:00
end: 2024-02-29 00:00:00
period: 1d
basePeriod: 1h
exchanges: [{"eid":"Futures_Binance","currency":"BTC_USDT"}]
*/
// This source code is subject to the terms of the Mozilla Public License 2.0 at https://mozilla.org/MPL/2.0/
// © maizirul959
//@version=4
strategy("MACD,RSI & EMA strategy with MA+PSAR by MAM", overlay=true)
//Input Data
_ema_len1 = input(5, title="EMA1 length")
_ema_len2 = input(20, title="EMA2 length")
_macd_fast = input(12, title="MACD Fast")
_macd_slow = input(26, title="MACD Slow")
_macd_signal_len = input(20, title="MACD Signal length")
//MAM add SMA
_sma_len1 = input(5, title="SMA1 Length")
_sma_len2 = input(10, title="SMA2 Length")
_sma_len3 = input(50, title="SMA3 Length")
_sma_len4 = input(200, title="SMA4 Length")
lineWidth = input(1, minval=1, title="Line width")
src = input(close, title="Source")
SMA1 = if _sma_len1 != 0
sma(src, _sma_len1)
SMA2 = if _sma_len2 != 0
sma(src, _sma_len2)
SMA3 = if _sma_len3 != 0
sma(src, _sma_len3)
SMA4 = if _sma_len4 != 0
sma(src, _sma_len4)
//__________________________________________________________________________
_rsi_len = input(14, title="RSI length")
_rsi_signal_len = input(20, title="RSI signal length")
//_________________________________________________________________________
//MAM Add PSAR
PSAR_start = input(0.02)
PSAR_increment = input(0.02)
PSAR_maximum = input(0.2)
psar = sar(PSAR_start, PSAR_increment, PSAR_maximum)
//_________________________________________________________________________
_ema1 = ema(close, _ema_len1)
_ema2 = ema(close, _ema_len2)
//_________________________________________________________________________
//MAM add SMA
//_sma1 = ema(close, _sma_len1)
//_sma2 = ema(close, _sma_len2)
//_________________________________________________________________________
_macd = ema(close, _macd_fast) - ema(close, _macd_slow)
_macd_signal = ema(_macd, _macd_signal_len)
_rsi = rsi(close, _rsi_len)
_rsi_signal = ema(_rsi, _rsi_signal_len)
//PLOT SMA
plot(SMA1, color=#B71C1C, title="SMA1", linewidth=lineWidth)
plot(SMA2, color=#FFFF00, title="SMA2", linewidth=lineWidth)
plot(SMA3, color=#5b34ff, title="SMA3", linewidth=lineWidth)
plot(SMA4, color=#d7d7d7, title="SMA4", linewidth=lineWidth)
//PLOT PSAR
plot(psar, "ParabolicSAR", style=plot.style_cross, color=#3A6CA8)
//plot(_rsi, color=color.yellow)
//plot(_rsi_signal, color=color.green)
//plot(_macd, color=color.blue)
//plot(_macd_signal, color=color.red)
longCondition = close > _ema1 and close > _ema2 and _macd > _macd_signal and _rsi > _rsi_signal
if (longCondition)
strategy.entry("Buy",strategy.long)
shortCondition = close < _ema1 and close <_ema2 and _macd < _macd_signal and _rsi < _rsi_signal
if (shortCondition)
strategy.entry("Sell",strategy.short)