개요
이 전략은 부린띠 지표에 기초하여 거래 신호 판단과 스톱스트로스 설정을 한다. 가격이 부린띠 중간 궤도에 닿을 때 포지션을 열고 더 많은 공백을 하고, 0.5%의 스톱스트로스와 3%의 스톱스트로스를 설정하는 것은 단선 거래 전략이다.
전략 원칙
브린 벨트 중간 궤도는 종결 가격의 N일 간편 이동 평균이다. 상단 궤도는 중간 궤도 + K배의 N일 종결 가격 표준 차, 하단 궤도 중간 궤도-K배의 N일 종결 가격 표준 차이다. 가격이 아래에서 위쪽으로 중간 궤도를 통과할 때 더하고, 가격이 위로부터 아래로 중간 궤도를 통과할 때 공백한다. 매 거래마다 고정된 수를 입점으로 삼고, 0.5%의 스톱과 3%의 스톱 손실을 설정한다.
우위 분석
- 브린 띠 지표를 사용하여 거래 신호를 판단하여 가격의 돌파구를 효과적으로 잡을 수 있습니다.
- 단선거래 방식은 각 거래주기가 짧아서 다공지방으로 빠르게 전환할 수 있다.
- 고정된 수량으로 포지션을 개설하고, 스톱로스를 설정하면 단일 거래의 위험을 잘 제어할 수 있다.
위험 분석
- 브린띠 지표는 시장의 변동성에 민감하며, 파라미터를 잘못 설정하면 거래 신호가 증가하지만 승률은 높지 않다.
- 단선거래는 자주 발생하며, 높은 수수료가 있으면 수익을 크게 줄일 수 있다.
- 스톱패스의 스톱패스폭이 잘못 설정되어 있기 때문에 너무 일찍 스톱패스를 하거나 더 많은 을 놓칠 수 있다.
위험 해결 방법:
- 브린 대역 변수를 최적화하여 최적의 변수 조합을 찾습니다.
- 낮은 수수료가 있는 증권 품종을 선택하여 거래하십시오.
- 역측량으로 정지 손실을 최적화하는 파라미터 설정을 한다.
최적화 방향
- 다른 지표 필터 신호와 결합하여 거래 승률을 높인다. K선 형태, MACD 등등.
- 스톱 모드를 추가하고, 이동 스톱 또는 분할 스톱을 설정하여 거래당 수익 공간을 확장하십시오.
- 브린 대역변수와 정지정지 손실을 최적화하여 최적의 변수 조합을 찾습니다.
요약하다
이 전략은 전체적인 아이디어가 명확하고, 브린 띠를 사용하여 거래 신호 효과를 판단하는 것이 좋습니다. 그러나 거래가 빈번하고 수익 공간이 제한되어 있으며, 트렌드를 판단하는 지표 필터 신호와 결합하여 전략 효과를 향상시키기 위해 최적화 매개 변수를 사용하는 것이 좋습니다.
전략 소스 코드
/*backtest
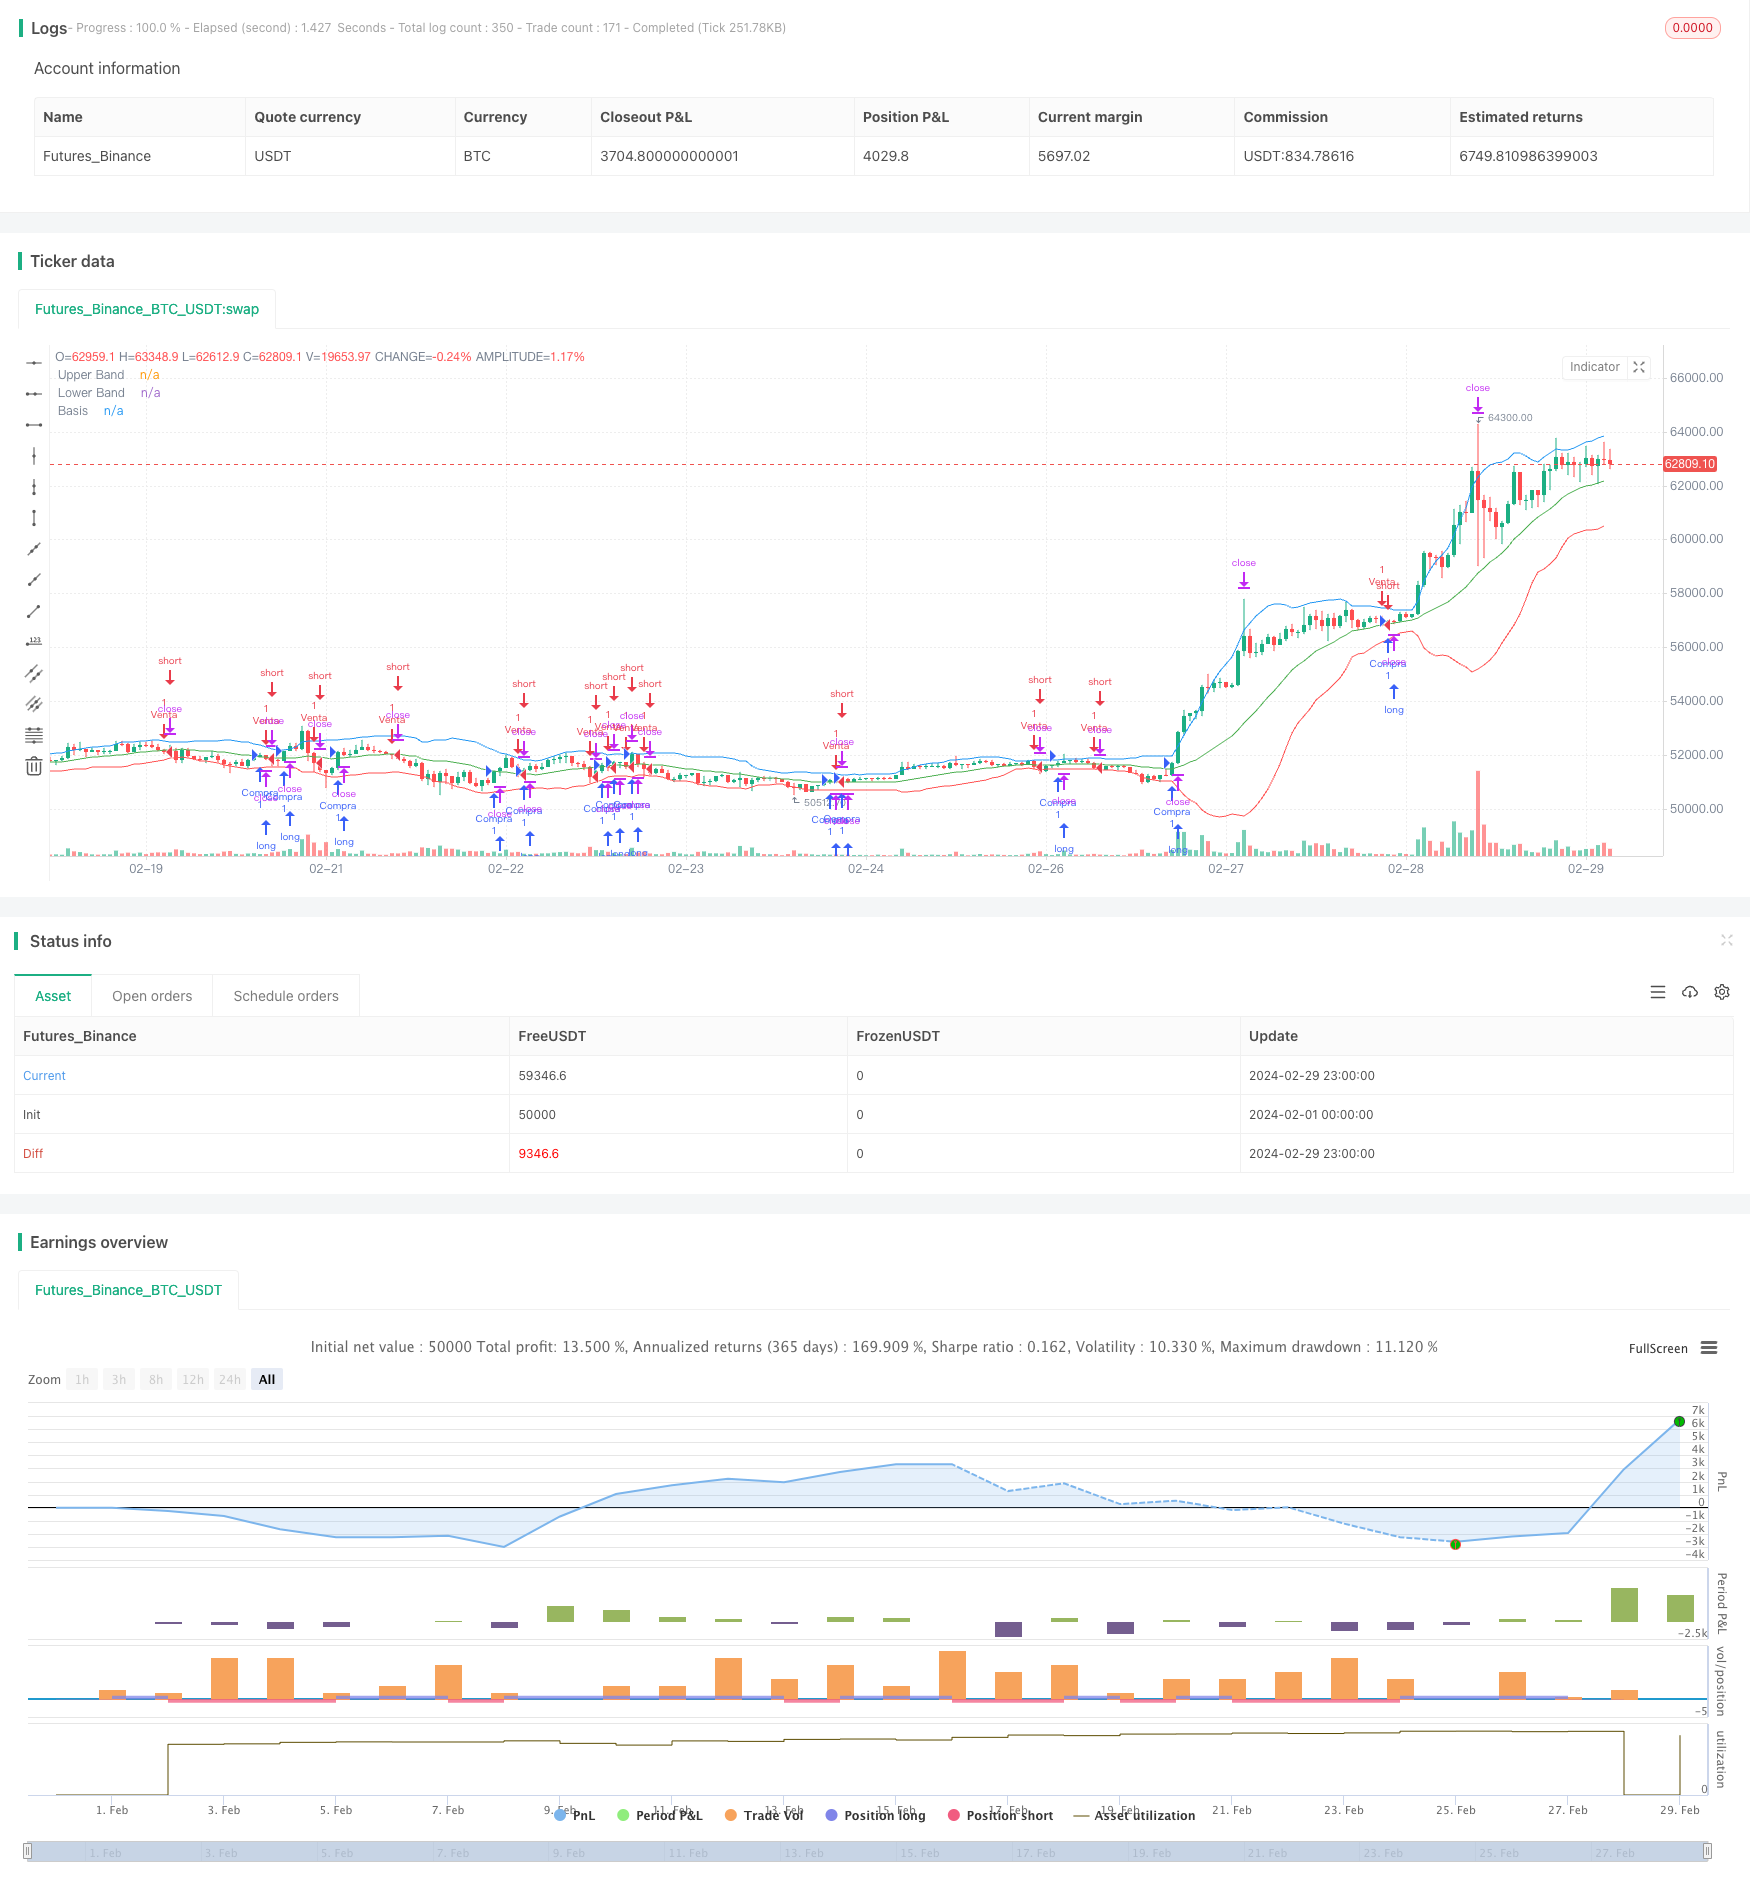
start: 2024-02-01 00:00:00
end: 2024-02-29 23:59:59
period: 1h
basePeriod: 15m
exchanges: [{"eid":"Futures_Binance","currency":"BTC_USDT"}]
*/
//@version=5
strategy("Estrategia Bollinger Bands", shorttitle="BB Strategy", overlay=true)
// Parámetros de las Bandas de Bollinger
length = input(20, title="Longitud")
mult = input(2.0, title="Multiplicador")
// Calcula las Bandas de Bollinger
basis = ta.sma(close, length)
upper_band = basis + mult * ta.stdev(close, length)
lower_band = basis - mult * ta.stdev(close, length)
// Condiciones para realizar operaciones
price_touches_basis_up = ta.crossover(close, basis)
price_touches_basis_down = ta.crossunder(close, basis)
// Lógica de la estrategia
if (price_touches_basis_up)
strategy.entry("Compra", strategy.long, qty = 1)
if (price_touches_basis_down)
strategy.entry("Venta", strategy.short, qty = 1)
// Lógica para cerrar la operación con un movimiento del 0,5% (take profit) o 3% (stop loss)
target_profit = 0.005 // Actualizado a 0.5%
stop_loss = 0.03
if (strategy.position_size > 0)
strategy.exit("Take Profit/Close", from_entry = "Compra", profit = close * (1 + target_profit))
strategy.exit("Stop Loss/Close", from_entry = "Compra", loss = close * (1 - stop_loss))
if (strategy.position_size < 0)
strategy.exit("Take Profit/Close", from_entry = "Venta", profit = close * (1 - target_profit))
strategy.exit("Stop Loss/Close", from_entry = "Venta", loss = close * (1 + stop_loss))
// Dibuja las Bandas de Bollinger en el gráfico
plot(upper_band, color=color.blue, title="Upper Band")
plot(lower_band, color=color.red, title="Lower Band")
plot(basis, color=color.green, title="Basis")