전략 개요
BabyShark VWAP 거래 전략은 거래량 가중 평균 가격 ((VWAP) 과 에너지 물결 지표의 상대적으로 약한 지수 ((OBV RSI) 를 기반으로 한 정량 거래 전략이다. 이 전략은 가격의 VWAP의 편차 정도와 OBV RSI의 특정 경계를 돌파하는 것에 따라 잠재적인 구매 및 판매 신호를 식별하기 위해 고안되었다.
전략 원칙
이 전략의 핵심 원칙은 VWAP와 OBV RSI 두 지표를 사용하여 시장의 추세와 동력 변화를 포착하는 것입니다. VWAP는 가격과 거래량에 기반한 동적 평균으로 시장의 주요 거래 지역을 반영 할 수 있습니다. 가격이 VWAP에서 크게 벗어나면 일반적으로 시장이 과매 또는 과매를 나타냅니다.
구체적으로, 이 전략은 60개의 K선을 VWAP의 계산주기로 사용하며, 종결값을 입력 데이터로 사용한다. 그리고는 가격의 VWAP에서 마이너스 3개의 표준차이의 범위에 따라 오버 바이와 오버 세 지역을 구성한다. OBV RSI의 경우, 5개의 K선을 계산주기로 사용하며, 70과 30의 두 개의 절벽을 오버 바이와 오버 세의 판단기준으로 설정한다.
거래 논리 측면에서, 가격이 VWAP의 하향 경로에 있는 오버솔 지역과 OBV RSI가 30보다 작을 때, 전략은 더 많은 신호를 냅니다. 가격이 VWAP의 상향 경로에 있는 오버솔 지역과 OBV RSI가 70보다 크면, 마이너스 신호를 냅니다. 또한, 전략은 0.6%의 중지 손실 비율을 설정하고, 연속적인 손실 후 10K 선의 냉정 기간을 도입하여 위험을 제어합니다.
전략적 이점
- 가격과 거래량과 같은 여러 시장 요소를 결합하여 시장의 추세와 동력을 포괄적으로 포착합니다.
- 동적 VWAP 및 OBV RSI 지표가 적용되어 다양한 시장 주기의 변화에 적응할 수 있습니다.
- 합리적인 스톱 스톱 손실 비율과 침착 기간을 설정하여 기회를 잡는 동시에 위험을 효과적으로 제어하십시오.
- 논리는 명확하고, 이해하기 쉽고, 구현하기 쉽고, 어느 정도 해석가능성이 있다.
- 다양한 스타일의 트레이더를 위한 최적화 및 개선이 가능합니다.
전략적 위험
- 불안한 시장이나 반복되는 시점에 대한 거래 신호의 빈도는 과도한 거래와 슬라이드 포인트 비용을 증가시킬 수 있습니다.
- 트렌드 상황에서 VWAP에 의존하는 것만으로도 스톱을 하는 것은 전략의 조기 퇴출으로 이어지는 트렌드 수익을 놓치게 할 수 있다.
- 고정된 매개 변수 설정은 시장 환경의 변화에 적응하지 못할 수 있으며, 다른 품종과 주기들에 대한 최적화가 필요합니다.
- OBV 지표는 거래량에 대한 의존성이 강하여 거래량 데이터가 부정확하거나 조작되었을 때 지표의 부정확성은 판단을 오도 할 수 있다.
- 이 전략은 대시경제, 뉴스 등과 같은 외부 요소를 고려하지 않아 극단적인 상황에서는 실패할 수 있습니다.
최적화 방향
- 트렌드 확인 지표, 변동률 지표 등과 같은 불안정한 시장에 대해 더 많은 필터 조건을 도입하여 거래 빈도를 줄이십시오.
- 이동식 정지 또는 다른 트렌드 추적 지표와 결합하여 트렌드 상황을 더 잘 파악하는 것과 같은 오프 경기 조건을 최적화하십시오.
- VWAP와 OBV RSI의 파라미터를 적응적으로 최적화하고, 계산주기와 값 설정을 동적으로 조정한다.
- OBV RSI 지표의 신뢰성을 높이기 위해 거래량 진실성 검사 메커니즘을 도입한다.
- 전략의 적응성 및 안정성을 강화하기 위해, 거시경제 데이터 분석, 감정 지표 등을 포함하는 것을 고려하십시오.
요약하다
BabyShark VWAP 거래 전략은 거래량 가중 평균 가격과 에너지 유조 지표의 상대적으로 약한 지수를 결합한 정량 거래 전략으로, 시장의 과매매 상태와 트렌드 동력의 변화를 포착하여 거래 신호를 생성한다. 이 전략의 논리는 명확하고, 가격과 거래량과 같은 여러 시장 요소를 결합하여 시장의 맥박을 전체적으로 파악할 수 있다. 동시에, 합리적인 스톱 손실 설정 및 위험 제어 메커니즘은 수익을 추구하는 동시에 전략이 위험 관리를 고려하도록 한다. 물론, 전략은 불안한 시장과 트렌드 상황에 대한 적응 부족과 변수 고정과 같은 잠재적인 문제도 있습니다.
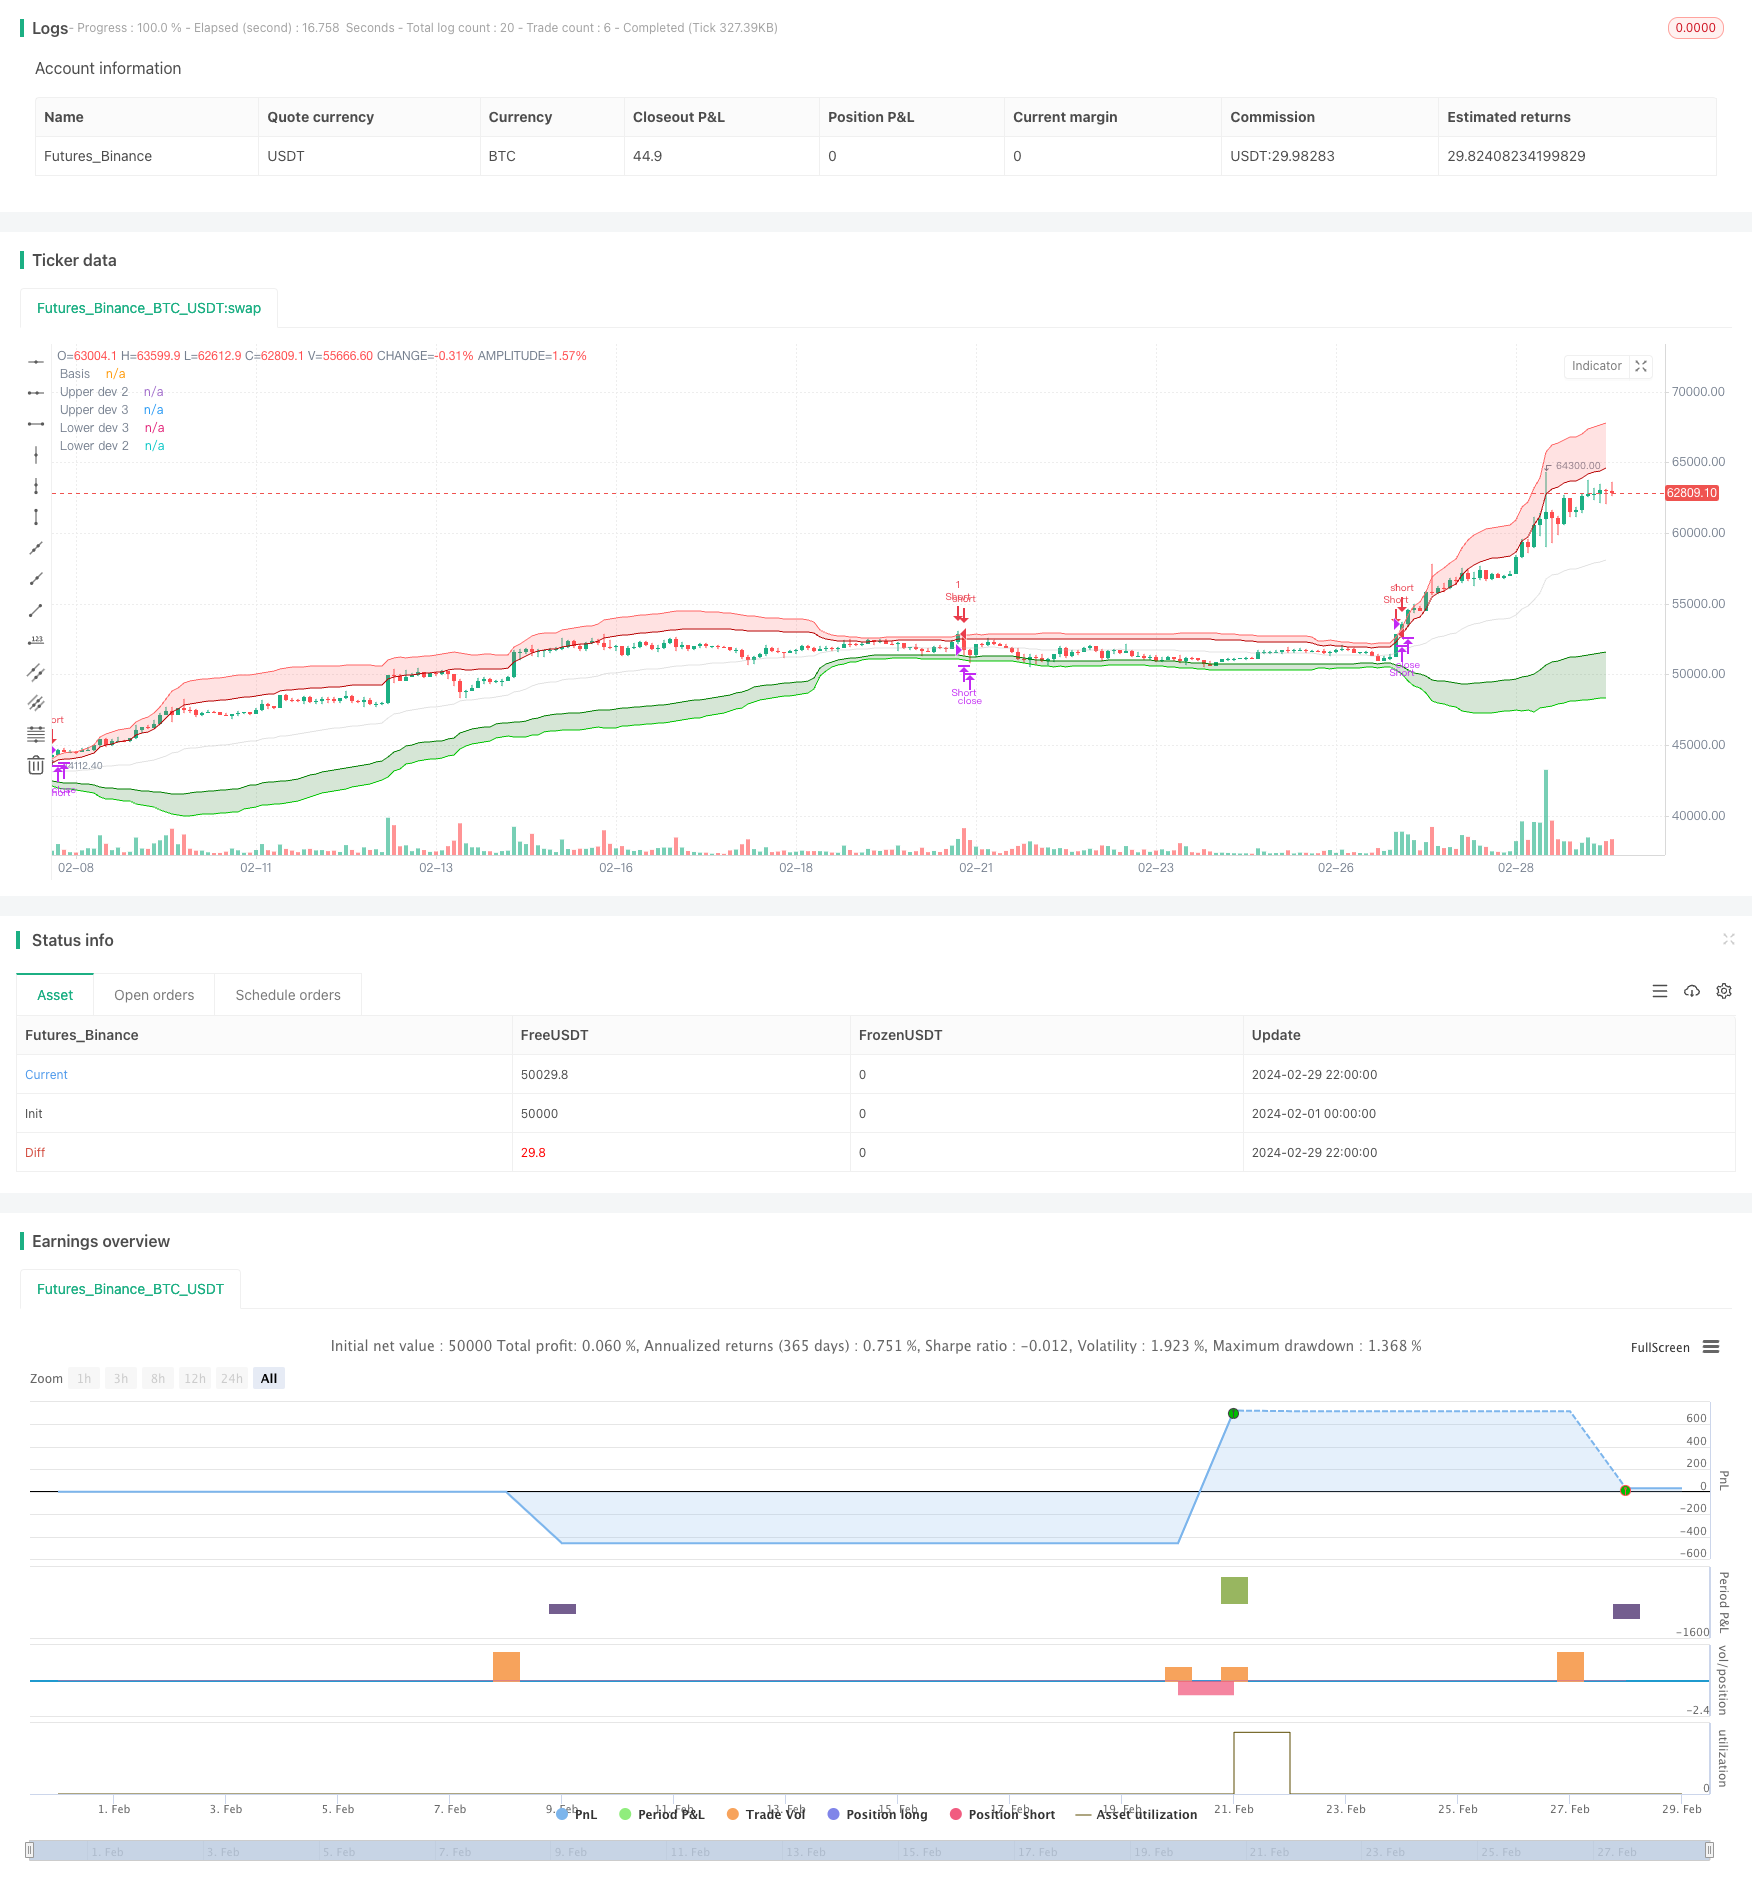
/*backtest
start: 2024-02-01 00:00:00
end: 2024-02-29 23:59:59
period: 2h
basePeriod: 15m
exchanges: [{"eid":"Futures_Binance","currency":"BTC_USDT"}]
*/

// This Pine Script™ code is subject to the terms of the Mozilla Public License 2.0 at https://mozilla.org/MPL/2.0/
// © GreatestUsername

//@version=5
strategy("BabyShark VWAP Strategy", overlay=true, margin_long=100, margin_short=100, calc_on_every_tick = true)


// VWAP
ls = input(false, title='Log-space', group = "Optional")
type = 'Average Deviation'
length = input(60, group="Strategy Modification")
source = input(close, group="Strategy Modification")
_low = ls == true ? math.log(low) : low
_high = ls == true ? math.log(high) : high
src = ls == true ? math.log(source) : source

//weighted mean
pine_vwmean(x, y) =>
    cw = 0.0
    cd = 0.0
    w_sum = 0.0
    d_sum = 0.0
    for i = 0 to y - 1 by 1
        cd := x[i]
        cw := volume[i]
        d_sum += cw * cd
        w_sum += cw
        w_sum
    d_sum / w_sum

//weighted standard deviation
pine_vwstdev(x, y, b) =>
    d_sum = 0.0
    w_sum = 0.0
    cd = 0.0
    for i = 0 to y - 1 by 1
        cd := x[i]
        cw = volume[i]
        d_sum += cw * math.pow(cd - b, 2)
        w_sum += cw
        w_sum
    math.sqrt(d_sum / w_sum)

//weighted average deviation
pine_vwavdev(x, y, b) =>
    d_sum = 0.0
    w_sum = 0.0
    cd = 0.0
    for i = 0 to y - 1 by 1
        cd := x[i]
        cw = volume[i]
        d_sum += cw * math.abs(cd - b)
        w_sum += cw
        w_sum
    d_sum / w_sum

vwmean = pine_vwmean(src, length)

//consider using Average Deviation instead of Standard Deviatio if there are values outside of 3rd upper & lower bands within a rolling window
dev = if type == 'Standard Deviation'
    dev = pine_vwstdev(src, length, vwmean)
    dev
else if type == 'Average Deviation'
    dev = pine_vwavdev(src, length, vwmean)
    dev

basis = ls == true ? math.exp(vwmean) : vwmean
plot(basis, color=color.new(#b7b7b7, 60), title='Basis')

upper_dev_2 = vwmean + dev * 2
upper_dev_3 = vwmean + dev * 3

lower_dev_2 = vwmean - dev * 2
lower_dev_3 = vwmean - dev * 3

fill(
     plot1=plot(ls == true ? math.exp(upper_dev_2) : upper_dev_2, color=color.new(#B20000, 0), title='Upper dev 2'),
     plot2=plot(ls == true ? math.exp(upper_dev_3) : upper_dev_3, color=color.new(#FF6666, 0), title='Upper dev 3', display=display.none),
     color=color.new(#FF4D4D, 80), title='Upper band'
     )
fill(
     plot1=plot(ls == true ? math.exp(lower_dev_3) : lower_dev_3, color=color.new(#00CC00, 0), title='Lower dev 3', display=display.none),
     plot2=plot(ls == true ? math.exp(lower_dev_2) : lower_dev_2, color=color.new(#008000, 0), title='Lower dev 2'),
     color=color.new(#006600, 80), title='Lower band'
     )


// Input to enable or disable the table visibility
table_visible = input(false, title="Show Table", group="Deviation Cross Monitor")
// Input for the number of candles to look back
table_length = input(300, title="Table Lookback Length", group="Deviation Cross Monitor")

// Custom count function
count_occurrences(cond, length) =>
    count = 0
    for i = 0 to length - 1
        if cond[i]
            count := count + 1
    count

// Count occurrences of prices above Upper dev 2 and below Lower dev 2

above_upper_dev_2 = count_occurrences(close > upper_dev_2, table_length)
below_lower_dev_2 = count_occurrences(close < lower_dev_2, table_length)

// Create table in the bottom right corner
var table tbl = table.new(position=position.bottom_right, rows=2, columns=2)

if table_visible
    if barstate.islast
        // Update the table headers
        table.cell(tbl, 0, 0, "Above Upper Dev 2", bgcolor=color.gray, text_color=color.white)
        table.cell(tbl, 0, 1, "Below Lower Dev 2", bgcolor=color.gray, text_color=color.white)

        // Update the table values
        table.cell(tbl, 1, 0, str.tostring(above_upper_dev_2), bgcolor=color.new(color.green, 90), text_color=color.green)
        table.cell(tbl, 1, 1, str.tostring(below_lower_dev_2), bgcolor=color.new(color.red, 90), text_color=color.red)
else
    table.delete(tbl)

// RSI
obvsrc = close
change_1 = ta.change(obvsrc)
obv = ta.cum(ta.change(obvsrc) > 0 ? volume : change_1 < 0 ? -volume : 0 * volume)

src2 = obv
len = input.int(5, minval=1, title="RSI Length", group="Strategy Modification")
up = ta.rma(math.max(ta.change(src2), 0), len)
down = ta.rma(-math.min(ta.change(src2), 0), len)
rsi = down == 0 ? 100 : up == 0 ? 0 : 100 - 100 / (1 + up / down)
higherlvl = input(70, title="Higher Level", group="Strategy Modification")
lowerlvl = input(30, title="Lower Level", group="Strategy Modification")


plot_color = rsi >= higherlvl ? color.red : rsi <= lowerlvl ? color.green : color.new(#b7b7b7, 60)
// plot(rsi, color=plot_color)

//plot(rsi, color=color.white)


// Count occurrences of RSI crossing higher level and lower level
cross_above_higher = ta.crossover(rsi, higherlvl)
cross_below_lower = ta.crossunder(rsi, lowerlvl)
above_higher_count = count_occurrences(cross_above_higher, table_length)
below_lower_count = count_occurrences(cross_below_lower, table_length)

// Create table in the bottom right corner
if (table_visible)
    var table tbl2 = table.new(position=position.bottom_right, rows=2, columns=2)
    if (barstate.islast)
        // Update the table headers
        table.cell(tbl2, 0, 0, "Higher Level Cross", bgcolor=color.gray, text_color=color.white)
        table.cell(tbl2, 0, 1, "Lower Level Cross", bgcolor=color.gray, text_color=color.white)

        // Update the table values
        table.cell(tbl2, 1, 0, str.tostring(above_higher_count), bgcolor=color.new(color.red, 90), text_color=color.red)
        table.cell(tbl2, 1, 1, str.tostring(below_lower_count), bgcolor=color.new(color.green, 90), text_color=color.green)


// Entries

// Long Entry:
// Price is in the shaded GREEN area of [Hoss] VWAP Deviation
// and the [Hoss] OBV RSI is GREEN.
longCondition1 = close <= lower_dev_3
longConditions = plot_color == color.green and longCondition1 and strategy.position_size == 0

// Short Entry:
// Price is in the shaded RED area of [Hoss] VWAP Deviation
// and the [Hoss] OBV RSI is RED.
shortCondition1 = close >= upper_dev_3
shortConditions = plot_color == color.red and shortCondition1 and strategy.position_size == 0

var int lastEntryBar = 0


shortEMA = ta.ema(close, 12)
longEMA = ta.ema(close, 21)
uptrend = shortEMA > longEMA

if longConditions and lastEntryBar < bar_index - 10 //and uptrend
    strategy.entry("Long", strategy.long, stop=close * 0.994)
    lastEntryBar := bar_index

if shortConditions and lastEntryBar < bar_index - 10 //and not uptrend
    strategy.entry("Short", strategy.short, stop=close * 1.006)
    lastEntryBar := bar_index


if strategy.position_size > 0 and (ta.crossover(close, basis) or strategy.opentrades.entry_price(strategy.opentrades - 1) * 0.994 > close)
    strategy.close("Long", immediately = true)
if strategy.position_size < 0 and (ta.crossunder(close, basis) or strategy.opentrades.entry_price(strategy.opentrades - 1) * 1.006 < close)
    strategy.close("Short", immediately = true)

// Stop Loss:
// 0.6%
// After 1 Loss => NO more Trades for 10 Candles (10 minutes) (usually a breakout will happen, and it takes average 10min till it ranges again. So basically wait for range to form again)

// Take Profit:
// Grey line on [Hoss] VWAP Deviation or 0.6%