스토캐스틱 RSI와 EMA 교차 기반 암호화폐 되돌림 거래 전략

전략 개요
본 전략은 스토캐스틱 RSI와 EMA를 결합하여 추세를 감지하고 거래 신호를 검증합니다. 가격이 EMA20 위에서 EMA9와 EMA14 사이로 되돌릴 때 스토캐스틱 RSI가 과매도 수준 아래에 있으면 매수 신호가 발생합니다. 가격이 EMA20 아래에서 EMA9와 EMA14 사이로 되돌릴 때 스토캐스틱 RSI가 과매수 수준 위에 있으면 매도 신호가 발생합니다.
전략 원리
- ta.ema 함수를 사용하여 서로 다른 주기의 EMA 선 3개(EMA9, EMA14, EMA20)를 계산하여 가격이 위치한 추세 상태를 판단합니다.
- ta.rsi 함수로 RSI 지표를 계산한 후 ta.stoch 함수를 사용하여 RSI를 스토캐스틱 RSI 지표로 변환하여 가격의 과매수/과매도 여부를 판단합니다.
- 종가가 EMA20보다 크고 EMA9 및 EMA14보다 작으며, 동시에 스토캐스틱 RSI가 과매도 수준보다 낮으면 매수 신호가 발생하여 매수 진입을 실행합니다.
- 종가가 EMA20보다 작고 EMA9 및 EMA14보다 크며, 동시에 스토캐스틱 RSI가 과매수 수준보다 높으면 매도 신호가 발생하여 매도 진입을 실행합니다.
본 전략의 핵심 아이디어는 스토캐스틱 RSI를 이용하여 가격이 주요 추세(EMA20으로 표시) 내에서 되돌림이 적절한 과매수/과매도 영역에 도달했는지 판단하고, 빠른 EMA와 중간 EMA를 사용하여 되돌림의 강도를 검증하는 것입니다. 가격이 빠른 EMA와 중간 EMA를 돌파하면 되돌림이 종료되고 추세가 반전될 수 있으므로 진입에 부적합하며, 가격이 EMA9와 EMA14 사이로 되돌릴 때만 추세에 따라 진입을 고려합니다. 이러한 다중 조건 검증 방식은 신호 품질을 효과적으로 개선하고 오판을 줄일 수 있습니다.
전략 장점
- 추세 지표(EMA)와 오실레이터 지표(RSI)를 결합하여 추세와 과매수/과매도 시점을 더 잘 포착할 수 있습니다.
- 스토캐스틱 RSI를 사용하여 원본 RSI 지표에 비해 두 가지 장점이 있습니다. 첫째, 지표의 평활성이 증가하고 둘째, 지표가 장시간 극값에 고착되는 현상을 방지합니다.
- 다중 조건 검증을 통해 많은 가짜 신호를 효과적으로 걸러내어 신호의 신뢰성을 높입니다.
- 코드 로직이 명확하고 간단하여 이해와 수정이 쉬우며 초보자 학습 템플릿으로 사용할 수 있습니다.
전략 위험
- 횡보장에는 적합하지 않습니다. EMA가 자주 교차하여 많은 허위 신호가 발생할 수 있기 때문입니다.
- 추세가 매우 강하여 가격이 단방향으로 상승 또는 하락할 경우 되돌림이 얕아 본 전략이 많은 기회를 놓칠 수 있습니다.
- EMA 매개변수 선택이 전략에 큰 영향을 미치며, 다른 종목과 다른 주기에 따라 각각 조정이 필요합니다.
- 스토캐스틱 RSI 매개변수도 실제 상황에 맞게 조정해야 하며, 현재 기본값은 일부 종목에서 효과가 좋지 않을 수 있습니다.
최적화 방향
- ATR 지표를 도입하여 과매수/과매도 수준을 동적으로 조정함으로써 다양한 변동성에 대응할 수 있습니다.
- 더 많은 다양한 주기의 EMA를 추가하여 가격 되돌림 위치를 더 정밀하게 설명할 수 있습니다.
- 손절매와 이익실현도 반드시 고려해야 합니다. 백분율 손절매나 ATR 손절매를 사용하거나 트레일링 스탑으로 이익을 보호할 수 있습니다.
- 캔들 패턴(예: 피어싱, 잉꼬 등)을 활용하여 추세 전환 판단을 보조하고, 보충 조건으로 정확도를 높일 수 있습니다.
요약
본 전략은 스토캐스틱 RSI와 EMA의 다중 조건 검증을 통해 추세 되돌림을 포착하면서 리스크를 효과적으로 통제합니다. 전반적인 접근 방식이 간단하고 이해하기 쉬워 초보자가 학습하고 사용하기에 적합합니다. 그러나 전략 자체에 몇 가지 한계가 있습니다. 예를 들어 횡보장에서는 성과가 좋지 않고, 강한 추세장에서 기회를 충분히 포착하지 못하는 점 등이 있으므로 실제 상황에 따라 매개변수를 유연하게 조정해야 합니다. 향후 동적 매개변수, 더 많은 지표 검증, 자금 관리 등의 측면에서 전략을 최적화하고 개선하여 더 안정적인 수익을 확보할 수 있습니다. 전반적으로 이 전략은 기본 템플릿으로 활용할 수 있으며, 이를 기반으로 수정 및 확장이 가능하여 좋은 출발점이자 학습 자료입니다.
/*backtest
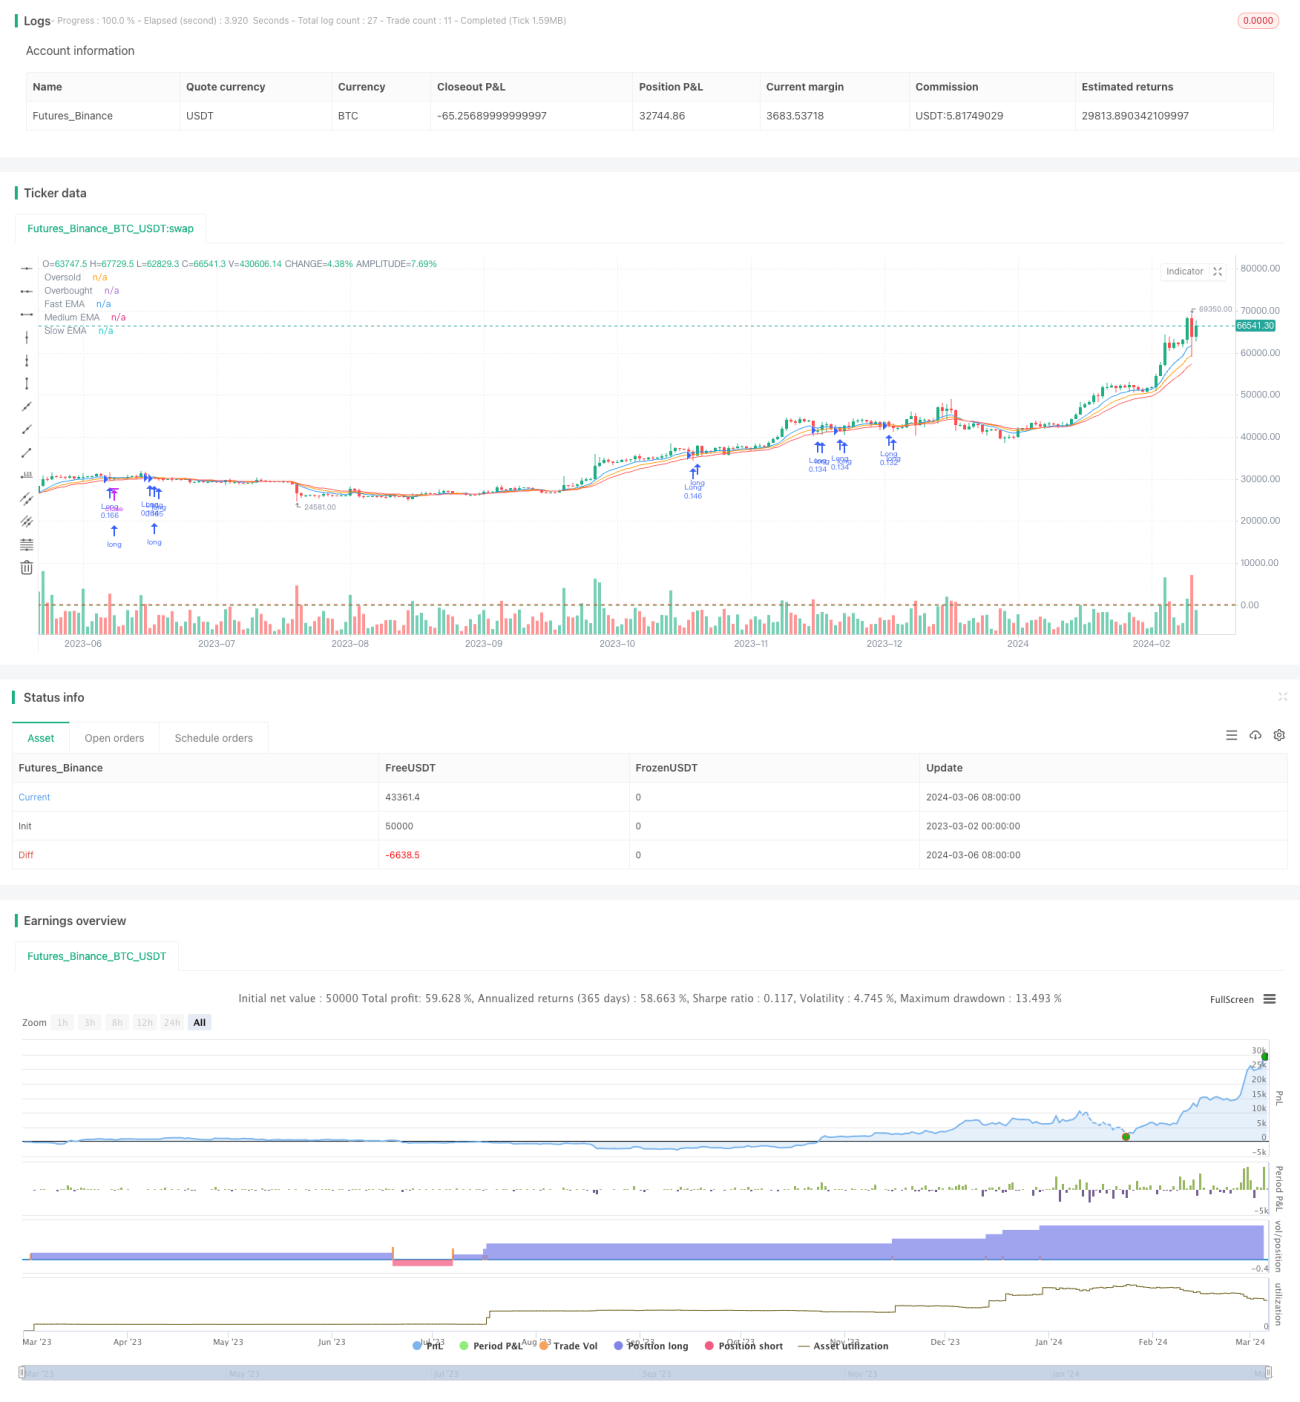
start: 2023-03-02 00:00:00
end: 2024-03-07 00:00:00
period: 1d
basePeriod: 1h
exchanges: [{"eid":"Futures_Binance","currency":"BTC_USDT"}]
*/
//@version=5
strategy("Crypto-EMA_Pullback=-", overlay=true,initial_capital = 10000000,default_qty_type=strategy.percent_of_equity, default_qty_value=10.0, pyramiding = 10)
// Inputs- 1