전략 개요
이 전략은 지원 저항 수준, 슈퍼 트렌드 지표 및 이동 평균과 같은 여러 기술 지표를 종합하여 여러 시간 프레임에 걸쳐 종합적으로 트렌드 방향을 판단하여 트렌드 추적 거래 시스템을 구현합니다. 이 전략의 주요 아이디어는: 우선 중심 지점을 사용하여 현재 가격의 지원 저항 위치를 판단한 다음 슈퍼 트렌드 지표를 사용하여 현재 트렌드 방향을 판단한 다음 이동 평균 필터를 사용하여 이동 상태에서 벗어나는 것입니다. 동시에, 전략은 거래 시간 창을 설정하고 최대 포지션을 제한하는 등의 위험 관리를 지원합니다.
전략 원칙
- 우선, 지난 일정 주기에서 최고 최저 가격을 기준으로 축점을 계산하여 현재 가격의 지지 저항 지점을 얻는다.
- 슈퍼트렌드 지표 (Supertrend) 를 사용하여 추세를 판단한다. 슈퍼트렌드는 동적 지원 저항으로 계산되며, 트렌드 추적 지표이다.
- ATR을 사용하여 중지하십시오. 이 전략은 원래의 초고속 추세에 따라 ATR을 중지 장소로 추가했습니다.
- 이동 평균을 트렌드 필터로 사용한다. 트렌드가 상승하고 가격이 평균선 위에 있을 때만 더 많이 하고, 트렌드가 하락하고 가격이 평균선 아래에 있을 때 공백한다.
- 거래 시간 창을 설정하십시오. 특정 시간대에만 포지션을 열고 중요한 시간에 거래하는 것을 피하십시오.
- 다중 공백 포지션은 각각 관리된다. 다중 헤드 및 공백 헤드 신호는 각각 공백 포지션 논리를 촉발한다.
종합적으로, 이 전략은 중심축 지점을 지원하는 저항, 슈퍼 트렌드 방향, 평선 방향의 세 가지 조건이 공명할 때 포지션을 열고, 어느 조건이 무효가 될 때 평형 포지션을 니다. 이것은 효과적으로 트렌드 상황을 포착하면서 위험을 통제합니다.
우위 분석
- 지원 저항점 거래의 장점은 시장의 수요와 공급 법칙에 부합하는 것이며, 중심점은 시장의 균형에 동적으로 반응할 수 있다.
- 슈퍼 트렌드는 트렌드를 효과적으로 포착하고 적시에 상쇄할 수 있다. ATR 상쇄는 위험을 더욱 통제한다.
- 평선 필터링은 역동적인 거래를 피한다. 동향과 평선이 공명할 때 진출하면 승률이 높다.
- 커스텀 트레이딩 타임 창은 거래가 중요한 시점인 거래 개시와 종료 전에 거래되는 것을 어느 정도 방지합니다.
- 다중 헤드 및 빈 헤드 신호는 각각 독립적으로 작동하며, 동시에 다중 빈 포지션을 보유하여 시장 기회를 더 충분히 활용할 수 있다.
위험 분석
- 자주 거래하는 위험. 이 전략은 종종 시장을 가파르게 풀어서 과도한 거래 비용을 초래할 수 있다.
- 역전 거래가 발생할 수 있습니다. 이 전략은 평행선 필터링을 사용하지만, 평행선이 큰 흐름과 상반되는 경우 역전 거래가 발생할 수 있습니다.
- 매개 변수의 최적화 문제. 전략에는 수 많은 매개 변수들이 포함되어 있는데, 예를 들어 슈퍼 트렌드의 주기 및 곱, 평균 주기 등이 있다. 다른 매개 변수는 다른 결과를 얻을 것이며, 최적의 매개 변수 조합을 선택하는 것은 도전이다.
- 극단적인 상황에서는 효과가 떨어질 수 있다. 급격한 폭락, 유동성 위기 등과 같은 극단적인 상황에서는 이 전략이 적시에 손실을 막을 수 없다.
최적화 방향
- 더 많은 중장기 평균선을 도입하고, 트렌드 판단의 신뢰성을 높이고, 거래의 빈도를 줄여줍니다.
- 부린 띠와 같은 변동성 지표를 도입하여 높은 변동성 시장에서 거래를 줄이는 것을 고려할 수 있다.
- 다양한 변수를 최적화하여 최적의 변수 조합을 찾아서 전략의 안정성을 높인다.
- 극단적인 상황에서는 하드 스톱을 설정하고, 위험을 통제한다. 또한, 가격 급등, 거래량 급증 등과 같은 시장의 비정상적인 변동에 대한 판단을 포함할 수 있으며, 비정상시에는 거래를 줄이거나 중단할 수 있다.
요약하다
이 전략은 지원 저항, 트렌드 추적, 동력 필터 등 여러 가지 기술적 분석 방법을 통합하여 트렌드 상황에서 효과적으로 이익을 얻을 수 있으며 철회 위험을 제어할 수 있습니다. 이 전략의 장점은 신호가 명확하고 간결하고 논리적으로 명확하며 중기 기간 동안 사용할 수 있다는 것입니다. 그러나 이 전략에는 자주 거래, 매개 변수 최적화 난이도가 높고 극단적인 상황에서의 위험 제어 부족 등의 문제가 있습니다.
전략 소스 코드
/*backtest
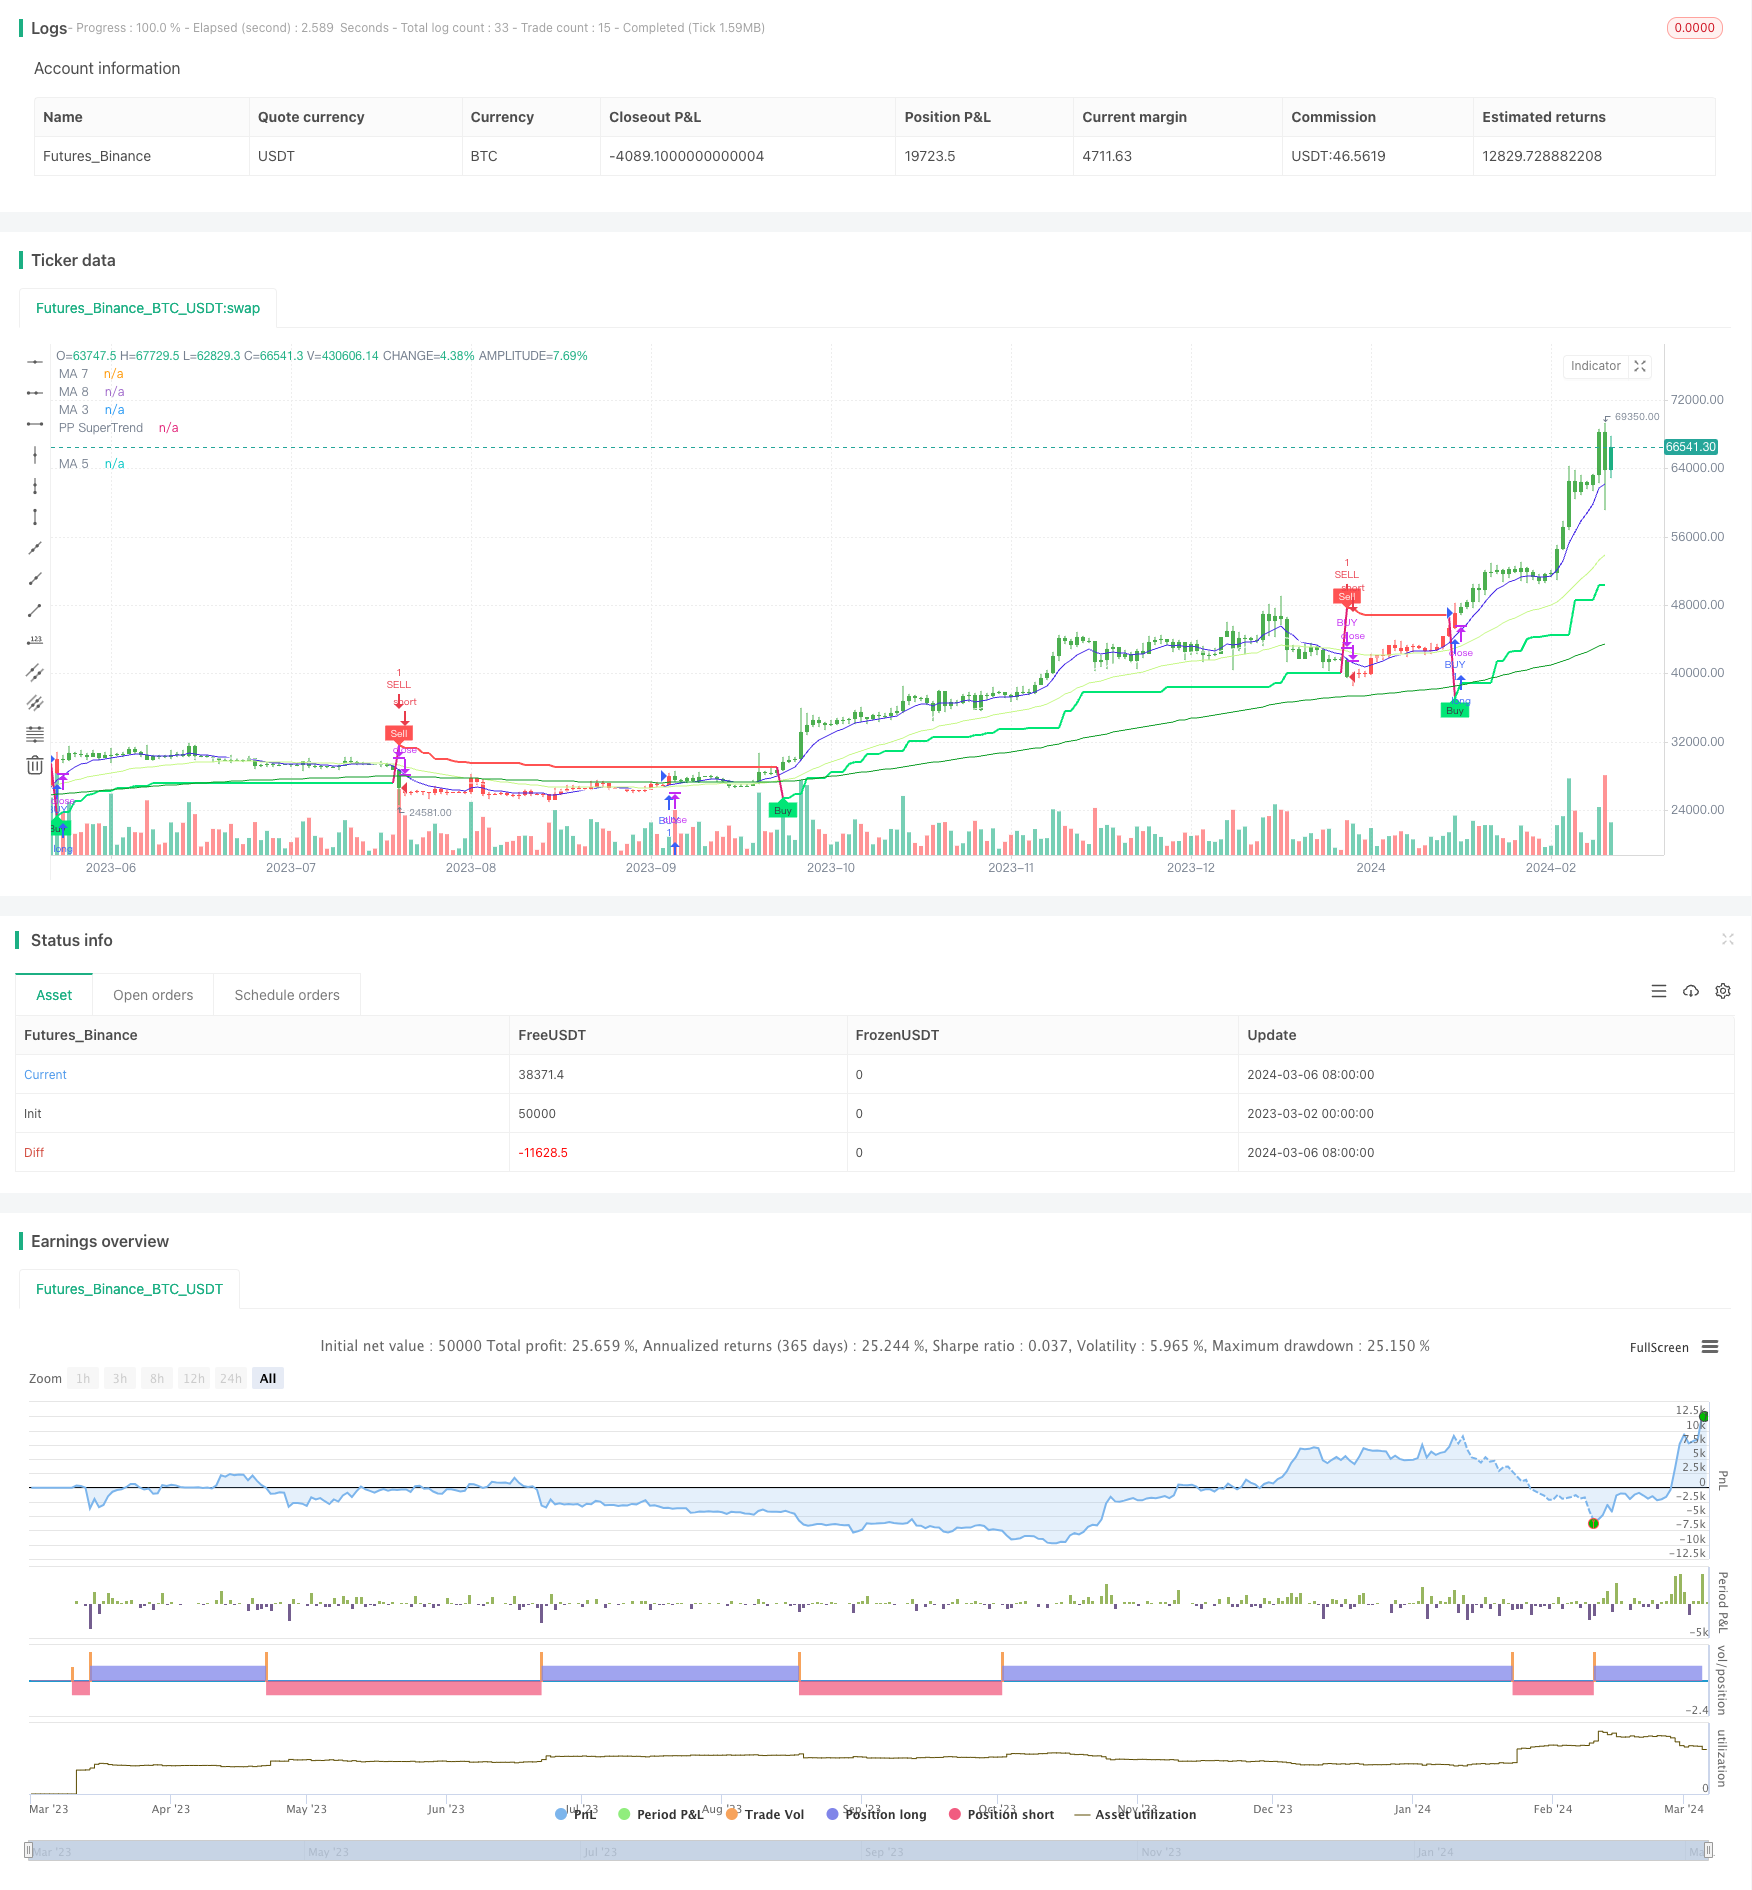
start: 2023-03-02 00:00:00
end: 2024-03-07 00:00:00
period: 1d
basePeriod: 1h
exchanges: [{"eid":"Futures_Binance","currency":"BTC_USDT"}]
*/
//@rpcoelho
// Based on © Julien_Eche "Pivot Point Supertrend" with optional EMAs ploted
//@version=4
strategy("PPS w/ EMAs", overlay=true)
prd = input(defval = 1, title="Pivot Point Period", minval = 1, maxval = 50)
Factor=input(defval = 4, title = "ATR Factor", minval = 1, step = 0.1)
Pd=input(defval = 72, title = "ATR Period", minval=1)
showpivot = input(defval = false, title="Show Pivot Points")
showlabel = input(defval = true, title="Show Buy/Sell Labels")
showcl = input(defval = false, title="Show PP Center Line")
showsr = input(defval = false, title="Show Support/Resistance")
/////////////////////////////////////////////////////////////////////////
// Switch Board
////////////////////////////////////////////////////////////////////////
// Define the switch board title as a label (since grouping is not available)
//switchboard_group = "████ Switch Board (Turn On/Off Overlay Indicators) ████"
//label.new(bar_index, high, switchboard_group, color=color.red)
// Create input controls for EMA and VWAP switches
switch_ema = input(true, title="EMA")
/////////////////////////////////////////////////////////////////////////
// EMA Selection
////////////////////////////////////////////////////////////////////////
ma_function(source, length, type) =>
float ma = na
if type == 'RMA'
ma := rma(source, length)
else if type == 'SMA'
ma := sma(source, length)
else if type == 'EMA'
ma := ema(source, length)
else if type == 'WMA'
ma := wma(source, length)
else if type == 'HMA'
ma := length < 2 ? hma(source, 2) : hma(source, length)
else
ma := vwma(source, length)
ma
// Moving Averages Line Title
//ma_group = "██████████ MAs Line ██████████"
// Inputs for MA 1
len1bool = input(false, title="Show MA 1")
len1 = input(13, title="Length MA 1")
ma_1_type = input("EMA", title="Type MA 1", options=["RMA", "SMA", "EMA", "WMA", "HMA", "VWMA"])
src_ma1 = input(title="MA1 Source", type=input.source, defval=close)
ma_1_colour = input(color.rgb(235, 159, 238), title="Color MA 1")
// Inputs for MA 2
len2bool = input(false, title="Show MA 2")
len2 = input(17, title="Length MA 2")
ma_2_type = input("EMA", title="Type MA 2", options=["RMA", "SMA", "EMA", "WMA", "HMA", "VWMA"])
src_ma2 = input(title="MA2 Source", type=input.source, defval=close)
ma_2_colour = input(color.rgb(230, 241, 65), title="Color MA 2")
// Inputs for MA 3
len3bool = input(true, title="Show MA 3")
len3 = input(34, title="Length MA 3")
ma_3_type = input("EMA", title="Type MA 3", options=["RMA", "SMA", "EMA", "WMA", "HMA", "VWMA"])
src_ma3 = input(title="MA3 Source", type=input.source, defval=close)
ma_3_colour = input(#c7f887, title="Color MA 3")
// Inputs for MA 4
len4bool = input(false, title="Show MA 4")
len4 = input(72, title="Length MA 4")
ma_4_type = input("EMA", title="Type MA 4", options=["RMA", "SMA", "EMA", "WMA", "HMA", "VWMA"])
src_ma4 = input(title="MA4 Source", type=input.source, defval=close)
ma_4_colour = input(#2f6999, title="Color MA 4")
// Inputs for MA 5
len5bool = input(true, title="Show MA 5")
len5 = input(144, title="Length MA 5")
ma_5_type = input("EMA", title="Type MA 5", options=["RMA", "SMA", "EMA", "WMA", "HMA", "VWMA"])
src_ma5 = input(title="MA5 Source", type=input.source, defval=close)
ma_5_colour = input(color.rgb(13, 156, 37), title="Color MA 5")
// Inputs for MA 6
len6bool = input(true, title="Show MA 6")
len6 = input(610, title="Length MA 6")
ma_6_type = input("EMA", title="Type MA 6", options=["RMA", "SMA", "EMA", "WMA", "HMA", "VWMA"])
src_ma6 = input(title="MA6 Source", type=input.source, defval=close)
ma_6_colour = input(color.rgb(173, 161, 152), title="Color MA 6")
// Inputs for MA 7
len7bool = input(true, title="Show MA 7")
len7 = input(8, title="Length MA 7")
ma_7_type = input("EMA", title="Type MA 7", options=["RMA", "SMA", "EMA", "WMA", "HMA", "VWMA"])
src_ma7 = input(title="MA7 Source", type=input.source, defval=close)
ma_7_colour = input(color.rgb(68, 39, 231), title="Color MA 7")
// Inputs for MA 8
len8bool = input(true, title="Show MA 8")
len8 = input(21, title="Length MA 8")
ma_8_type = input("EMA", title="Type MA 8", options=["RMA", "SMA", "EMA", "WMA", "HMA", "VWMA"])
src_ma8 = input(title="MA8 Source", type=input.source, defval=close)
ma_8_colour = input(color.white, title="Color MA 8")
ema1 = security(syminfo.tickerid, timeframe.period, ma_function(src_ma1, len1, ma_1_type))
ema2 = security(syminfo.tickerid, timeframe.period, ma_function(src_ma2, len2, ma_2_type))
ema3 = security(syminfo.tickerid, timeframe.period, ma_function(src_ma3, len3, ma_3_type))
ema4 = security(syminfo.tickerid, timeframe.period, ma_function(src_ma4, len4, ma_4_type))
ema5 = security(syminfo.tickerid, timeframe.period, ma_function(src_ma5, len5, ma_5_type))
ema6 = security(syminfo.tickerid, timeframe.period, ma_function(src_ma6, len6, ma_6_type))
ema7 = security(syminfo.tickerid, timeframe.period, ma_function(src_ma7, len7, ma_7_type))
ema8 = security(syminfo.tickerid, timeframe.period, ma_function(src_ma8, len8, ma_8_type))
plot(len1bool and switch_ema ? ema1:na, color=ma_1_colour, linewidth=1, title='MA 1')
plot(len2bool and switch_ema? ema2:na, color=ma_2_colour, linewidth=1, title='MA 2')
plot(len3bool and switch_ema? ema3:na, color=ma_3_colour, linewidth=1, title='MA 3')
plot(len4bool and switch_ema? ema4:na, color=ma_4_colour, linewidth=1, title='MA 4')
plot(len5bool and switch_ema? ema5:na, color=ma_5_colour, linewidth=1, title='MA 5')
plot(len6bool and switch_ema? ema6:na, color=ma_6_colour, linewidth=2, title='MA 6')
plot(len7bool and switch_ema? ema7:na, color=ma_7_colour, linewidth=1, title='MA 7')
plot(len8bool and switch_ema? ema8:na, color=ma_8_colour, linewidth=1, title='MA 8')
// get Pivot High/Low
float ph = pivothigh(prd, prd)
float pl = pivotlow(prd, prd)
// drawl Pivot Points if "showpivot" is enabled
plotshape(ph and showpivot, text="H", style=shape.labeldown, color=na, textcolor=color.red, location=location.abovebar, transp=0, offset = -prd)
plotshape(pl and showpivot, text="L", style=shape.labeldown, color=na, textcolor=color.lime, location=location.belowbar, transp=0, offset = -prd)
// calculate the Center line using pivot points
var float center = na
float lastpp = ph ? ph : pl ? pl : na
if lastpp
if na(center)
center := lastpp
else
//weighted calculation
center := (center * 2 + lastpp) / 3
// upper/lower bands calculation
Up = center - (Factor * atr(Pd))
Dn = center + (Factor * atr(Pd))
// get the trend
float TUp = na
float TDown = na
Trend = 0
TUp := close[1] > TUp[1] ? max(Up, TUp[1]) : Up
TDown := close[1] < TDown[1] ? min(Dn, TDown[1]) : Dn
Trend := close > TDown[1] ? 1: close < TUp[1]? -1: nz(Trend[1], 1)
Trailingsl = Trend == 1 ? TUp : TDown
// plot the trend
linecolor = Trend == 1 and nz(Trend[1]) == 1 ? color.lime : Trend == -1 and nz(Trend[1]) == -1 ? color.red : na
plot(Trailingsl, color = linecolor , linewidth = 2, title = "PP SuperTrend")
plot(showcl ? center : na, color = showcl ? center < hl2 ? color.blue : color.red : na)
// check and plot the signals
bsignal = Trend == 1 and Trend[1] == -1
ssignal = Trend == -1 and Trend[1] == 1
plotshape(bsignal and showlabel ? Trailingsl : na, title="Buy", text="Buy", location = location.absolute, style = shape.labelup, size = size.tiny, color = color.lime, textcolor = color.black, transp = 0)
plotshape(ssignal and showlabel ? Trailingsl : na, title="Sell", text="Sell", location = location.absolute, style = shape.labeldown, size = size.tiny, color = color.red, textcolor = color.white, transp = 0)
//get S/R levels using Pivot Points
float resistance = na
float support = na
support := pl ? pl : support[1]
resistance := ph ? ph : resistance[1]
// if enabled then show S/R levels
plot(showsr and support ? support : na, color = showsr and support ? color.lime : na, style = plot.style_circles, offset = -prd)
plot(showsr and resistance ? resistance : na, color = showsr and resistance ? color.red : na, style = plot.style_circles, offset = -prd)
// Trend Filter from SuperTrend Long Strategy
Periods = input(title="ATR Period", type=input.integer, defval=3)
src = input(hlc3, title="Source")
Multiplier = input(title="ATR Multiplier", type=input.float, step=0.1, defval=4.0)
changeATR = input(title="Change ATR Calculation Method ?", type=input.bool, defval=true)
// Combine the SuperTrend calculations
atr2 = sma(tr, Periods)
atr = changeATR ? atr(Periods) : atr2
up = src - (Multiplier * atr)
up1 = nz(up[1], up)
up := close[1] > up1 ? max(up, up1) : up
dn = src + (Multiplier * atr)
dn1 = nz(dn[1], dn)
dn := close[1] < dn1 ? min(dn, dn1) : dn
trend = 1
trend := nz(trend[1], trend)
trend := trend == -1 and close > dn1 ? 1 : trend == 1 and close < up1 ? -1 : trend
// Moving Average as Trend Filter
periodes_ma = input(title="Moving Average Period", type=input.integer, defval=20)
src_ma = input(title="Moving Average Source", type=input.source, defval=close)
ma = sma(src_ma, periodes_ma)
// Strategy Entry Conditions
FromMonth = input(defval = 1, title = "From Month", minval = 1, maxval = 12)
FromDay = input(defval = 1, title = "From Day", minval = 1, maxval = 31)
FromYear = input(defval = 2017, title = "From Year", minval = 999)
ToMonth = input(defval = 1, title = "To Month", minval = 1, maxval = 12)
ToDay = input(defval = 1, title = "To Day", minval = 1, maxval = 31)
ToYear = input(defval = 9999, title = "To Year", minval = 999)
start = timestamp(FromYear, FromMonth, FromDay, 00, 00)
finish = timestamp(ToYear, ToMonth, ToDay, 23, 59)
window() => true
// Combined entry conditions
longCondition = (trend == 1 and trend[1] == -1 and close > ma) or (bsignal and window())
shortCondition = (trend == -1 and trend[1] == 1 and close < ma) or (ssignal and window())
if (longCondition)
strategy.entry("BUY", strategy.long)
if (shortCondition)
strategy.close("BUY")
strategy.entry("SELL", strategy.short)
buy1 = barssince((trend == 1 and trend[1] == -1 and close > ma) or (bsignal and window()))
sell1 = barssince((trend == -1 and trend[1] == 1 and close < ma) or (ssignal and window()))
color1 = buy1[1] < sell1[1] ? color.green : buy1[1] > sell1[1] ? color.red : na
barcolor(color1)