TrendHunter w/MF 다중 시간 프레임 추세 전략

개요
TrendHunter w/MF 다중 시간 프레임 트렌드 전략은 여러 기술적 지표와 다중 시간 프레임 분석을 기반으로 하는 트렌드 추종 전략입니다. 이 전략은 시장 구름, 이동 평균, 슈퍼트렌드, 웨이브트렌드 및 자금 흐름 등의 요소를 종합적으로 고려하여 엄격한 조건을 통해 진입점을 결정함으로써 시장의 주요 추세를 포착합니다.
전략 원리
해당 전략의 핵심 원리는 여러 기술적 지표를 여러 시간 프레임에서 종합적으로 분석하는 데 있습니다. 구체적으로는 다음과 같습니다:
-
시장 구름(Ichimoku): 가격과 구름의 상대적 위치, 그리고 이동 평균과 구름의 상대적 위치를 분석하여 현재 시장 추세를 판단합니다. 가격이 구름 위에 있고 이동 평균도 구름 위에 있을 때 상승 추세로 간주하며, 반대의 경우 하락 추세로 간주합니다.
-
슈퍼트렌드(SuperTrend): 가격과 슈퍼트렌드의 상대적 위치를 분석하여 현재 시장 추세를 확인합니다. 가격이 슈퍼트렌드 위에 있을 때 상승 추세로, 반대의 경우 하락 추세로 간주합니다.
-
웨이브트렌드(WaveTrend): 웨이브트렌드 지표의 방향과 위치를 분석하여 현재 시장 추세를 판단합니다. 웨이브트렌드가 상승하고 과매수 구간에 도달하지 않았을 때 상승 추세로, 웨이브트렌드가 하락하고 과매도 구간에 도달하지 않았을 때 하락 추세로 간주합니다.
-
자금 흐름(MoneyFlow): 자금 흐름 지표의 상태를 분석하여 현재 시장 추세를 확인합니다. 자금 흐름이 양수일 때 상승 추세로, 반대의 경우 하락 추세로 간주합니다.
전략은 매수 시 가격이 구름 위에 있고, 이동 평균이 구름 위에 있으며, 슈퍼트렌드가 상승하고, 웨이브트렌드가 상승하며 과매수 구간에 도달하지 않았고, 자금 흐름이 양수여야 합니다. 매도는 반대 조건이 적용됩니다. 이러한 다중 지표, 다중 시간 프레임의 엄격한 필터링은 횡보장에서 잦은 거래를 효과적으로 방지하여 전략의 안정성과 신뢰성을 높입니다.
장점 분석
-
다중 지표 종합 판단으로 높은 신뢰성: 이 전략은 여러 기술적 지표를 종합적으로 고려하며, 이들 지표는 다양한 시장 상태에서 서로 보완되어 시장 추세를 전반적으로 반영하므로 단일 지표에서 발생할 수 있는 오류를 방지합니다.
-
엄격한 진입 조건으로 잦은 거래 방지: 전략은 여러 지표가 동시에 충족되어야 진입할 수 있는 엄격한 조건을 설정하여 횡보장에서의 잦은 거래를 효과적으로 피하고 전략의 손실을 줄입니다.
-
다중 시간 프레임 분석으로 큰 추세 파악: 전략은 여러 시간 프레임에서 분석을 수행하므로 더 큰 관점에서 시장의 주요 추세를 파악하고 단기 잡음에 흔들리지 않도록 합니다.
-
명확한 손절 전략으로 위험 통제 가능: 전략은 슈퍼트렌드를 손절 조건으로 사용하여 시장 추세가 변하면 즉시 손절하여 손실을 수용 가능한 범위 내로 제한합니다.
위험 분석
-
동적 조정 부재로 시장 변화 대응 능력 제한: 이 전략의 파라미터는 고정되어 있어 시장 상태에 따라 동적으로 조정할 능력이 부족합니다. 시장 상태에 중대한 변화가 있을 경우 전략이失效할 수 있습니다.
-
진입 조건이 너무 엄격하여 기회를 놓칠 수 있음: 전략의 진입 조건이 매우 엄격하여 잦은 거래를 피할 수는 있지만 일부 좋은 진입 기회를 놓칠 가능성이 있습니다.
-
극단적 시장 상황에 대한 적응성 미지수: 전략은 일반적인 시장 상태에서 좋은 성과를 보이지만 급격한 변동과 같은 극단적 시장 상황에 대한 적응성은 아직 검증이 필요합니다.
-
손절 전략이 상대적으로 단순하여 개선 여지 있음: 현재 전략은 슈퍼트렌드만을 손절 조건으로 사용하는데 이는 단순 명료하지만 손절 전략을 더욱 최적화하여 위험을 더 잘 통제할 여지가 있습니다.
최적화 방향
-
시장 상태 판단 도입 및 파라미터 동적 조정: 변동성 지표 등 시장 상태 판단 지표를 도입하여 시장 상태 변화에 따라 전략 파라미터를 동적으로 조정함으로써 다양한 시장 환경에 적응할 수 있습니다.
-
진입 조건 최적화로 민감도 향상: 추가 확인 지표 도입 등을 통해 진입 조건을 최적화하여 신뢰성을 유지하면서도 민감도를 높여 더 많은 거래 기회를 포착할 수 있습니다.
-
극단적 시장 대응 조치 추가: 급격한 변동과 같은 극단적 시장 상황에 대해 손절 폭을 늘리거나 거래를 일시 중단하는 등의 특별 대응 조치를 도입하여 위험을 낮출 수 있습니다.
-
손절 전략 최적화로 위험 관리 능력 향상: 시간 손절, 폭 손절 등 추가 손절 조건 도입이나 추적 손절 등 동적 손절 전략 도입을 통해 위험을 더 잘 통제할 수 있습니다.
요약
TrendHunter w/MF 다중 시간 프레임 트렌드 전략은 다중 지표, 다중 시간 프레임 분석에 기반한 트렌드 추종 전략입니다. 이 전략은 시장 구름, 이동 평균, 슈퍼트렌드, 웨이브트렌드, 자금 흐름 등의 요소를 종합적으로 고려하고 엄격한 진입 조건 설정 및 다중 시간 프레임 분석을 통해 시장의 주요 추세를 비교적 신뢰성 있게 포착하며 횡보장에서 잦은 거래를 피함으로써 우수한 안정성과 신뢰성을 제공합니다.
동시에 이 전략은 동적 조정 능력 부족, 진입 조건이 지나치게 엄격할 가능성, 극단적 시장 상황에 대한 적응성 미지수, 상대적으로 단순한 손절 전략 등 몇 가지 한계와 위험도 존재합니다. 이는 향후 이 전략이 최적화되고 개선될 수 있는 방향입니다.
전반적으로 TrendHunter w/MF 다중 시간 프레임 트렌드 전략은 좋은 잠재력을 지닌 트렌드 추종 전략입니다. 이 전략을 사용할 때 트레이더는 그 원리, 장점 및 위험을 충분히 이해하고 자신의 위험 선호도와 거래 스타일에 따라 필요한 조정과 최적화를 수행해야 합니다. 동시에 시장 상태의 변화를 면밀히 주시하고 전략을 시장 변화에 맞게 적시에 조정해야 합니다. 깊이 있는 이해와 신중한 사용을 바탕으로 이 전략은 잠재적 장점을 발휘하여 트레이더에게 안정적인 수익을 제공할 수 있습니다.
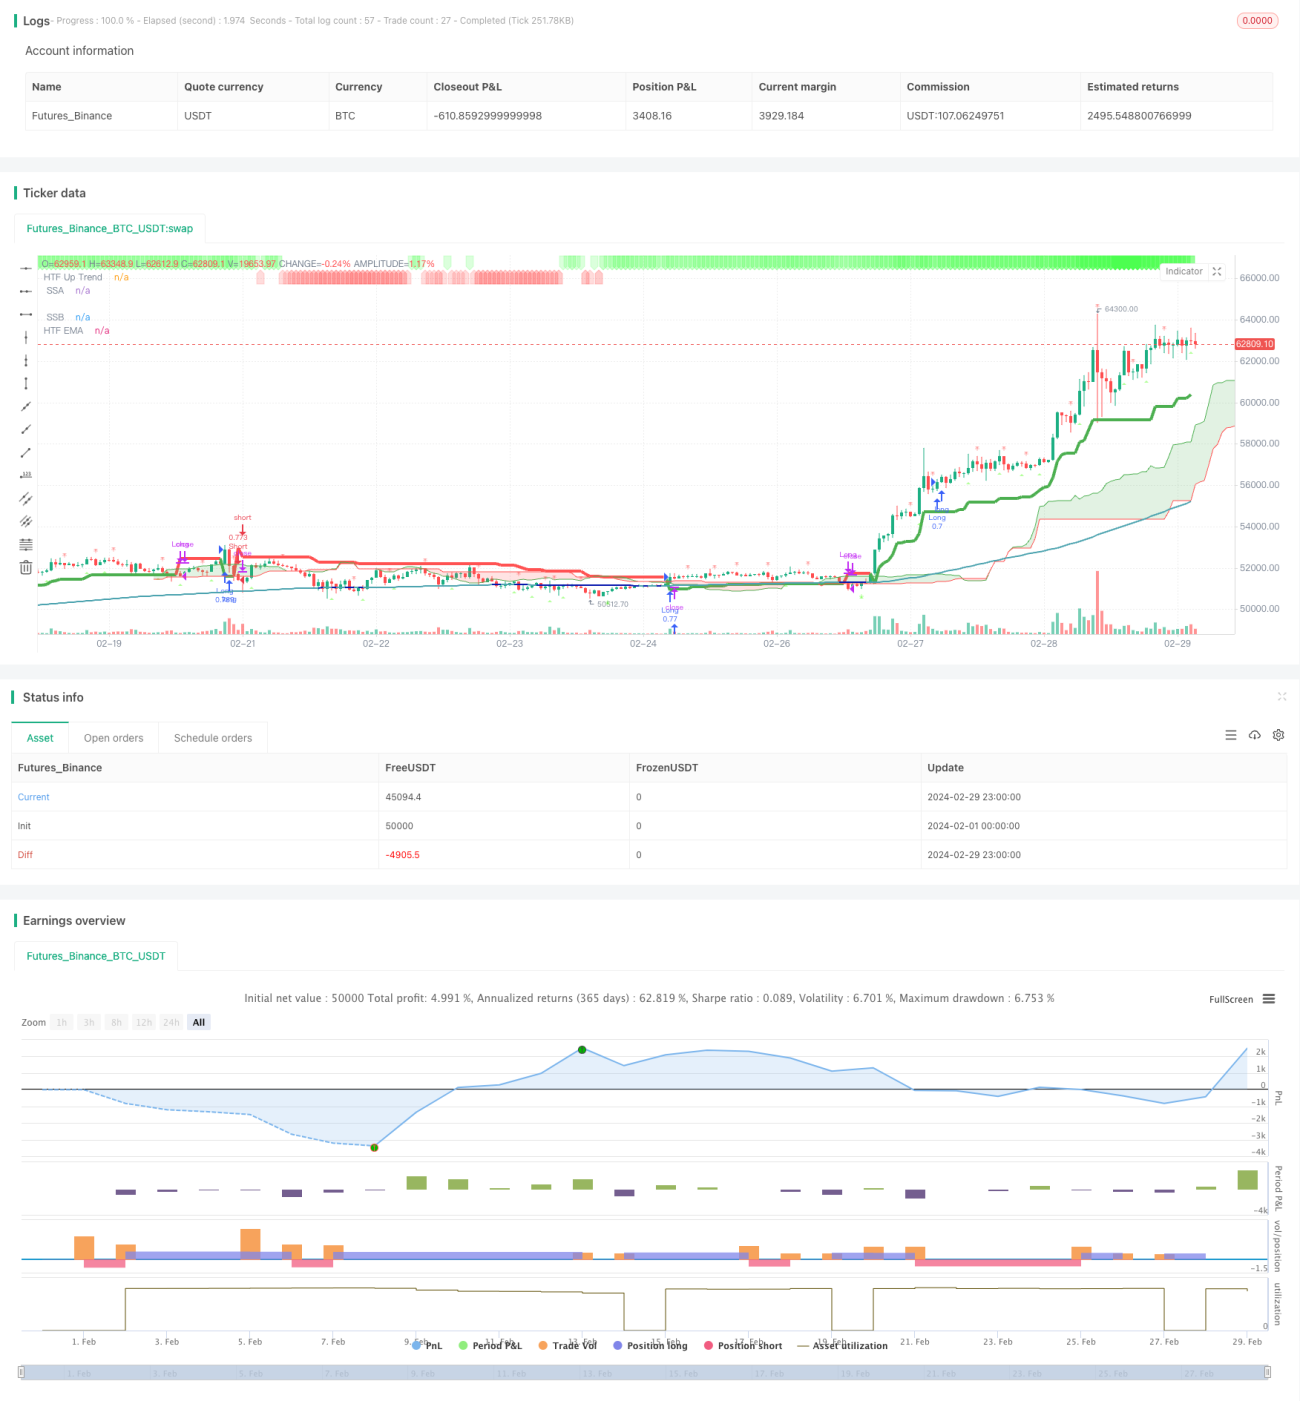
/*backtest
start: 2024-02-01 00:00:00
end: 2024-02-29 23:59:59
period: 1h
basePeriod: 15m
exchanges: [{"eid":"Futures_Binance","currency":"BTC_USDT"}]
*/

// This Pine Script™ code is subject to the terms of the Mozilla Public License 2.0 at https://mozilla.org/MPL/2.0/
// © godzcopilot / blockybears

// Thanks to anthonyf50 for his MTF Ichimoku https://www.tradingview.com/script/Pw9cBFma/- 1