전략 개요
쿠베란 전략 (Kuberan strategy) 은 카티르가 작성한 강력한 거래 전략이다. 이 전략은 다양한 분석 기술을 결합하여 독특하고 강력한 거래 방법을 형성한다. 이 전략은 부의 신인 쿠베란의 이름을 딴 것으로, 풍부한 거래자 포트폴리오의 목표를 상징한다.
쿠베란은 단순한 전략이 아니라 전체적인 거래 시스템입니다. 트렌드 분석, 동력 지표, 거래량 지표를 결합하여 높은 확률의 거래 기회를 식별합니다. 이러한 요소의 조화를 통해 쿠베란은 모든 수준의 거래자에게 적합한 명확한 입출력 신호를 제공합니다.
전략 원칙
쿠베란 전략의 핵심은 다중 지표 교차 원칙이다. 그것은 노이즈와 잘못된 신호를 줄이기 위해 서로 협력하는 독특한 지표 조합을 이용한다. 구체적으로, 이 전략은 다음과 같은 몇 가지 핵심 구성 요소를 사용합니다.
- 트렌드 방향 판단: 현재 가격을 지지점과 저항점과 비교하여 현재 트렌드 방향을 판단한다.
- 지원 저항 지점: 지그자그 지표와 축점으로 중요한 지원 및 저항 지점을 식별한다.
- 이탈 판단: 가격 움직임과 동력 지표의 비교를 통해 이탈이 발생했는지 판단하여 잠재적인 추세 반전을 촉구한다.
- 변동율 자조: ATR 지표를 통해 다른 시장 변동율에 적응하기 위해 스톱포드를 동적으로 조정한다.
- K선형 판단: 특정 K선 조합을 통해 트렌드 및 역전 신호를 확인한다.
위의 요소들을 종합적으로 고려함으로써 쿠베란 전략은 다양한 시장 환경에 적응하여 높은 확률의 거래 기회를 잡을 수 있습니다.
전략적 이점
- 다중 지표 교차: 쿠베란 전략은 여러 지표의 연동 작용을 활용하여 신호의 신뢰성을 크게 향상시키고, 노이즈 간섭을 감소시킨다.
- 자기 적응력: 동적으로 매개 변수를 조정함으로써, 이 전략은 변화하는 시장 환경에 적응할 수 있고, 실패할 수 없다.
- 명확한 신호: 쿠베란은 명확한 입출소 신호를 제공하여 거래 결정 과정을 간소화합니다.
- 안정적인 회귀: 이 전략은 엄격한 역사적 회귀를 거쳐 다양한 시장 상황에서도 안정적으로 수행되었습니다.
- 적용 범위: 쿠베란은 특정 상표에 국한되지 않고 다양한 시장과 품종에 적용됩니다.
전략적 위험
- 매개 변수 민감: 쿠베란 전략의 성능은 매개 변수 선택에 민감하며, 잘못된 매개 변수는 성능 저하로 이어질 수 있다.
- 급격한 사건: 이 전략은 주로 기술적인 신호에 기반하고, 기본적인 급격한 사건에 대한 대응 능력이 제한되어 있다.
- 과도한 적합성 위험: 변수를 최적화할 때 너무 많은 역사적 데이터를 고려하면, 전략이 지나치게 과거에 맞춰져 미래 상황에 대한 적응력이 떨어질 수 있다.
- 레버리지 위험: 너무 높은 레버리지를 사용하면, 큰 철회에 직면했을 때 포지션 폭발 위험이 있습니다.
위와 같은 위험에 대해 적절한 통제 조치를 취할 수 있습니다. 주기적으로 매개 변수를 조정하고, 합리적인 손실을 설정하고, 적당히 레버리지를 제어하고, 근본적인 변화에 주의를 기울입니다.
최적화 방향
- 기계 학습 최적화: 기계 학습 알고리즘을 도입하여 전략 매개 변수를 동적으로 최적화하여 적응력을 향상시킬 수 있습니다.
- 기본 요소를 추가하십시오: 기술적 신호의 실패에 대응하기 위해 거래 결정에 기본 분석을 포함시키는 것을 고려하십시오.
- 투자 포트폴리오 관리: 자금 관리 수준에서, 쿠베란 전략을 투자 포트폴리오에 포함할 수 있으며, 다른 전략과 효과적인 제약을 형성한다.
- 세그먼트 시장 최적화: 다양한 시장 품종에 대한 특성, 맞춤형 최적화 전략 매개 변수.
- 높은 주파수 개조: 더 많은 단선 거래 기회를 잡기 위해 전략을 높은 주파수 거래 버전으로 개조하십시오.
요약하다
쿠베란은 강력하고 안전한 거래 전략이다. 그것은 여러 가지 기술적 분석 방법을 교묘하게 결합하고, 지표 교환 원칙을 통해 추세를 포착하고 전환점을 파악하는 데 탁월하다. 어떤 전략도 위험을 피할 수 없지만, 쿠베란은 재검토에서 안정성을 입증했으며, 적절한 위험 제어 및 최적화 조치를 통해 거래자가 시장 게임에서 우위를 점하고 포트폴리오의 장기적인 안정적인 성장을 이끌어 낼 수 있다고 믿습니다.
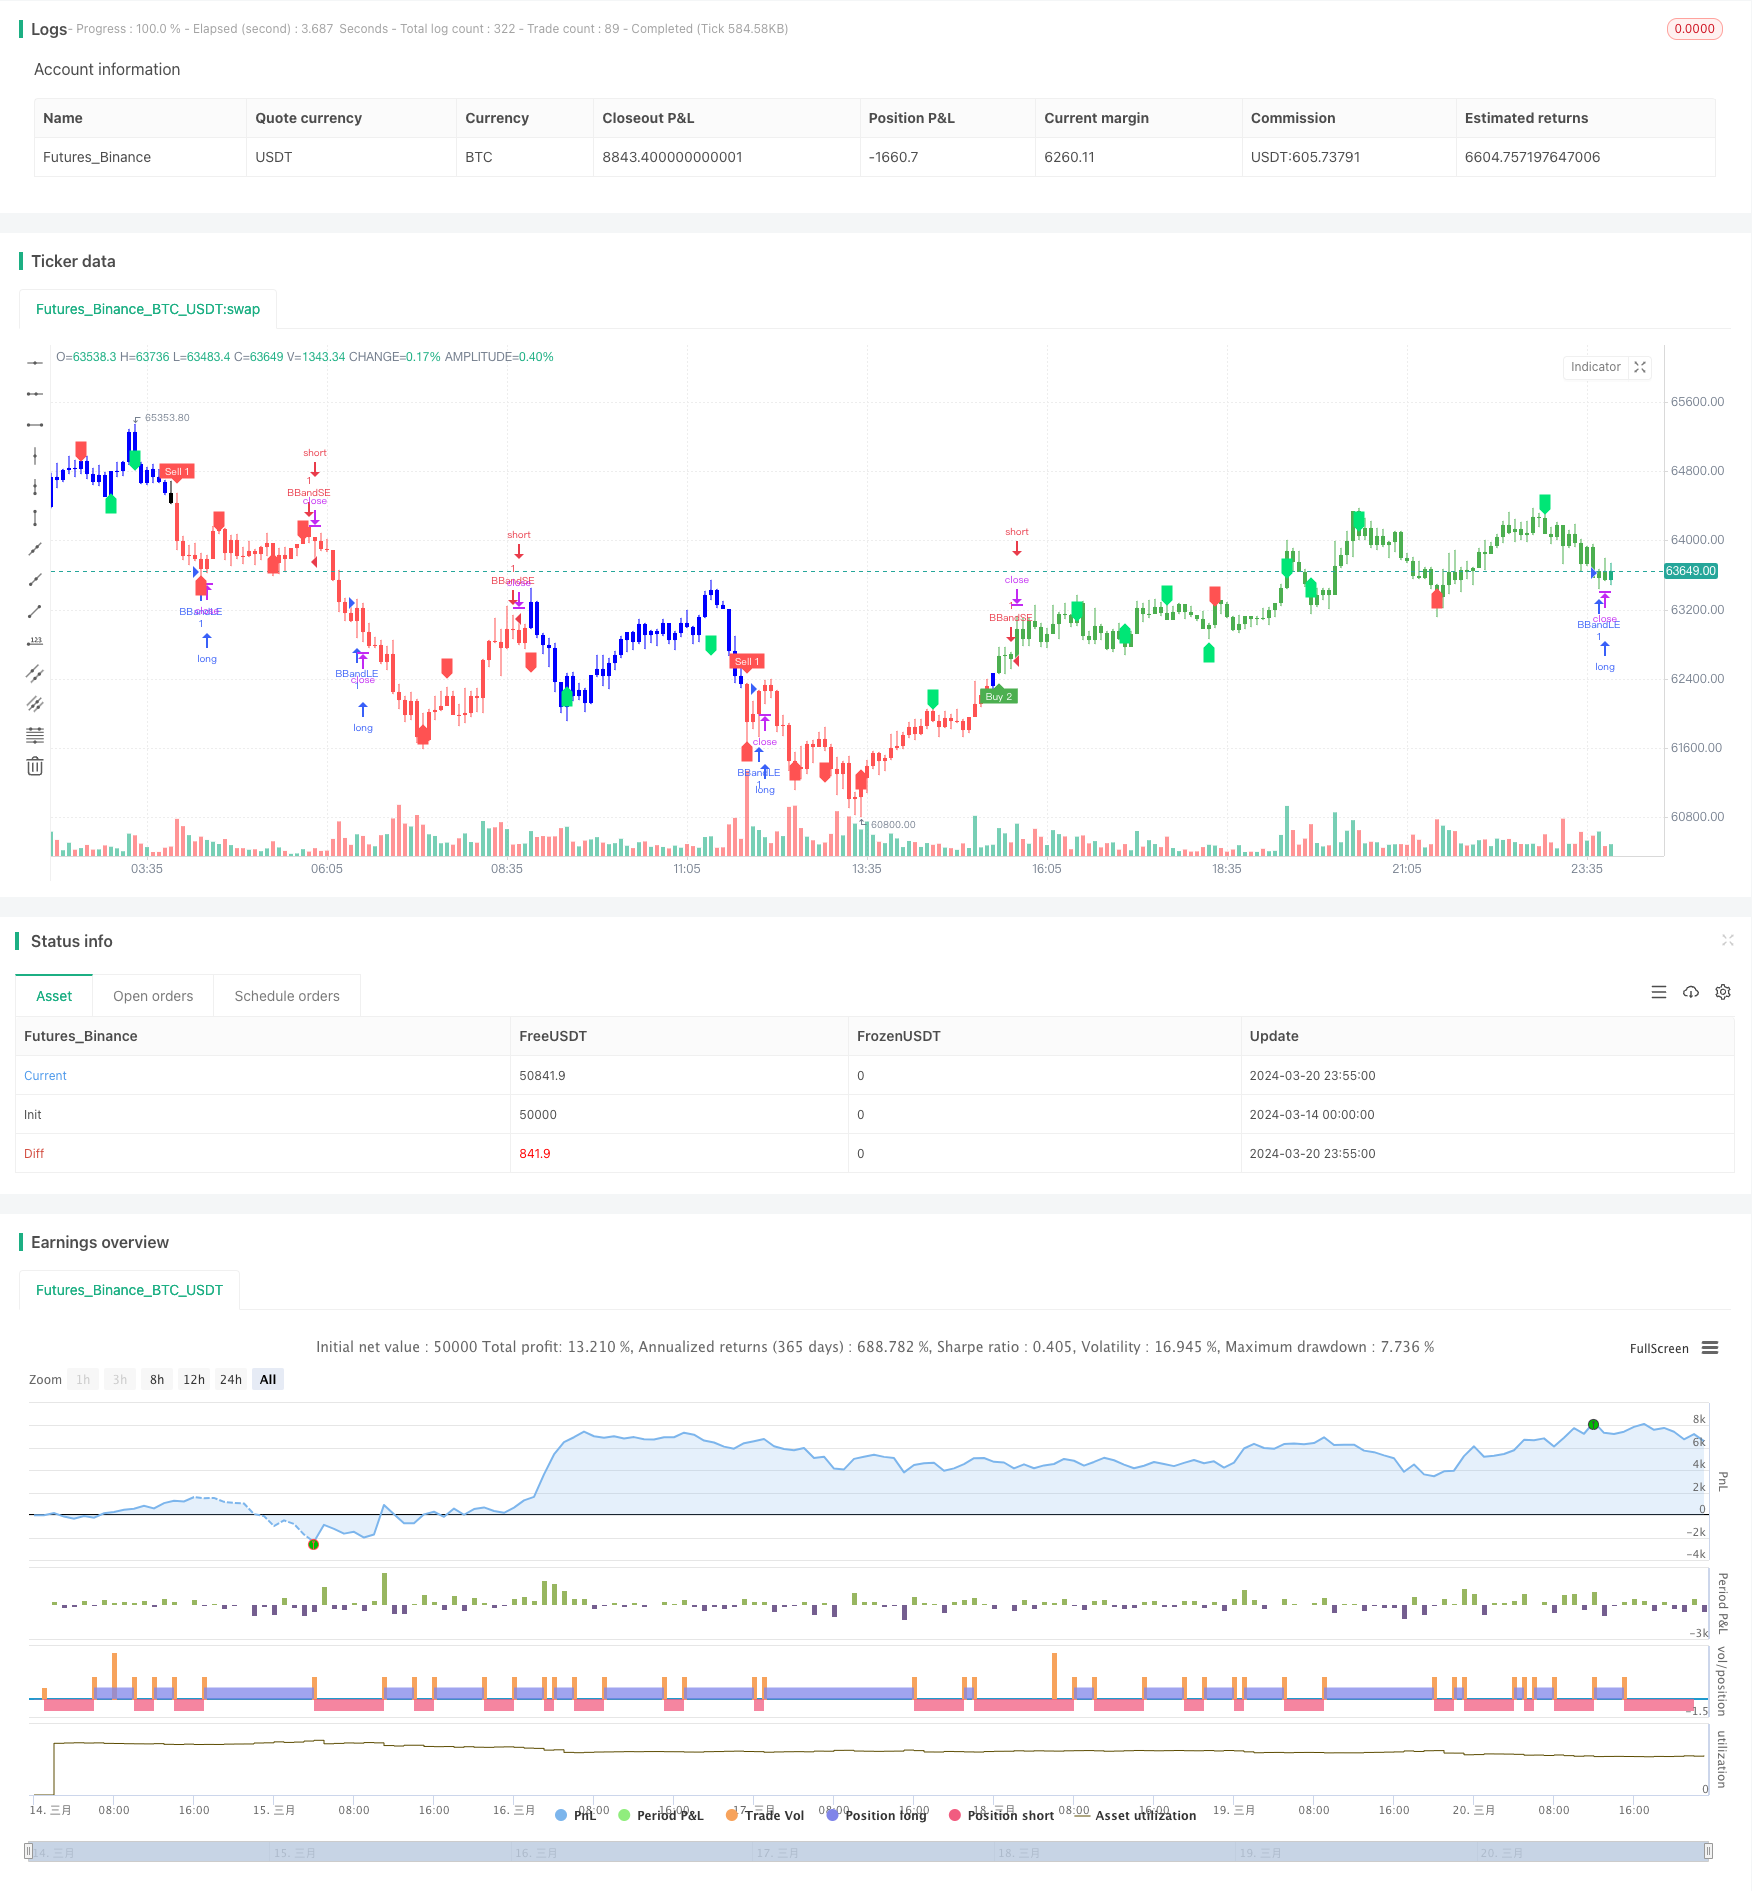
/*backtest
start: 2024-03-14 00:00:00
end: 2024-03-21 00:00:00
period: 5m
basePeriod: 1m
exchanges: [{"eid":"Futures_Binance","currency":"BTC_USDT"}]
*/

// This source code is subject to the terms of the Mozilla Public License 2.0 at https://mozilla.org/MPL/2.0/
// © LonesomeThecolor.blue
// This source code is subject to the terms of the Mozilla Public License 2.0 at https://mozilla.org/MPL/2.0/
// © LonesomeThecolor.blue

//@version=5
strategy('Kuberan*', overlay=true, max_lines_count=500)
lb = input.int(5, title='Left Bars', minval=1)
rb = input.int(5, title='Right Bars', minval=1)
showsupres = input.bool(false, title='Support/Resistance', inline='srcol')
supcol = input.color(color.lime, title='', inline='srcol')
rescol = input.color(color.red, title='', inline='srcol')
// srlinestyle = input(line.style_dotted, title='Line Style/Width', inline='style')
srlinewidth = input.int(3, title='', minval=1, maxval=5, inline='style')
changebarcol = input.bool(true, title='Change Bar Color', inline='bcol')
bcolup = input.color(color.blue, title='', inline='bcol')
bcoldn = input.color(color.black, title='', inline='bcol')

ph = ta.pivothigh(lb, rb)
pl = ta.pivotlow(lb, rb)

iff_1 = pl ? -1 : na  // Trend direction
hl = ph ? 1 : iff_1
iff_2 = pl ? pl : na  // similar to zigzag but may have multTLiple highs/lows
zz = ph ? ph : iff_2
valuewhen_1 = ta.valuewhen(hl, hl, 1)
valuewhen_2 = ta.valuewhen(zz, zz, 1)
zz := pl and hl == -1 and valuewhen_1 == -1 and pl > valuewhen_2 ? na : zz
valuewhen_3 = ta.valuewhen(hl, hl, 1)
valuewhen_4 = ta.valuewhen(zz, zz, 1)
zz := ph and hl == 1 and valuewhen_3 == 1 and ph < valuewhen_4 ? na : zz

valuewhen_5 = ta.valuewhen(hl, hl, 1)
valuewhen_6 = ta.valuewhen(zz, zz, 1)
hl := hl == -1 and valuewhen_5 == 1 and zz > valuewhen_6 ? na : hl
valuewhen_7 = ta.valuewhen(hl, hl, 1)
valuewhen_8 = ta.valuewhen(zz, zz, 1)
hl := hl == 1 and valuewhen_7 == -1 and zz < valuewhen_8 ? na : hl
zz := na(hl) ? na : zz

findprevious() =>  // finds previous three points (b, c, d, e)
    ehl = hl == 1 ? -1 : 1
    loc1 = 0.0
    loc2 = 0.0
    loc3 = 0.0
    loc4 = 0.0
    xx = 0
    for x = 1 to 1000 by 1
        if hl[x] == ehl and not na(zz[x])
            loc1 := zz[x]
            xx := x + 1
            break
    ehl := hl
    for x = xx to 1000 by 1
        if hl[x] == ehl and not na(zz[x])
            loc2 := zz[x]
            xx := x + 1
            break
    ehl := hl == 1 ? -1 : 1
    for x = xx to 1000 by 1
        if hl[x] == ehl and not na(zz[x])
            loc3 := zz[x]
            xx := x + 1
            break
    ehl := hl
    for x = xx to 1000 by 1
        if hl[x] == ehl and not na(zz[x])
            loc4 := zz[x]
            break
    [loc1, loc2, loc3, loc4]

float a = na
float b = na
float c = na
float d = na
float e = na
if not na(hl)
    [loc1, loc2, loc3, loc4] = findprevious()
    a := zz
    b := loc1
    c := loc2
    d := loc3
    e := loc4
    e

_hh = zz and a > b and a > c and c > b and c > d
_ll = zz and a < b and a < c and c < b and c < d
_hl = zz and (a >= c and b > c and b > d and d > c and d > e or a < b and a > c and b < d)
_lh = zz and (a <= c and b < c and b < d and d < c and d < e or a > b and a < c and b > d)

plotshape(_hl, title='Higher Low', style=shape.labelup, color=color.new(color.lime, 0), textcolor=color.new(color.black, 0), location=location.belowbar, offset=-rb)
plotshape(_hh, title='Higher High', style=shape.labeldown, color=color.new(color.lime, 0), textcolor=color.new(color.black, 0), location=location.abovebar, offset=-rb)
plotshape(_ll, title='Lower Low', style=shape.labelup, color=color.new(color.red, 0), textcolor=color.new(color.white, 0), location=location.belowbar, offset=-rb)
plotshape(_lh, title='Lower High', style=shape.labeldown, color=color.new(color.red, 0), textcolor=color.new(color.white, 0), location=location.abovebar, offset=-rb)

float res = na
float sup = na
res := _lh ? zz : res[1]
sup := _hl ? zz : sup[1]

int trend = na
iff_3 = close < sup ? -1 : nz(trend[1])
trend := close > res ? 1 : iff_3

res := trend == 1 and _hh or trend == -1 and _lh ? zz : res
sup := trend == 1 and _hl or trend == -1 and _ll ? zz : sup
rechange = res != res[1]
suchange = sup != sup[1]

var line resline = na
var line supline = na
if showsupres
    if rechange
        line.set_x2(resline, bar_index)
        line.set_extend(resline, extend=extend.none)
        resline := line.new(x1=bar_index - rb, y1=res, x2=bar_index, y2=res, color=rescol, extend=extend.right, style=line.style_dotted, width=srlinewidth)
        resline

    if suchange
        line.set_x2(supline, bar_index)
        line.set_extend(supline, extend=extend.none)
        supline := line.new(x1=bar_index - rb, y1=sup, x2=bar_index, y2=sup, color=supcol, extend=extend.right, style=line.style_dotted, width=srlinewidth)
        supline

iff_4 = trend == 1 ? bcolup : bcoldn
barcolor(color=changebarcol ? iff_4 : na)


// Inputs
A1 = input(5, title='Key Value. \'This changes the sensitivity\' for sell1')
C1 = input(400, title='ATR Period for sell1')
A2 = input(6, title='Key Value. \'This changes the sensitivity\' for buy2')
C2 = input(1, title='ATR Period for buy2')
h = input(false, title='Signals from Heikin Ashi Candles')

xATR1 = ta.atr(C1)
xATR2 = ta.atr(C2)
nLoss1 = A1 * xATR1
nLoss2 = A2 * xATR2

src = h ? request.security(ticker.heikinashi(syminfo.tickerid), timeframe.period, close, lookahead=barmerge.lookahead_off) : close

xATRTrailingStop1 = 0.0
iff_5 = src > nz(xATRTrailingStop1[1], 0) ? src - nLoss1 : src + nLoss1
iff_6 = src < nz(xATRTrailingStop1[1], 0) and src[1] < nz(xATRTrailingStop1[1], 0) ? math.min(nz(xATRTrailingStop1[1]), src + nLoss1) : iff_5
xATRTrailingStop1 := src > nz(xATRTrailingStop1[1], 0) and src[1] > nz(xATRTrailingStop1[1], 0) ? math.max(nz(xATRTrailingStop1[1]), src - nLoss1) : iff_6

xATRTrailingStop2 = 0.0
iff_7 = src > nz(xATRTrailingStop2[1], 0) ? src - nLoss2 : src + nLoss2
iff_8 = src < nz(xATRTrailingStop2[1], 0) and src[1] < nz(xATRTrailingStop2[1], 0) ? math.min(nz(xATRTrailingStop2[1]), src + nLoss2) : iff_7
xATRTrailingStop2 := src > nz(xATRTrailingStop2[1], 0) and src[1] > nz(xATRTrailingStop2[1], 0) ? math.max(nz(xATRTrailingStop2[1]), src - nLoss2) : iff_8

pos1 = 0
iff_9 = src[1] > nz(xATRTrailingStop1[1], 0) and src < nz(xATRTrailingStop1[1], 0) ? -1 : nz(pos1[1], 0)
pos1 := src[1] < nz(xATRTrailingStop1[1], 0) and src > nz(xATRTrailingStop1[1], 0) ? 1 : iff_9

pos2 = 0
iff_10 = src[1] > nz(xATRTrailingStop2[1], 0) and src < nz(xATRTrailingStop2[1], 0) ? -1 : nz(pos2[1], 0)
pos2 := src[1] < nz(xATRTrailingStop2[1], 0) and src > nz(xATRTrailingStop2[1], 0) ? 1 : iff_10

xcolor1 = pos1 == -1 ? color.red : pos1 == 1 ? color.green : color.blue
xcolor2 = pos2 == -1 ? color.red : pos2 == 1 ? color.green : color.blue

ema1 = ta.ema(src, 1)
ema2 = ta.ema(src, 1)
above1 = ta.crossover(ema1, xATRTrailingStop1)
below1 = ta.crossover(xATRTrailingStop1, ema1)
above2 = ta.crossover(ema2, xATRTrailingStop2)
below2 = ta.crossover(xATRTrailingStop2, ema2)

buy1 = src > xATRTrailingStop1 and above1
sell1 = src < xATRTrailingStop1 and below1
buy2 = src > xATRTrailingStop2 and above2
sell2 = src < xATRTrailingStop2 and below2

barbuy1 = src > xATRTrailingStop1
barsell1 = src < xATRTrailingStop1
barbuy2 = src > xATRTrailingStop2
barsell2 = src < xATRTrailingStop2

// plotshape(buy1, title="Buy 1", text='Buy 1', style=shape.labelup, location=location.belowbar, color=color.green, textcolor=color.white, transp=0, size=size.tiny)
plotshape(sell1, title='Sell 1', text='Sell 1', style=shape.labeldown, location=location.abovebar, color=color.new(color.red, 0), textcolor=color.new(color.white, 0), size=size.tiny)
plotshape(buy2, title='Buy 2', text='Buy 2', style=shape.labelup, location=location.belowbar, color=color.new(color.green, 0), textcolor=color.new(color.white, 0), size=size.tiny)
// plotshape(sell2, title="Sell 2", text='Sell 2', style=shape.labeldown, location=location.abovebar, color=color.red, textcolor=color.white, transp=0, size=size.tiny)

// barcolor(barbuy1 ? color.green : na)
barcolor(barsell1 ? color.red : na)
barcolor(barbuy2 ? color.green : na)
// barcolor(barsell2 ? color.red : na)

// alertcondition(buy1, "UT Long 1", "UT Long 1")
alertcondition(sell1, 'UT Short 1', 'UT Short 1')
alertcondition(buy2, 'UT Long 2', 'UT Long 2')

// strategy.entry('long', strategy.long, when=buy2)
source = close
length = input.int(20, minval=1)
mult = input.float(2.0, minval=0.001, maxval=50)
basis = ta.sma(source, length)
dev = mult * ta.stdev(source, length)
upper = basis + dev
lower = basis - dev
buyEntry = ta.crossover(source, lower)
sellEntry = ta.crossunder(source, upper)
if (ta.crossover(source, lower) )
	strategy.entry("BBandLE", strategy.long, stop=lower, oca_name="BollingerBands",  comment="BBandLE")
else
	strategy.cancel(id="BBandLE")
if (ta.crossunder(source, upper))
	strategy.entry("BBandSE", strategy.short, stop=upper, oca_name="BollingerBands",comment="BBandSE")
else
	strategy.cancel(id="BBandSE")
//plot(strategy.equity, title="equity", color=color.red, linewidth=2, style=plot.style_areabr)

lengthTL = input.int(14, 'Swing Detection Lookback')
multTL = input.float(1., 'Slope', minval = 0, step = .1)
calcMethod = input.string('Atr', 'Slope Calculation Method', options = ['Atr','Stdev','Linreg'])
backpaint = input(true, tooltip = 'Backpainting offset displayed elements in the past. Disable backpainting to see real time information returned by the indicator.')

//Style
upCss = input.color(color.teal, 'Up Trendline Color', group = 'Style')
dnCss = input.color(color.red, 'Down Trendline Color', group = 'Style')
showExt = input(true, 'Show Extended Lines')

//-----------------------------------------------------------------------------}
//Calculations
//-----------------------------------------------------------------------------{
var upperTL = 0.
var lowerTL = 0.
var slope_phTL = 0.
var slope_plTL = 0.

var offset = backpaint ? lengthTL : 0

n = bar_index
srcTL = close

phTL = ta.pivothigh(lengthTL, lengthTL)
plTL = ta.pivotlow(lengthTL, lengthTL)

//Slope Calculation Method
slope = switch calcMethod
    'Atr'    => ta.atr(lengthTL) / lengthTL * multTL
    'Stdev'  => ta.stdev(srcTL,lengthTL) / lengthTL * multTL
    'Linreg' => math.abs(ta.sma(srcTL * n, lengthTL) - ta.sma(srcTL, lengthTL) * ta.sma(n, lengthTL)) / ta.variance(n, lengthTL) / 2 * multTL

//Get slopes and calculate trendlines
slope_phTL := phTL ? slope : slope_phTL
slope_plTL := plTL ? slope : slope_plTL

upperTL := phTL ? phTL : upperTL - slope_phTL
lowerTL := pl ? pl : lowerTL + slope_plTL

var upos = 0
var dnos = 0
upos := phTL ? 0 : close > upperTL - slope_phTL * lengthTL ? 1 : upos
dnos := pl ? 0 : close < lowerTL + slope_plTL * lengthTL ? 1 : dnos