TrippleMACD 이동평균 교차와 상대강도지수를 결합한 고빈도 암호화폐 거래 전략

개요
이 글은 TripleMACD 평균선 교차와 상대적으로 약한 지표 ((RSI)) 를 결합한 고주파 암호화폐 거래 전략에 대해 소개한다. 이 전략은 3개의 서로 다른 파라미터의 MACD 지표를 이용하고, 그들의 신호선을 평균화하며, RSI 지표와 결합하여 최적의 구매 및 판매 시점을 결정한다. 이 전략은 1분 시간 프레임의 자동 거래로 설계되어, 다중 거래만을 고려한다. 이 전략은 또한 선형 회귀를 사용하여 시장의 전체 수면 단계를 식별하고, 흔들림 상태에서 거래를 피한다.
전략 원칙
이 전략의 핵심은 3개의 다른 매커니즘의 MACD 지표를 사용하여 다른 시간 단위의 트렌드 신호를 포착하는 것입니다. 3개의 다른 매커니즘의 MACD 지표의 신호선을 평균으로 계산하면 잡음을 효과적으로 완화하고 더 신뢰할 수있는 거래 신호를 제공합니다. 동시에 RSI 지표는 다중 트렌드의 강도를 확인하는 데 사용됩니다.
또한, 이 전략은 선형 회귀를 사용하여 시장의 평준화 단계를 식별한다. <unk> 그래프 상의 하향 그림선과 엔티티의 비율을 계산하여 현재 시장이 평준화 상태에 있는지 판단할 수 있다. 상하향 그림선의 길이가 엔티티의 길이의 두 배 이상이라면 시장이 평준화 단계에 있다고 간주되며, 이 전략은 거래를 피한다.
우위 분석
-
다중 시간 스케일 분석: 이 전략은 세 개의 다른 매개 변수의 MACD 지표를 사용하여 다양한 시간 스케일의 트렌드 신호를 포착하여 거래의 정확성과 신뢰성을 향상시킵니다.
-
신호 평준화: 세 개의 MACD 지표의 신호선을 평균하여 잡음을 효과적으로 평준화하여 단일 지표가 생성 할 수있는 잘못된 신호를 피할 수 있습니다.
-
트렌드 확인: RSI 지표와 결합하여 다목적 트렌드의 강도를 확인하면 거래 신호의 신뢰성을 더욱 높일 수 있습니다.
-
정렬 식별: 선형 회귀를 사용하여 시장의 정렬 단계를 식별하여 불안정한 상황에서 거래를 피하고 전략의 위험을 줄일 수 있습니다.
-
자동화 거래: 이 전략은 1분 시간 프레임에 대한 자동화 거래를 위해 설계되었으며, 시장의 변화에 신속하게 반응하고 거래를 수행하여 거래 효율성을 높일 수 있습니다.
위험 분석
-
변수 최적화: 이 전략은 3개의 MACD 지표의 빠른 느린 선주기, RSI 지표의 주기 등과 같은 여러 변수를 포함합니다. 이러한 변수 선택은 전략 성능에 중요한 영향을 미치며, 변수 최적화가 적절하지 않으면 전략 성능이 떨어질 수 있습니다.
-
과도한 적합성 위험: 이 전략은 특정 역사적 데이터에 대해 잘 수행 할 수 있지만 실제 적용에서 시장 변화에 적응하지 못할 수 있으며, 전략의 실패로 이어질 수 있습니다.
-
검은 천둥 사건: 이 전략은 주로 기술적 지표에 기반하고, 몇몇 중요한 기본적 사건에 대한 반응이 부족할 수 있으며, 이는 극단적인 시장 환경에서 전략이 좋지 않은 결과를 초래할 수 있다.
최적화 방향
-
동적 변수 조정: 시장 상태의 변화에 따라, MACD 지표의 빠른 느린 선 주기, RSI 지표의 주기 등 전략의 각 변수를 동적으로 조정하여 다른 시장 환경에 적응합니다.
-
더 많은 지표를 추가: 기존의 MACD 및 RSI 지표를 기반으로, 거래 신호의 정확성과 신뢰성을 더욱 높이기 위해 브린 밴드, 이동 평균 등과 같은 다른 기술 지표를 추가하는 것이 고려 될 수 있습니다.
-
위험 관리 최적화: 전략에 더 나은 위험 관리 조치를 추가하여 전략의 전반적인 위험을 낮추기 위해 동적 중단, 포지션 관리 등
-
기계 학습 최적화: 신경 네트워크, 지원 벡터 기계 등과 같은 기계 학습 알고리즘을 사용하여 전략의 매개 변수 및 거래 규칙을 최적화하여 전략의 적응성과 안정성을 향상시킵니다.
요약하다
이 글은 TripleMACD 평행선 교차와 RSI 지표가 결합된 HFT 암호화폐 거래 전략에 대해 소개한다. 이 전략은 3개의 서로 다른 파라미터의 MACD 지표와 RSI 지표를 사용하여 신뢰할 수 있는 거래 신호를 생성하고, 선형 회귀를 사용하여 시장의 평형 단계를 식별하여 불안정한 상황에서 거래를 피한다. 이 전략의 장점은 다중 시간 단위의 신호 분석, 평형화, 트렌드 확인, 평형화, 인식 및 자동화 거래 등의 측면에 있다. 그러나 파라미터 최적화, 과조합 및 블랙 천둥 사건과 같은 위험도 존재한다.
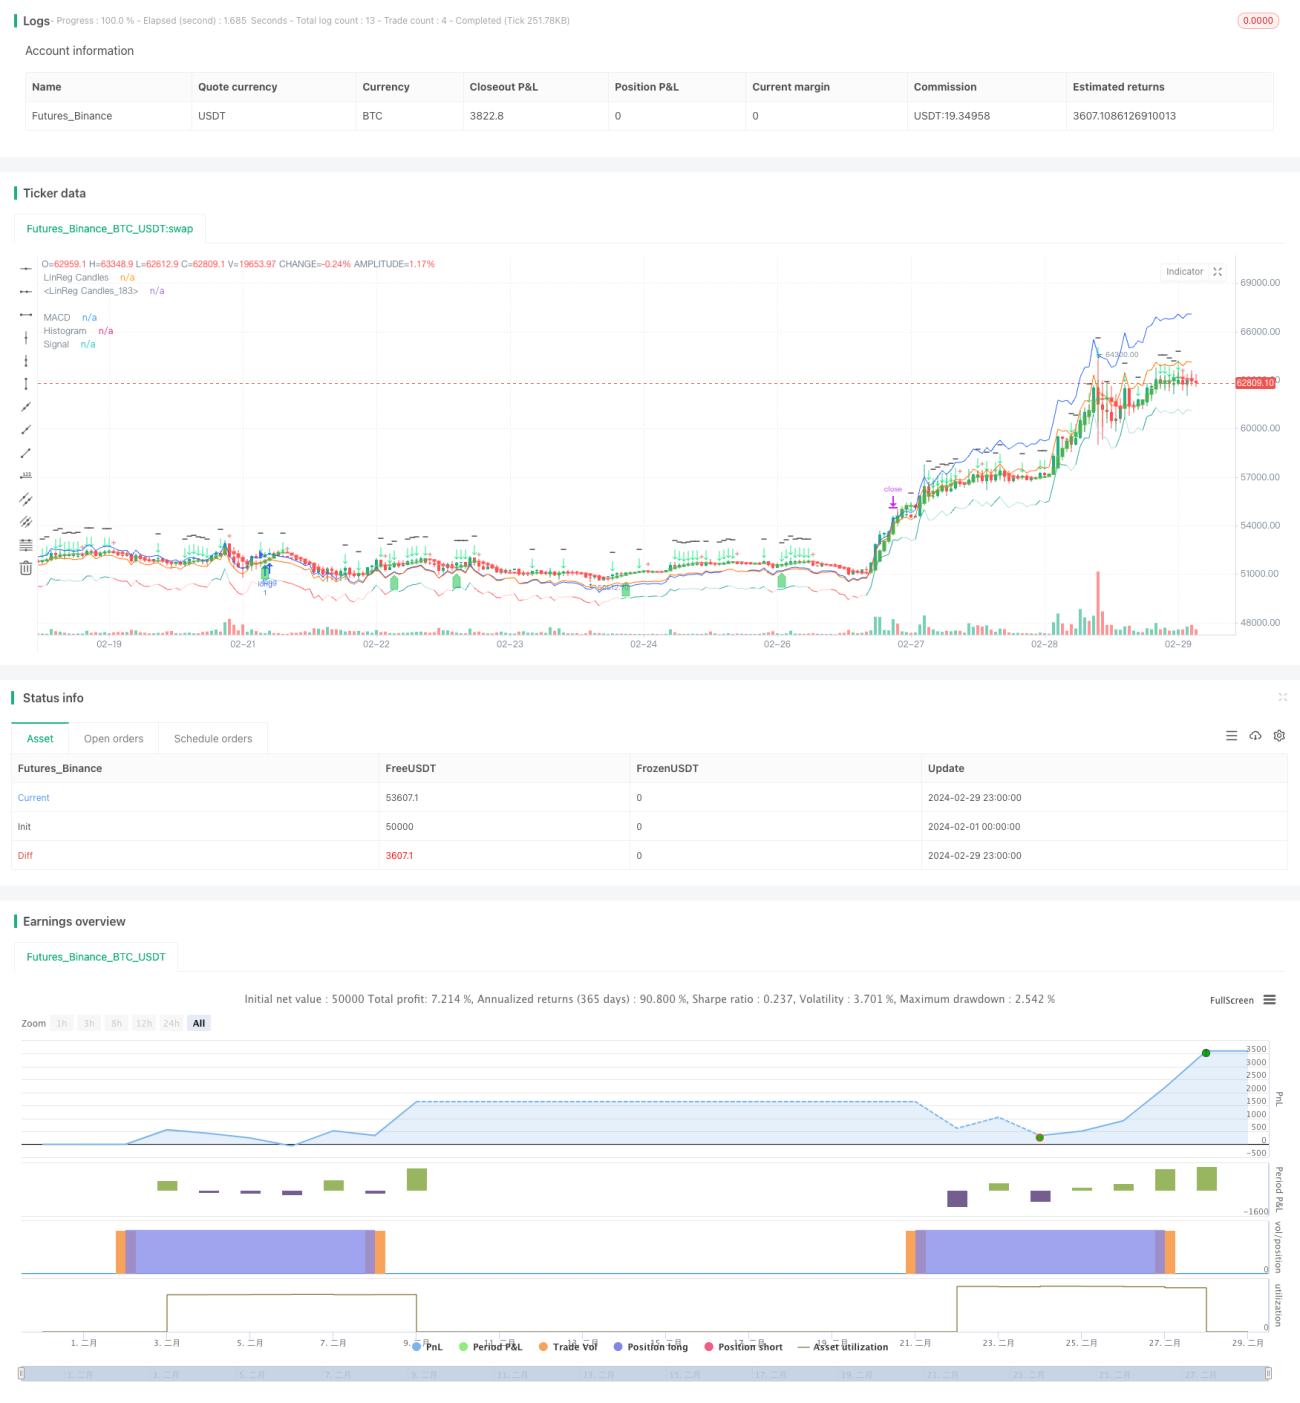
/*backtest
start: 2024-02-01 00:00:00
end: 2024-02-29 23:59:59
period: 1h
basePeriod: 15m
exchanges: [{"eid":"Futures_Binance","currency":"BTC_USDT"}]
*/

//@version=5
//indicator("Triplle",shorttitle="Triplle MACD", overlay=true, scale = scale.none)
//indicator("Triplle","TrippleMACD",true)
strategy(title="TrippleMACD", shorttitle="TrippleMACD + RSI strategy", format=format.price, precision=4, overlay=true)- 1