개요
다중공선선적 교차전략 (多空線性交叉策略) 은 기술분석의 전략으로, 선형적 회귀모형에 기초하여 주식의 미래 가격 움직임을 예측한다. 전략의 기본원리는: 주식 가격 움직임은 일정한 선형적 추세를 따르는 경향이 있으며, 가격의 선형적 회귀를 계산함으로써 미래 가격을 예측할 수 있다. 예측된 가격 위에 현재의 가격을 부수할 때 더 많이 하고, 아래에 평점을 부수할 때 더 많이 한다.
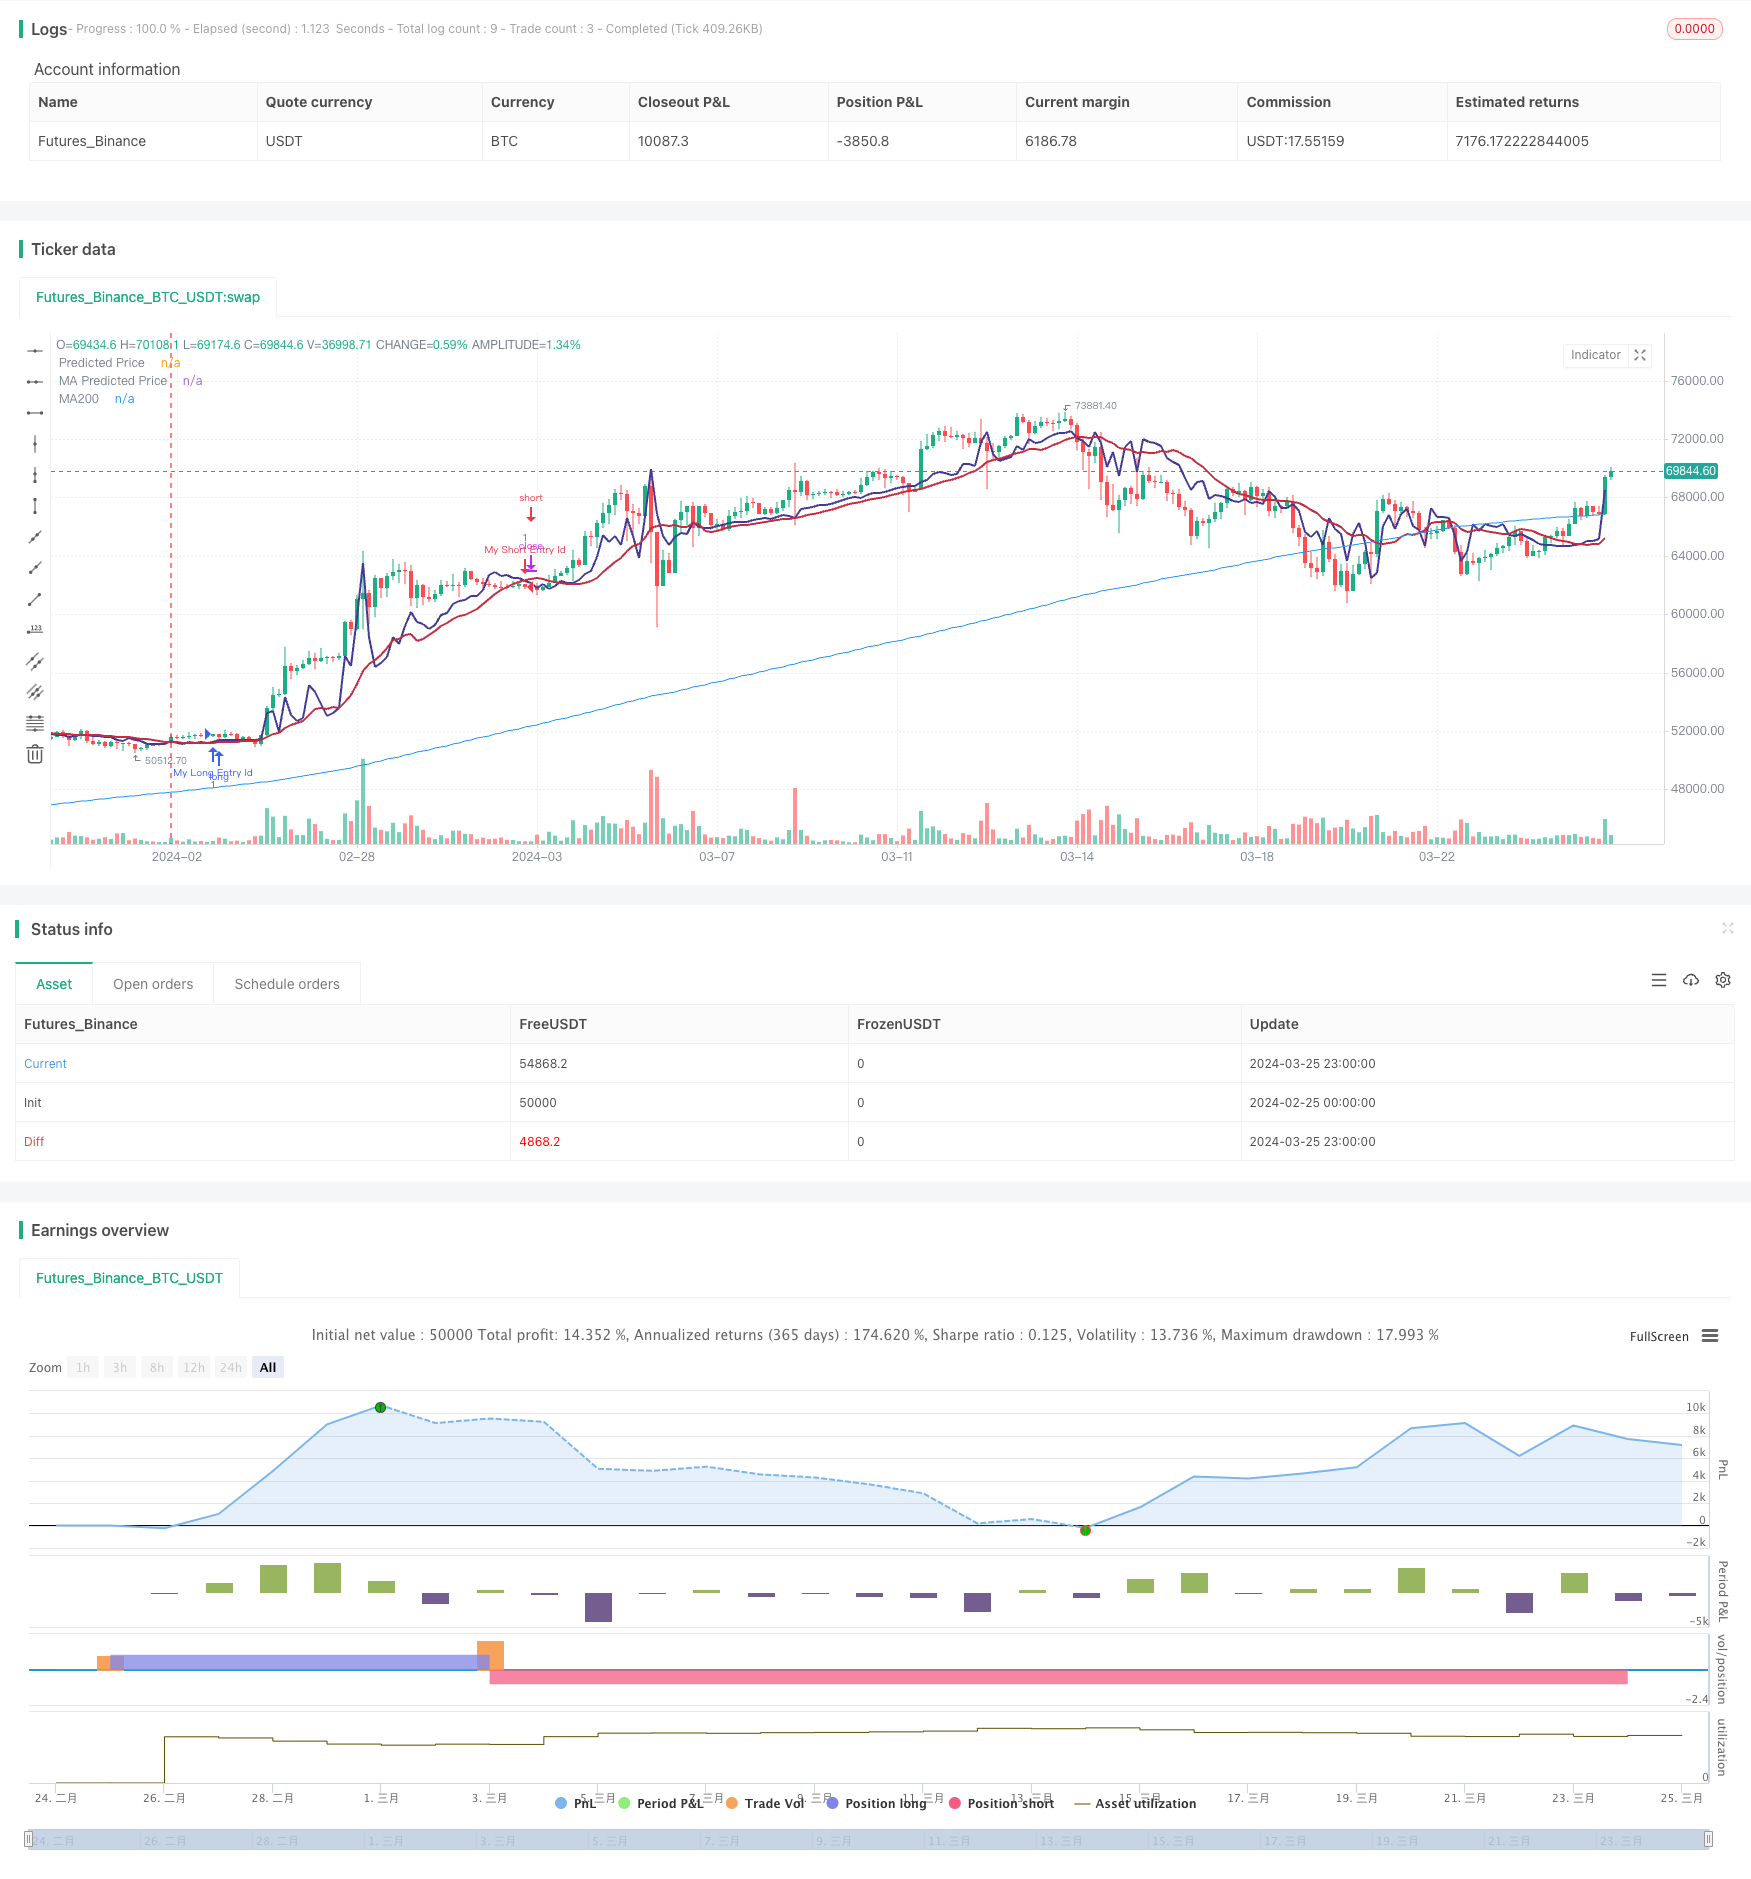
전략 원칙
이 전략은 먼저 일정 기간 동안 주식 가격의 선형 회귀를 계산한다. 선형 회귀는 최소의 두 배수를 사용하여 직선을 모음하여 시간의 흐름에 따라 가격의 변화를 나타냅니다. 전략은 예측된 가격선과 현재 가격을 차트에 그려낸다.
정책은 두 가지 신호를 정의합니다.
- 다중 신호: 예측된 가격이 현재 가격에 부딪히면 발동
- 공백 신호: 예측된 가격이 현재 가격을 넘어갈 때 트리거
더 많은 신호가 나타나면 더 많은 포지션을 열고, 더 적은 신호가 나타나면 평소합니다.
전략의 핵심 단계는 다음과 같습니다.
- 한 시간 동안의 가격의 선형 회귀를 계산합니다.
- 예상 가격 라인과 현재 가격을 도표에 그려보세요.
- 더하고 공백 신호를 정의
- 이 신호가 터지면 더 많은 돈을 벌 수 있습니다.
- 공백 신호가 발동되면 평지
우위 분석
다중공선선적 교차 전략은 다음과 같은 장점이 있다:
- 간단하고 효과적입니다. 이 전략의 논리는 명확하고, 실행하기 쉽고, 가격의 선형적 추세를 포착할 수 있습니다.
- 이 전략은 트렌드 상황과 격동 상황 모두에서 거래 신호를 생성할 수 있다.
- 최적화성: 전략에는 선형 회귀 주기, 이동 평균 등과 같은 몇 가지 핵심 매개 변수가 포함되어 있습니다. 이러한 매개 변수를 최적화함으로써 전략 성능을 향상시킬 수 있습니다.
위험 분석
다중공선선교차 전략은 장점이 많지만 위험도 있습니다.
- 트렌드 식별 위험: 가격 움직임이 선형적 추세를 따르지 않을 때, 예를 들어, 충격적인 행태에서, 전략은 잘못된 신호를 일으킬 수 있다. MACD와 같은 다른 지표와 결합하여 위험을 줄일 수 있다.
- 매개 변수 설정 위험: 전략 성능은 매개 변수 설정에 민감하며, 부적절한 매개 변수는 손실을 초래할 수 있다. 따라서 실전 이전에 매개 변수를 충분히 재검토하고 최적화해야 한다.
- 지나친 적합성 위험: 매개 변수를 지나치게 최적화하면, 전략이 역사적 데이터를 지나치게 적합하게 만들 수 있으며, 향후에는 좋지 않은 성과를 낼 수 있다. 지나친 적합성을 피하는 방법은 단순하게 유지, 데이터 세트 외부 테스트 등이다.
최적화 방향
- 다른 지표와 결합: 선형 회귀 신호는 MACD, 브린 밴드 등과 같은 다른 기술 지표와 결합하여 신호의 정확도를 향상시킬 수 있다.
- 동적 파라미터 최적화: 시장 상황에 따라 동적으로 파라미터를 조정하여 적응력을 높이기 위해 매개 변수 자조 메커니즘을 설계할 수 있다.
- 리스크 컨트롤 모듈을 추가: 전략에 중지 손실, 자금 관리와 같은 리스크 컨트롤 조치를 추가하여 단일 거래 위험을 줄이고 누적 수익을 향상시킵니다.
- 기계 학습 최적화: 기계 학습 알고리즘을 사용하여 선형 회귀 모델을 지속적으로 최적화하여 예측을 더 정확하게 할 수 있습니다.
요약하다
다공선선적 교차전략은 가격의 선형 회귀를 기반으로 가격과 현재 가격을 비교하여 거래 신호를 생성한다. 이 전략의 논리는 간단하고 명확하며, 가격의 선형 추세를 포착할 수 있으며, 다양한 상황에 적합하다. 동시에, 전략은 구현 및 최적화하기 쉬우며, 파라미터를 유연하게 조정할 수 있으며, 다른 지표와 결합하여 위험 제어 모듈을 추가하여 전략 성능을 지속적으로 향상시킬 수 있다. 그러나 전략에는 추세를 식별하는 부정확성, 파라미터 설정 부적절함, 역사 데이터의 과합 위험 등이 존재하며, 실제 사용 시 주의가 필요하다.
/*backtest
start: 2024-02-25 00:00:00
end: 2024-03-26 00:00:00
period: 3h
basePeriod: 15m
exchanges: [{"eid":"Futures_Binance","currency":"BTC_USDT"}]
*/

// This source code is subject to the terms of the Mozilla Public License 2.0 at https://mozilla.org/MPL/2.0/
// © stocktechbot
//@version=5
strategy("Linear Cross", overlay=true, margin_long=100, margin_short=0)

//Linear Regression

vol = volume

// Function to calculate linear regression
linregs(y, x, len) =>
    ybar = math.sum(y, len)/len
    xbar = math.sum(x, len)/len
    b = math.sum((x - xbar)*(y - ybar),len)/math.sum((x - xbar)*(x - xbar),len)
    a = ybar - b*xbar
    [a, b]

// Historical stock price data
price = close

// Length of linear regression
len = input(defval = 21, title = 'Strategy Length')
linearlen=input(defval = 9, title = 'Linear Lookback')
[a, b] = linregs(price, vol, len)

// Calculate linear regression for stock price based on volume
//eps = request.earnings(syminfo.ticker, earnings.actual)
//MA For double confirmation

out = ta.sma(close, 200)
outf = ta.sma(close, 50)
outn = ta.sma(close, 90)
outt = ta.sma(close, 21)
outthree = ta.sma(close, 9)

// Predicted stock price based on volume
predicted_price = a + b*vol

// Check if predicted price is between open and close
is_between = open < predicted_price and predicted_price < close

//MACD
//[macdLine, signalLine, histLine] = ta.macd(close, 12, 26, 9)

// Plot predicted stock price
plot(predicted_price, color=color.rgb(65, 59, 150), linewidth=2, title="Predicted Price")
plot(ta.sma(predicted_price,linearlen), color=color.rgb(199, 43, 64), linewidth=2, title="MA Predicted Price")
//offset = input.int(title="Offset", defval=0, minval=-500, maxval=500)
plot(out, color=color.blue, title="MA200")
[macdLine, signalLine, histLine] = ta.macd(predicted_price, 12, 26, 9)

//BUY Signal

longCondition=false
mafentry =ta.sma(close, 50) > ta.sma(close, 90)
//matentry = ta.sma(close, 21) > ta.sma(close, 50)
matwohun = close > ta.sma(close, 200)
twohunraise = ta.rising(out, 2)
twentyrise = ta.rising(outt, 2)
macdrise = ta.rising(macdLine,2)
macdlong = ta.crossover(predicted_price, ta.wma(predicted_price,linearlen))  and (signalLine < macdLine)
if macdlong and macdrise
    longCondition := true

if (longCondition)
    strategy.entry("My Long Entry Id", strategy.long)
//Sell Signal
lastEntryPrice = strategy.opentrades.entry_price(strategy.opentrades - 1)
daysSinceEntry = len
daysSinceEntry := int((time - strategy.opentrades.entry_time(strategy.opentrades - 1)) / (24 * 60 * 60 * 1000))
percentageChange = (close - lastEntryPrice) / lastEntryPrice * 100
//trailChange = (ta.highest(close,daysSinceEntry) - close) / close * 100

//label.new(bar_index, high, color=color.black, textcolor=color.white,text=str.tostring(int(trailChange)))
shortCondition=false
mafexit =ta.sma(close, 50) < ta.sma(close, 90)
matexit = ta.sma(close, 21) < ta.sma(close, 50)
matwohund = close < ta.sma(close, 200)
twohunfall = ta.falling(out, 3)
twentyfall = ta.falling(outt, 2)
shortmafall = ta.falling(outthree, 1)
macdfall = ta.falling(macdLine,1)
macdsell = macdLine < signalLine
if macdfall and macdsell and (macdLine < signalLine) and ta.falling(low,2)
    shortCondition := true

if (shortCondition)
    strategy.entry("My Short Entry Id", strategy.short)