그리드 트레이딩 위험 헤지 전략

전략 개요
격자 거래 위험 보호 전략은 격자 거래 개념에 기반하여 위험 보호 아이디어와 결합 된 양적 거래 전략입니다. 이 전략은 미리 설정된 가격 범위 내에서 여러 개의 구매 주문을 배치하여 가격 변동에서 이익을 얻습니다. 또한 이 전략은 위험 보호 장치를 도입하여 격자 경계를 동적으로 조정하여 시장 환경에 적응하여 전략 위험을 줄입니다.
전략 원칙
이 전략의 핵심 원칙은 격자 거래이다. 첫째, 사용자 설정한 파라미터에 따라 격자의 상하 경계와 격자 라인의 수를 결정한다. 그 다음, 격자 라인에 매매 주문을 배치한다: 가격이 격자 라인에 닿을 때, 그 격자 라인 이전에 주문이 없다면, 포지션을 열고, 그 전에 주문이 있다면, 평소한다.
동시에, 위험을 줄이기 위해, 이 전략은 동적 격자 경계 조정 메커니즘을 도입한다. 사용자의 선택에 따라, 격자의 상하 경계는 두 가지 방법으로 자동으로 조정할 수 있다: 1) 최근 기간의 최고 가격과 최저 가격에 따라, 사용자 설정의 편차를 고려하고; 2) 이동 평균에 따라, 사용자 설정의 편차를 고려하고. 격자 경계를 동적으로 조정함으로써, 격자가 항상 현재 가격을 중심으로 유지될 수 있으므로, 가격의 격자 경계를 돌파하는 위험을 줄일 수 있다.
또한, 이 전략은 포지션을 열 때 총 자본을 N 부분으로 나누고, 포지션을 열 때마다 동등한 자본을 사용함으로써 단일 거래의 위험을 줄일 수 있다.
우위 분석
-
적응력: 격자 경계를 동적으로 조정함으로써 전략은 다른 시장 환경에 적응할 수 있으며, 추세나 변동적인 상황이라면 자동으로 조정하여 더 나은 수익을 얻을 수 있습니다.
-
위험 제어: 전략은 포지션을 개시할 때 동등한 자금을 사용하며, 단일 거래의 위험은 낮습니다. 동시에, 동적 격자 경계 조정 메커니즘은 가격의 격자 경계를 뚫는 위험을 낮출 수 있습니다.
-
거래 빈도가 높다: 격자는 일반적으로 더 많은 주문을 배치하기 때문에 거래 빈도가 높고, 변동적인 상황에서 더 쉽게 수익을 얻는다.
-
매개 변수 유연성: 사용자는 자신의 취향에 따라 격자 수, 상하 경계, 동적으로 조정되는 매개 변수 등을 설정하여 다른 거래 스타일에 적응할 수 있다.
위험 분석
-
트렌드 상황에서의 부실한 성능: 가격이 지속적으로 단방향으로 상승하거나 하락하여 격자 경계를 돌파하고 동적 조정이 가격 변화의 속도를 따라가지 못하면 전략은 큰 위험에 처할 수 있습니다.
-
수수료: 전략 거래의 빈도가 높기 때문에 수수료가 수익에 영향을 미칠 수 있습니다.
-
매개 변수 설정 잘못: 매개 변수 설정이 잘못되면, 예를 들어 격자 수가 너무 많거나 격자 경계 설정이 부적절한 경우, 정책의 성능이 좋지 않을 수 있습니다.
해결 방법: 1) 트렌드 상황에서, 확대 격자 경계 조정 폭을 고려하거나, 트렌드 전략과 결합할 수 있다. 2) 수수료가 낮은 거래소와 동전을 선택한다. 3) 실제 실행 전에, 파라미터를 충분히 재검토하고 최적화해야 한다.
최적화 방향
-
다른 전략과 결합: 격자 거래 전략을 다른 유형의 전략과 결합하는 것을 고려할 수 있습니다. 트렌드 전략, 평균 회귀 전략 등이 전략의 적응성과 안정성을 향상시킵니다.
-
역동적 조정 메커니즘을 개선: 현재 전략의 역동적 조정 메커니즘은 비교적 간단하며, 더 많은 요소를 고려하여 더 고급 알고리즘을 적용하여 더 많은 요소를 고려하여 더 많은 요소를 고려할 수 있습니다.
-
최적화 자금 관리: 현재 전략은 동등한 자금 관리를 채택하고 있으며, 더 높은 자금 관리 방법을 도입하는 것이 고려 될 수 있습니다.
-
스톱 스톱의 도입: 격자 거래의 기초에 따라, 이동 스톱 스톱, 변동률 스톱 스톱 스톱 등과 같은 스톱 스톱의 논리를 도입하여 전략 위험을 더욱 줄일 수 있습니다.
요약하다
격자 거래 위험 보호 전략은 자동화, 적응성 강하고 위험 제어 가능한 양자 거래 전략이다. 격자 거래와 동적 격자 조정으로 전략은 다양한 상황에서 수익을 올릴 수 있으며 위험을 통제 할 수 있다. 그러나 전략은 추세 상황에서 성능이 좋지 않을 수 있으며 수수료는 수익에 영향을 미칠 수 있으므로 실제 응용에서는 추가적인 최적화와 개선이 필요합니다.
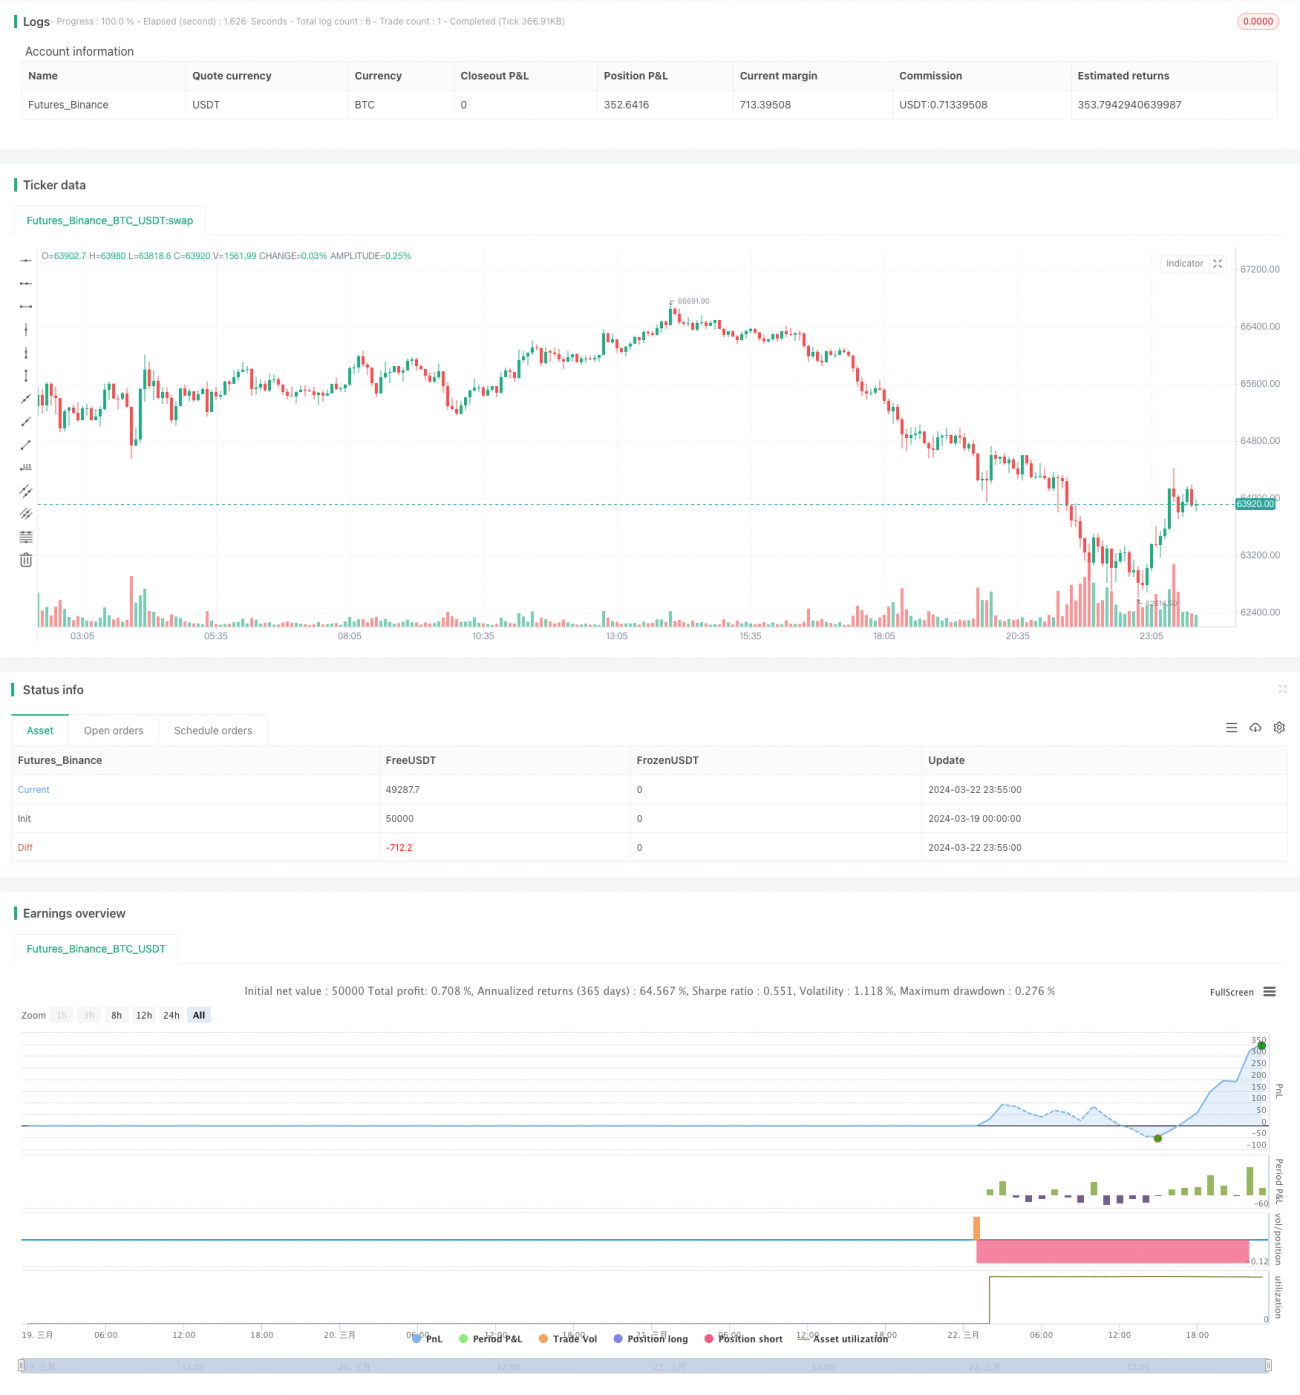
/*backtest
start: 2024-03-19 00:00:00
end: 2024-03-23 00:00:00
period: 5m
basePeriod: 1m
exchanges: [{"eid":"Futures_Binance","currency":"BTC_USDT"}]
*/

//@version=4
strategy("(IK) Grid Script", overlay=true, pyramiding=14, close_entries_rule="ANY", default_qty_type=strategy.cash, initial_capital=100.0, currency="USD", commission_type=strategy.commission.percent, commission_value=0.1)
i_autoBounds    = input(group="Grid Bounds", title="Use Auto Bounds?", defval=true, type=input.bool)                             // calculate upper and lower bound of the grid automatically? This will theorhetically be less profitable, but will certainly require less attention
i_boundSrc = input(group="Grid Bounds", title="(Auto) Bound Source", defval="Hi & Low", options=["Hi & Low", "Average"]) // should bounds of the auto grid be calculated from recent High & Low, or from a Simple Moving Average- 1