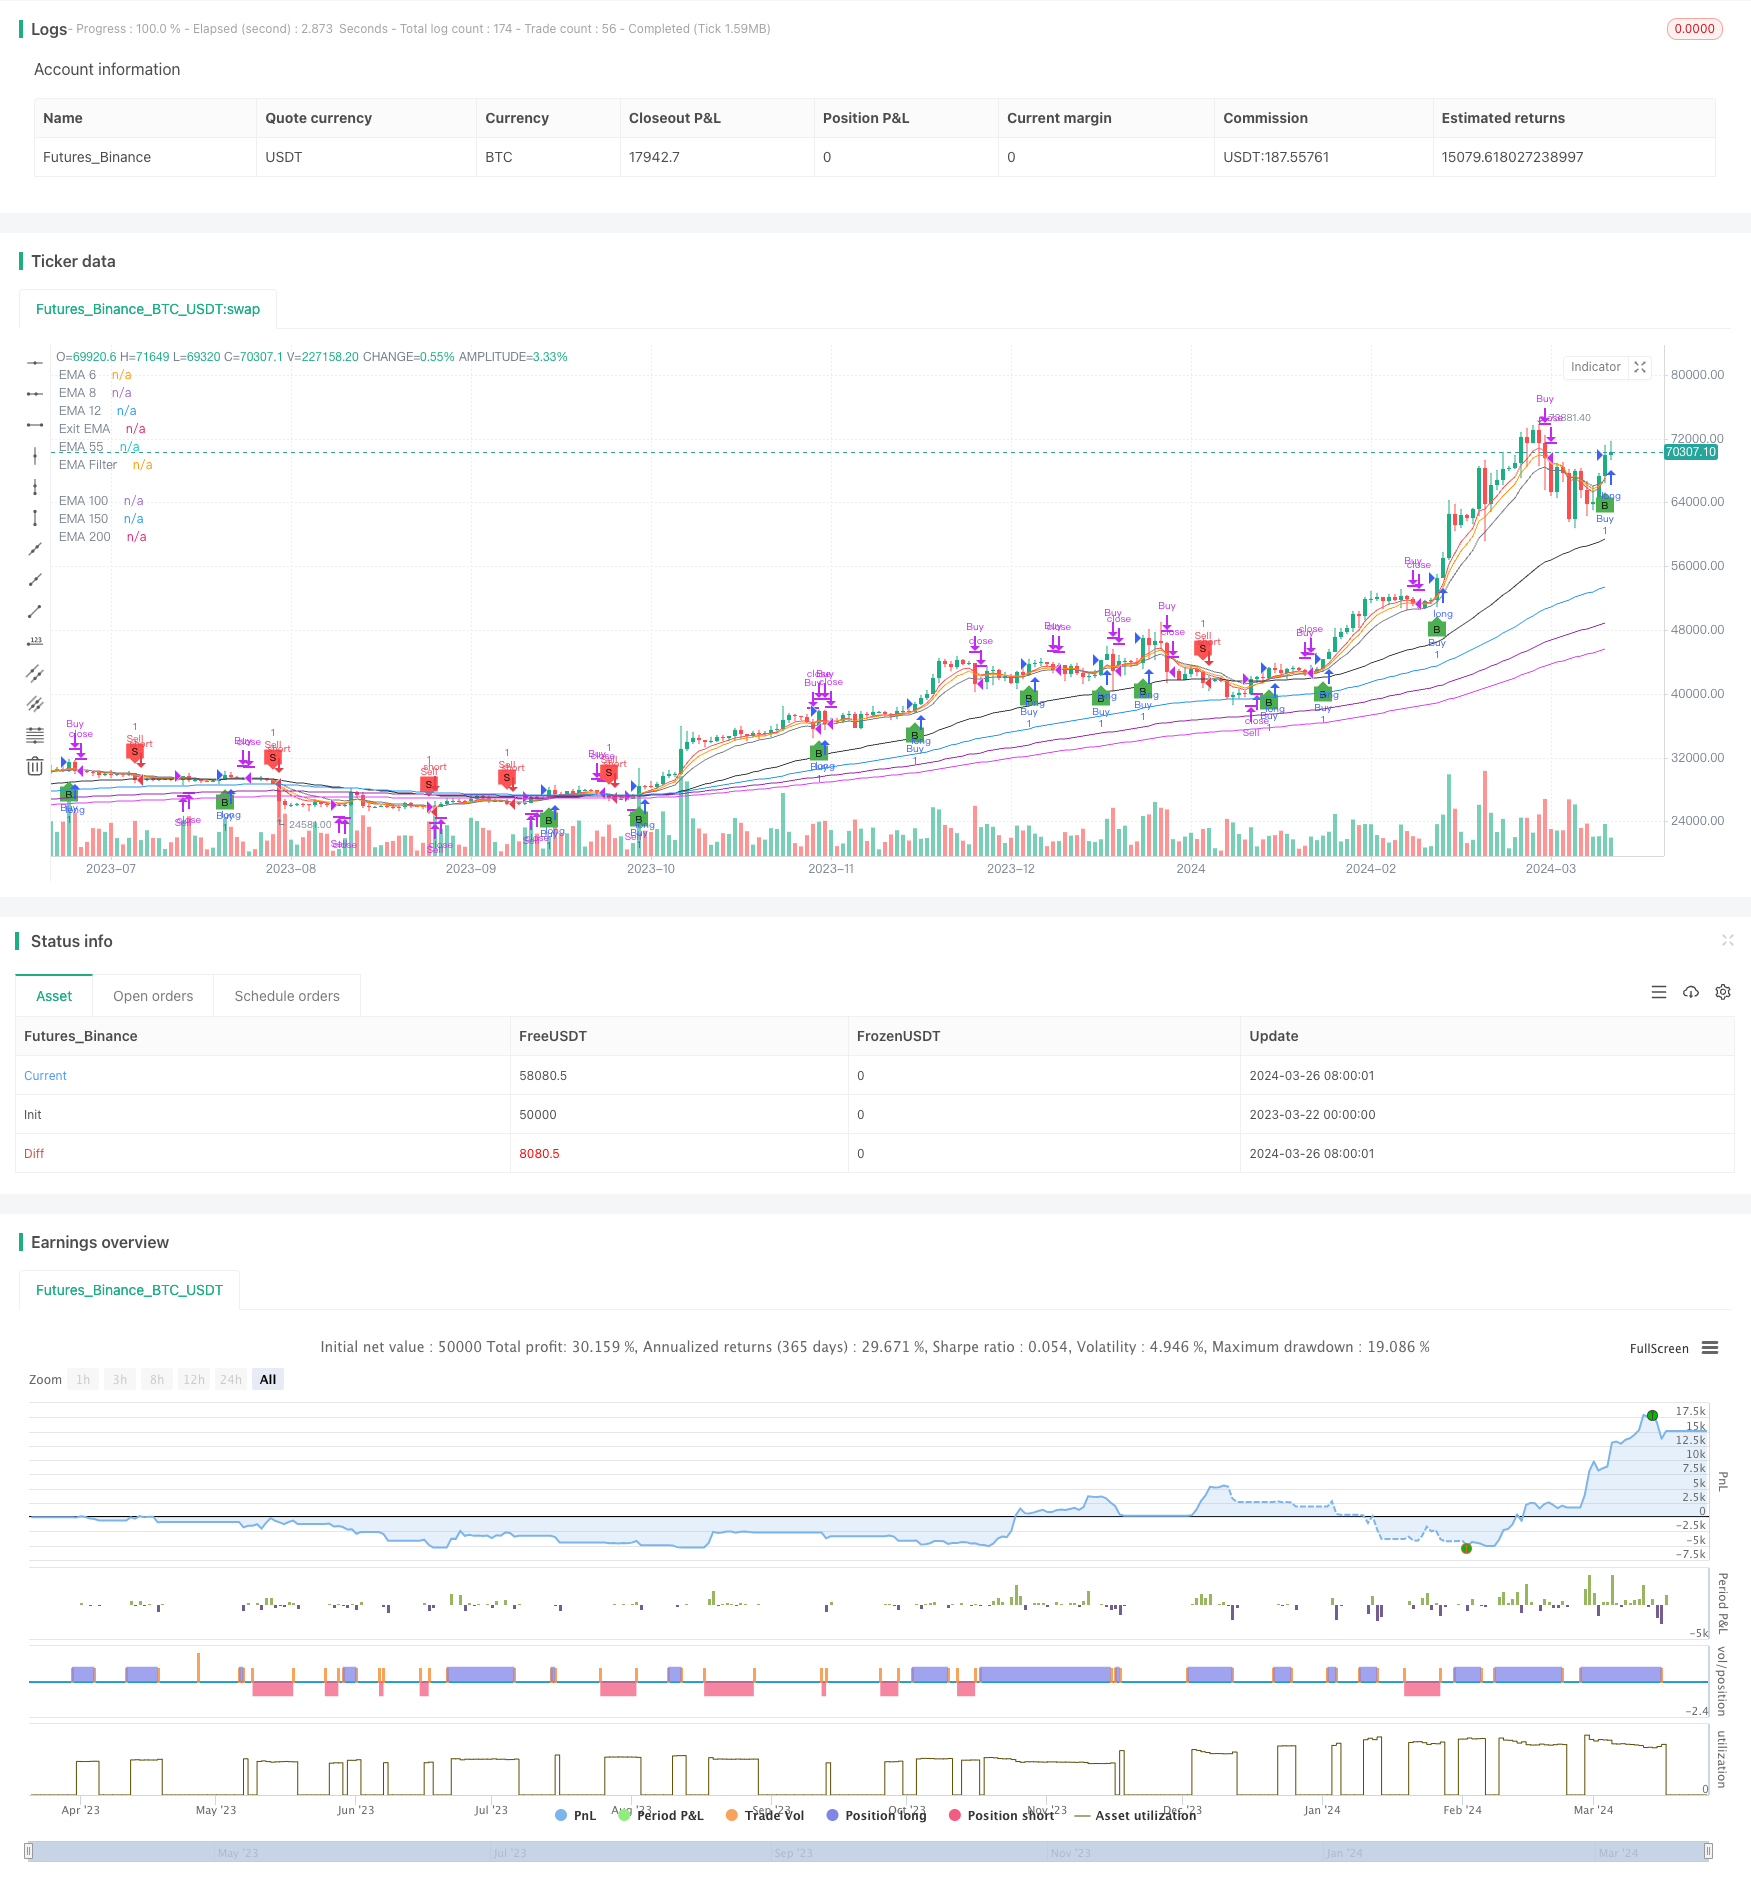
전략 개요
이 전략은 여러 지수 이동 평균 (EMA), 상대적으로 강한 지수 (RSI) 및 표준 격차 출구 조건에 기반한 잠재적인 매매 기회를 식별하기 위해 여러 지수 이동 평균 (EMA), 상대적으로 약한 지수 (RSI) 및 표준 격차 출구 조건을 결합합니다. 단기 (6,8,12일), 중기 (5,55) 및 장기 (150일,200일,250일) 의 EMA를 사용하여 시장 추세의 방향과 강도를 분석합니다. RSI는 조정 가능한 구매 (~30) 및 판매 (~70) 경계를 사용하여 동력을 평가하고 과매 또는 과매를 식별합니다.
전략 원칙
- 여러 주기의 EMA ((6, 8, 12, 55, 100, 150, 200) 을 계산하여 시장을 평가하는 시각적 참조로 사용한다.
- 사용자가 입력한 선 수 ((3-4根) 에 따라, 최근 N根線의 최고 가격과 최저 가격을 계산한다.
- 구매 조건: 현재 종료 가격은 최근 N 루트 선의 최고 가격보다 높고, EMA 필터 ((만일 활성화) 보다 높다.
- 매각 조건: 현재 매각 가격은 최근 N 루트 선의 최저 가격보다 낮고 EMA 필터 (만약 활성화된 경우) 보다 낮다.
- 장점 출구 조건: 현재 종결 가격은 12일 EMA + 0.5배 표준 차점 이하, 또는 12일 EMA 이하이다.
- 짧은 입점 출구 조건: 현재 종료 가격은 12일 EMA보다 높습니다 - 0.5배 표준 차, 또는 12일 EMA보다 높습니다.
- RSI를 보조 지표로 사용하여, 기본 주기는 14이며, 초상도 시한은 30이며, 초상도 시한은 70이다.
전략적 이점
- 트렌드 트래킹 (다중 EMA) 과 동력 (RSI) 두 차원을 결합하여 더 포괄적인 시장 분석 관점을 제공합니다.
- 독특한 표준 격차 기반의 출전 메커니즘은 수익을 보호하고 위험을 통제하는 균형을 이룰 수 있습니다.
- 코드 모듈화가 높고, 핵심 파라미터가 사용자에 의해 구성될 수 있으며, 유연성이 강하다.
- 다양한 종류와 시간대에 적용되며, 특히 일선의 주식과 비트코인 거래에 적합하다.
위험 분석
- 위기시장이나 트렌드 반전의 초기에는 잘못된 신호가 자주 발생하여 연속적인 손실이 발생한다.
- 기본 파라미터는 모든 시장 환경에 적합하지 않으며, 피드백과 함께 파라미터를 최적화해야 한다.
- 이 전략에만 의존하는 거래는 위험합니다. 다른 지표와 결합하여 저항 수준을 지원하는 보조 의사 결정이 권장됩니다.
- 급격한 주요 사건에 대한 반응이 느리다.
최적화 방향
- EMA와 RSI 파라미터를 최적화합니다: 품종, 주기 및 시장 특성에 따라 다양한 파라미터 조합을 소작하여 최적의 파라미터 범위를 찾습니다.
- 손해 막기 메커니즘을 추가: ATR과 같은 변동률 지표를 참조하고, 합리적인 손해와 막점을 설정하고, 단일 거래 위험을 제어한다.
- 포지션 관리를 도입: 트렌드 강도 (ADX와 같은) 또는 핵심 지지 저항 지점으로부터 멀리 떨어져있는 위치에 따라 포지션 크기를 조정할 수 있다.
- 다른 기술 지표의 조합과 함께 사용: 예를 들어, 브린 밴드, MACD, 평선 교차 등, 평점 포지션 신호의 신뢰성을 높인다.
- 분시장 상태 최적화: 트렌드, 흔들림, 전환 등 다양한 시장 상태에 대해 각각 최적화 파라미터의 조합.
요약하다
이 글은 다중 이동 평균, RSI 및 표준 오차 출구에 기반한 선 선 고도 돌파 트레이딩 전략을 제시한다. 이 전략은 추세와 동력의 두 차원에서 시장을 분석하며, 독특한 표준 오차 출구 메커니즘을 사용하며, 트렌드 기회를 잡는 동시에 위험을 통제한다. 전략이 명확하고, 논리적으로 엄격하며, 코드가 간단하고 효율적으로 구현된다.
전략 소스 코드
/*backtest
start: 2023-03-22 00:00:00
end: 2024-03-27 00:00:00
period: 1d
basePeriod: 1h
exchanges: [{"eid":"Futures_Binance","currency":"BTC_USDT"}]
*/

//@version=5
strategy("Candle Height Breakout with Configurable Exit and Signal Control", shorttitle="CHB Single Signal", overlay=true)

// Input parameters for EMA filter and its length
useEmaFilter = input.bool(true, "Use EMA Filter", group="Entry Conditions")
emaFilterLength = input.int(55, "EMA Filter Length", minval=1, group="Entry Conditions")
candleCount = input.int(4, "SamG Configurable Candle Count for Entry", minval=3, maxval=4, step=1, group="Entry Conditions")
exitEmaLength = input.int(12, "Exit EMA Length", minval=1, group="Exit Conditions", defval=12)
exitStdDevMultiplier = input.float(0.5, "Exit Std Dev Multiplier", minval=0.1, maxval=2.0, step=0.1, group="Exit Conditions")

// State variables to track if we are in a long or short position
var bool inLong = false
var bool inShort = false

// Calculating EMAs with fixed periods for visual reference
ema6 = ta.ema(close, 6)
ema8 = ta.ema(close, 8)
ema12 = ta.ema(close, 12)
ema55 = ta.ema(close, 55)
ema100 = ta.ema(close, 100)
ema150 = ta.ema(close, 150)
ema200 = ta.ema(close, 200)
emaFilter = ta.ema(close, emaFilterLength)
exitEma = ta.ema(close, exitEmaLength)

// Plotting EMAs
plot(ema6, "EMA 6", color=color.red)
plot(ema8, "EMA 8", color=color.orange)
plot(ema12, "EMA 12", color=color.yellow)
plot(ema55, "EMA 55", color=color.green)
plot(ema100, "EMA 100", color=color.blue)
plot(ema150, "EMA 150", color=color.purple)
plot(ema200, "EMA 200", color=color.fuchsia)
plot(emaFilter, "EMA Filter", color=color.black)
plot(exitEma, "Exit EMA", color=color.gray)

// Calculating the highest and lowest of the last N candles based on user input
highestOfN = ta.highest(high[1], candleCount)
lowestOfN = ta.lowest(low[1], candleCount)

// Entry Conditions with EMA Filter
longEntryCondition = not inLong and not inShort and (close > highestOfN) and (not useEmaFilter or (useEmaFilter and close > emaFilter))
shortEntryCondition = not inLong and not inShort and (close < lowestOfN) and (not useEmaFilter or (useEmaFilter and close < emaFilter))

// Update position state on entry
if (longEntryCondition)
    strategy.entry("Buy", strategy.long, comment="B")
    inLong := true
    inShort := false

if (shortEntryCondition)
    strategy.entry("Sell", strategy.short, comment="S")
    inLong := false
    inShort := true

// Exit Conditions based on configurable EMA and Std Dev Multiplier
smaForExit = ta.sma(close, exitEmaLength)
upperExitBand = smaForExit + exitStdDevMultiplier * ta.stdev(close, exitEmaLength)
lowerExitBand = smaForExit - exitStdDevMultiplier * ta.stdev(close, exitEmaLength)

exitConditionLong = inLong and (close < upperExitBand or close < exitEma)
exitConditionShort = inShort and (close > lowerExitBand or close > exitEma)

// Strategy exits
if (exitConditionLong)
    strategy.close("Buy", comment="Exit")
    inLong := false

if (exitConditionShort)
    strategy.close("Sell", comment="Exit")
    inShort := false

// Visualizing entry and exit points
plotshape(series=longEntryCondition, style=shape.labelup, location=location.belowbar, color=color.green, size=size.tiny, title="Buy Signal", text="B")
plotshape(series=shortEntryCondition, style=shape.labeldown, location=location.abovebar, color=color.red, size=size.tiny, title="Sell Signal", text="S")